This is a repository copy of Comparing Tangible and Multi-touch Interaction for Interactive
Data Visualization Tasks.
White Rose Research Online URL for this paper:
http://eprints.whiterose.ac.uk/92246/
Version: Accepted Version
Proceedings Paper:
Al-Megren, S and Ruddle, RA (2016) Comparing Tangible and Multi-touch Interaction for
Interactive Data Visualization Tasks. In: Proceedings of the TEI '16. 10th International
Conference on Tangible, Embedded and Embodied Interaction, 14-17 Feb 2016,
Eindhoven, Netherlands. ACM , pp. 279-286. ISBN 978-1-4503-3582-9
https://doi.org/10.1145/2839462.2839464
[email protected] https://eprints.whiterose.ac.uk/
Reuse
Unless indicated otherwise, fulltext items are protected by copyright with all rights reserved. The copyright exception in section 29 of the Copyright, Designs and Patents Act 1988 allows the making of a single copy solely for the purpose of non-commercial research or private study within the limits of fair dealing. The publisher or other rights-holder may allow further reproduction and re-use of this version - refer to the White Rose Research Online record for this item. Where records identify the publisher as the copyright holder, users can verify any specific terms of use on the publisher’s website.
Takedown
If you consider content in White Rose Research Online to be in breach of UK law, please notify us by
Comparing Tangible and Multi-touch Interaction for
Interactive Data Visualization Tasks
Shiroq Al-Megren
University of Leeds
Leeds, United Kingdom
[email protected]
Roy A. Ruddle
University of Leeds
Leeds, United Kingdom
[email protected]
ABSTRACT
Interactive visualization plays a key role in the analysis of large datasets. It can help users to explore data, investigate hypotheses and find patterns. The easier and more tangible the interaction, the more likely it is to enhance understand-ing. This paper presents a tabletop Tangible User Interface (TUI) for interactive data visualization and offers two main contributions. First, we highlight the functional requirements for a data visualization interface and present a tabletop TUI that combines tangible objects with multi-touch interaction. Second, we compare the performance of the tabletop TUI and a multi-touch interface. The results show that participants found patterns faster with the TUI. This was due to the fact that they adopted a more effective strategy using the tabletop TUI than the multi-touch interface.
ACM Classification Keywords
H.5.2. Information Interfaces and Presentation (e.g., HCI): User Interfaces
Author Keywords
Tangible User Interface; tabletop display; visualization; tangible interaction; biological data; multi-touch.
INTRODUCTION
In TUIs physical objects are used as containers and controls for digital information. Tangible interaction research is in-formed by theoretical foundations that include affordance and constraints, semiotics, bimanual interaction, and epistemic ac-tions [19]. The novelty of TUIs has sparked interest in various fields of application. However, there has been comparatively little research into their use for complex data analysis, despite the fact that current visualization systems could clearly benefit from more flexible interfaces.
Visualization tools are integral to complex data analysis. Do-main experts use highly interactive visualization processes to explore data, investigate hypotheses and find patterns. Users perform literally hundreds of motor actions in the course of an
Permission to make digital or hard copies of all or part of this work for personal or classroom use is granted without fee provided that copies are not made or distributed for profit or commercial advantage and that copies bear this notice and the full citation on the first page. Copyrights for components of this work owned by others than ACM must be honored. Abstracting with credit is permitted. To copy otherwise, or republish, to post on servers or to redistribute to lists, requires prior specific permission and/or a fee. Request permissions from [email protected].
TEI ’16, February 14-17, 2016, Eindhoven, Netherlands. ©2016 ACM. ISBN 978-1-4503-3582-9/16/02. . . $15.00. DOI: http://dx.doi.org/10.1145/2839462.2839464
analysis [17] to access data, perform calculations, adjust pa-rameters and manipulate windows. Most systems only support mouse and keyboard interaction, although some post-WIMP (Windows, Icons, Menu, Point) setups use projections onto walls and tabletops [11, 14, 18, 20, 21].
This paper outlines the design of a tabletop TUI for interac-tive data visualization, and it makes two main contributions. First, we present a tabletop TUI that combines multi-touch and tangible interactions for data visualization. Second, we compare the tabletop TUI with a multi-touch interface and find substantive differences in terms of performance and strategy.
RELATED WORK
In this section we first summarize previous research that com-pares tangible and multi-touch interfaces for a variety of tasks. We then provide a brief overview of earlier work that uses tangible interactions for data visualization.
In everyday interactions with the physical world, people use both hands to carry out tasks (bimanualism). Although both tangible and multi-touch interfaces promote bimanualism, some studies report cases where participants do not use it with either type of interface (e.g. [24]), while others report positive results for bimanualism with both tangible [23] and multi-touch [4] interfaces. This difference could relate to the design of the system and the nature of the task. Neverthe-less, TUIs have been found to perform better than multi-touch interfaces in manipulation and acquisition [24], sorting [23], grouping [15], and layout manipulation [12] tasks.
Object manipulation can be divided into two classes: (a) prag-matic, and (b) epistemic. Pragmatic actions bring a person closer to their goal. Epistemic actions change the world and simplify the task, but do not necessarily bring the person closer to their goal [10]. In other words, epistemic actions arise from a cognitive strategy that involves adapting the surrounding environment to solve a problem. In a spatial problem-solving task carried out with both tangible and multi-touch interfaces, tangible interaction enabled more effective and efficient se-quences of pragmatic and epistemic actions [1]. For a four-in-a-row mouse game, touch and tangible versions of the task were compared to determine cognitive benefits and found that epistemic actions and projection were excuted more rapidily for the tangible interface [7].
Generic Task eQTL Task Touch Tangible
Import Open/close file Open: drag and drop file from file ex-plorer to the surface; Close: drag and drop file to recycle bin
Open: couple gene object to file and place on surface; Close: Place gene ob-ject on obob-ject recycler
Encode Display and switch win-dows
Select window from ‘View’ menu Rotate object and place on surface.
Navigate Scroll/pan/zoom Scroll: Swipe up/down or move scroll bar; Pan: Swipe in the opposite direction of intended pan; Zoom: Pinch out/in to zoom in/out
Same as touch interaction
Select Select SNPs Select data point in plot or row in table Same as touch interaction Arrange Organize windows Drag window on surface Drag object on surface Filter/Change Filter data Select filtering from ‘Threshold’ menu
and rotate dial
Place SNP object on window and rotate dial
Aggregate Combine files Select file from ‘Group’ menu Tap object on file window
[image:3.612.322.564.299.397.2]Derive Match SNPs significance Select file from ‘Threshold’ menu Place SNP object on another file’s win-dow
Table 1. The generic visualization tasks (see [3]), and the multi-touch and tangible interaction provided for each of our eQTL tasks.
the class that our research addresses as it concerns the methods used by users to interact. It is subdivided into the following tasks: encode, manipulate (select, navigate, arrange, change, filter and aggregate) and introduce (annotate, import, derive and record). The manner in which users perform each of these tasks depends on the details of the interface implementation and the devices that are used [3].
Some visualization research combines vertical projection dis-plays with tangible objects to physically interact with data. In one demonstration, tangible objects represented search cri-teria where its range could be manipulated. The evaluation of the system validated users’ understanding of the concepts [11]. Another example is Artviz, an interface that combines advanced visualization techniques and tangible interactions to explore artwork. It allows users to navigate a large collec-tion of artwork on a graphical display using USB-controlled plug-and-play hardware components [5].
Tabletops with tangible user interfaces are, in principle, well-suited to the visualization of scientific datasets, and previous research has investigated their application in various domains. One example is a museum exhibit that enables users to explore the distribution of oceanic phytoplankton using ring objects and a 55-inch custom-built table. Compared to a multi-touch interface, the tangible exhibit improved affordance, which at-tracted groups and invited further exploration [14]. Another example is G-nome surfer, which is a multi-touch tabletop interface that uses tangible objects as containers for gene-related information. The system was compared to a traditional GUI and multi-mouse GUI setups and was found (along with the multi-mouse setup) to reduce workload and stress levels. Moreover, it proved superior as it encouraged participation and reflection [20]. Finally, a tabletop interface that incorporates tokens to explore phylogenetic trees performed better that a tra-ditional pen-and-paper approach in encouraging collaboration and improving learning performance [18].
Figure 1. A Manhattan plot of an eQTL study of the CNTN2 gene as transcribed in the brain. The data points represent SNPs plotted against their chromosomal position and−log10psignificance (Chr =
chromo-some; SNP = single nucleotide polymorphism). Despite the plot’s ap-pearance, each data point has a unique position (the human genome has 3 billion SNPs). The plot was generated using Haploview [2].
Other research has explored visualization systems where tan-gible objects did not only act as controls, but also physically visualized the data or where data were projected virtually onto the objects. Tangible views used lightweight objects asso-ciated with a tabletop to explore visualizations, by moving the objects on or above the tabletop’s surface [21]. Tangi-ble models of biological molecules enhanced with augmented reality have been developed and found to help in improving and communicating understanding [8]. Emerge is a physical dynamic bar chart developed to support analysis technique. Initial insights from a user study evaluating 14 analysis-based interaction techniques found interacting with the physical sys-tem to be intuitive and informative [22].
ANALYSIS SCENARIO
Figure 2. The multi-touch version of the eQTL visualization tool. (A) Two gene expression files, CNTN1 and CNTN5, are displayed as a ta-ble and plot respectively. Significant SNPs collected from CNTN1 are highlighted in the CNTN5 plot window. (B) Three gene expression files (CNAP2, CNTN1 and CNTN5) are combined and their plots overlaid to discern patterns. SNPs from the combination are collected using a threshold dial appearing on top of the plot window. A list of SNPs col-lected from another combination is also shown.
determined during semi-structured interviews with four biolo-gists with expertise in QTL and human epidemiology genetics. All of the interviews were conducted and audio-recorded at the analysts’ place of work, and lasted from 40 to 90 minutes.
A typical eQTL study involves the collection and analysis of hundreds of thousands of genetic variants (single nucleotide polymorphisms, SNPs) from a number of individuals, together with gene expression measurements that regulate how a gene would be expressed in a trait. The mapping process runs a single gene expression measurement against genome-wide ge-netic variants, resulting in significance values associating each genetic variant with that gene expression. A key aim of eQTL analysis is to identify risk genes for diseases (e.g. a particular variant of breast cancer) so that appropriate treatments may be chosen for specific patients (i.e. stratified medicine).
The remainder of this section focuses on the part of eQTL analysis where data visualization plays an important role. The details are, of course, specific to eQTL. However, the tasks that users perform generalize to those performed in other visual-ization applications. This is shown by the similarities between the tasks in our eQTL scenario and those identified in Brehmer and Munzner’s wide-ranging review [3] (see Table 1).
In eQTL data visualization, a biologist typically performs the following tasks. First, they open files from eQTL bioinfor-matics calculations to display the output for each gene in a table and/or as a Manhattan plot (see Figure 1). They then in-teractively investigate patterns by scrolling/panning/zooming the tables and/or the Manhattan plots. Multiple files can be viewed at the same time in different windows. In one of the open windows, the biologist filters the data (e.g. selects spe-cific chromosomes), adjusts the threshold (e.g. the significance threshold), and drills down to additional information that is stored in external data sources (e.g. diseases known to be associated with specific genes or SNPs). The files holding the results are explored independently, and patterns shared with other gene expressions are only discerned after exploring each file individually. Therefore, a clear improvement would be to combine multiple result files so that similarities could be identified in order to determine SNPs that are significant across a set of gene expressions.
APPLICATION FOR EQTL VISUALIZATION
An eQTL visualization application was developed for a table-top display, using C#, Windows Presentation Foundation (WPF), and Microsoft Surface SDK. Visualizations were implemented using OxyPlot (http://oxyplot.org), an open source, cross-platform plotting library for .NET.
A Samsung SUR40 tabletop with PixelSense technology was used as an interactive surface. The large screen size and FullHD (1920 x 1080 pixels) resolution of this interactive surface proved suitable for the scale of the data used in eQTL studies. Surfaces such as the SUR40 accommodate both tangi-ble and multi-touch interaction.
As outlined in the previous section, two levels of data abstrac-tions are manipulated to identify areas, or SNPs, of interest: gene expression files and the underlying SNP collections. The remainder of this section describes how users perform the tasks listed in Table 1 with the multi-touch interface (supplementary video is found athttps://youtu.be/HO1ED6ATWyc).
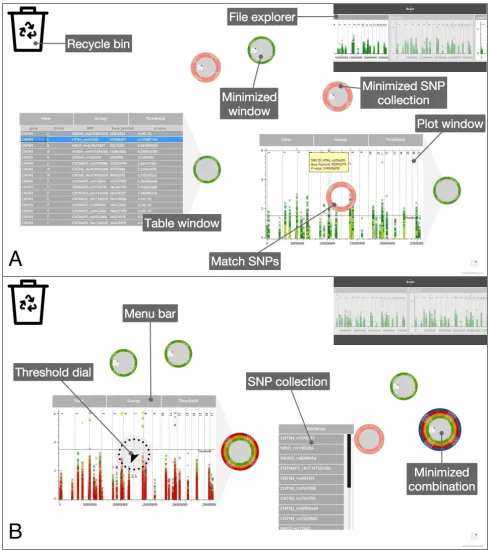
To open a gene expression file, they drag and drop a file’s thumbnail from the ‘file explorer’ onto the surface. To close a file they drag and drop the file into the ’recycle bin’ (see touch UI Video: Open and close files). Each file has a menu bar anchored to the top of the window with ‘View’, ‘Group’, and ‘Threshold’ drop-down menus (see touch UI Video: display and switch windows). The default view of a file is a Man-hattan plot, but this can be changed to a table or minimized by selecting the desired window from the ‘View’ menu via a touch tap or press. Figure 2A shows the three ways that a file can be displayed: table, plot and minimized.
Figure 3. The TUI version of the eQTL visualization tool, showing the same analysis steps as Figure 2A and B.
To filter the significance threshold and extract significant SNPs, a user selects the threshold dial from the ‘Threshold’ menu. Using a tap and drag they then adjust the dial to the desired significance level. Another menu selection displays the SNPs collected when adjusting the dial (see touch UI Video: Filter data). Figure 2B shows a plot combination with a threshold dial that is adjusted to 3.5. SNPs that fall above that threshold are stored internally and are displayed when needed.
One way a user can explore the significance of SNPs across files is by comparing a collection of SNPs from one file with another. This is achieved by filtering the first file (as described above), then opening another file and selecting ‘Compare’ from the ‘Threshold’ menu. This action highlights the signifi-cant SNPs in the new file (see Figure 2A and touch UI Video: Filter data and compare with another file). A second way to do this is to combine the files by selecting the second file from the ‘Group’ menu, and then filtering as before. This action collects SNPs that satisfy the threshold criterion in both files (see Figure 2B and touch UI Video: Combine files and filter data).
TANGIBLE INTERACTIVE VISUALIZATION
This section describes the tabletop TUI that was developed for use with the eQTL visualization application that was described in the previous section. The system consisted of two main components: physical objects and the software interface.
Physical Objects
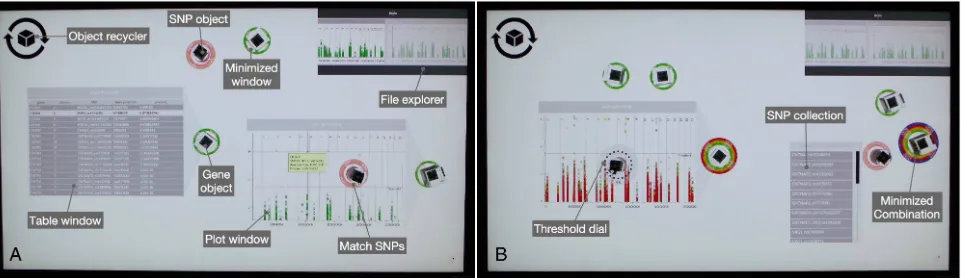
The tangible interface uses two types of physical object, one for genes and another for SNPs. As the data is inherently abstract, generic shapes of object (cube and cylinder) were deemed suitable to act as tokens and controls in the interface. The shapes of objects were determined by mapping a value or state to various types of surfaces [16]. The objects were made reusable via the object recycler (see Figure 3) to minimize clutter. By economizing on object use, the interface can be scaled to reflect the large number of gene expression files that are investigated in eQTL studies.
Cube-shaped acrylic objects are used to represent gene files and act both as containers for their datasets and as controls. Each gene object has a fiducial tag on three sides that offer table, plot and minimized views.
Cylindrical acrylic objects represent a subset of SNPs col-lected from a gene file. SNP objects are used to filter gene files and collect SNPs to be viewed elsewhere. The flat ends of the cylinder are used to change from viewing mode to a filtering/highlighting control, while the convex surface of the cylinder is used with the filtering control to imitate a dial.
The size of the objects was decided by two factors: the size of the fiducial tags (used to identify the various values and states), and the ability to manipulate the object with one hand (to encourage bimanualism and epistemic actions). It was also important to be able to manipulate an object eyes-free [9], e.g. to move an object with one hand while concentrating on performing another task with the other hand.
Interface Software
During the development of the system, decisions were made about the allocation of functionality to multi-touch or tangi-ble interaction (see Tatangi-ble 1). The tangitangi-ble interface uses the metaphor of objects as containers for files or subsets of files. Dedicated physical objects enable eyes-free control, strong one-to-one mapping and natural contact. To match multi-touch interface’s capabilities and reduce clutter, physical objects were made recyclable.
Multi-touch interaction was used for actions that are familiar and frequently used in touch environments, for example se-lection, panning, zooming, and scrolling. This decision was also informed by the need for users to focus on files when manipulating them to achieve a certain goal.
To open a gene expression file, a user first couples a gene object with a file by placing it on the file’s thumbnail from the ‘file explorer’ menu, and then on the surface to display the default plot window. To close a file a user recycles the object by placing it on the ‘object recycler’ (see TUI Video: Open and close files). A file’s default view is a Manhattan plot, but this can be changed by rotating the cubic gene object (see TUI Video: Display and switch windows). Figure 3A shows three objects displaying their virtual content as table, plot, and minimized.
Video: Select SNPs; Scroll, pan, and zoom), because those types of interaction are not particularly well-suited to physical objects. However, with the tangible interface users organized windows by moving the objects around the surface rather than dragging with a finger.
To filter the significance threshold and extract significant SNPs, a user places a SNP object on a file window to display the threshold dial. The cylinder object is then rotated to adjust the dial to the desired significance level. The extracted collection is then viewed by placing the SNP object on the surface, which displays a list of the collected SNPs that satisfy the criterion (see TUI Video: Filter data). The combination plot in Figure 3B, using a SNP object, is superimposed with a threshold dial that is adjusted to 3.5. SNPs that fall above that threshold are collected and contained within that object.
One way a user can explore SNP significance across files is by highlighting SNP collections in other files. This is achieved by filtering the first file (as described above), and then placing the SNP object on another file’s window. This highlights the SNPs contained within that object in the new file (see Figure 3A and TUI Video: Filter data and compare with another file). Another way a user can explore SNP significance across gene files is to first combine files, and then filter the threshold criterion. A user combines files by tapping gene objects on the file’s window and then using a SNP object to filter the combination of files. This action collects SNPs that satisfy the threshold criterion set across the combined files (see Figure 3B and TUI Video: Combine files and filter data).
EXPERIMENT
To investigate our system’s strengths and limitations, we con-ducted a between-participants experiment that compared the new system against a multi-touch version. We studied similar-ities and differences in terms of performance and behaviour, and made the following hypotheses:
H1: By promoting bimanual interaction, the tangible interface would reduce the time needed to explore combinations of genes and SNPs, and thus shorten the time needed to complete the task compared to multi-touch interaction.
H2: The adoption of epistemic actions would result in more efficient data exploration using the tangible rather than the multi-touch interaction.
Method
Twenty individuals (8 men, 12 women) with a mean age of 25.45 years (SD=9.01) took part. All participants were right-handed and familiar with touch technology from everyday usage of tablets/phones. The participants were university students and, with one exception, had little background in quantitative genomics. All participants gave informed consent and were paid for their participation. The experiment was approved by the Faculty Ethics Committee.
Procedure
Each participant was randomly assigned to one of the two experimental conditions (tangible vs. multi-touch). Sessions were held in a quiet laboratory space. Each session lasted around 90 minutes.
Task One
file Two files
Three files
Four files
Five files Total
Training 3 3(3) 1(0) - - 7(6)
Practice 4 6(6) 4(4) 1(0) - 15(14)
Task 1 5 10(10) 10(5) 5(0) 1(0) 31(20)
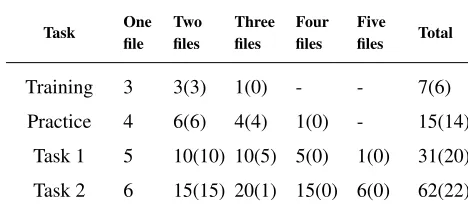
[image:6.612.324.558.64.169.2]Task 2 6 15(15) 20(1) 15(0) 6(0) 62(22)
Table 2. Mean number of file combinations that were checked for each task. The minimum number of combinations that needed to be checked is shown in parentheses.
First, a participant was given a 10-minute demonstration of how to use the system. They then received verbal instructions about the tasks to be carried out and began the training task. Training started with the experimenter opening one file, setting a significance threshold, and recording the number of SNPs for that file. The participant was then asked to do the same with a second file. Similarly a combination was explored by the experimenter first, and then the participant was asked to do the same with another combination. In each session, the same files were opened by the experimenter thus allowing the participants to develop their own strategy when exploring com-binations. After training had been completed, the instructions were repeated for the practice task, task 1 and task 2. Between tasks the participant took a two-minute rest.
The experiment concluded with the participant completing the Usefulness, Satisfaction, and Ease of use (USE) questionnaire [13], which gathered feedback about the usability of the system and its interface on a seven-point Likert scale.
Experimental Task
Participants were asked to explore all possible combinations of gene expression files to identify intersecting SNPs that satis-fied the threshold criterion. The task involved the exploration of individual files and combinations of files for significant SNPs and significant intersecting SNPs, respectively. The SNPs needed to satisfy a significance threshold ranging from
−log103 to 5, which was provided to participants at the start of each task. During task execution, participants needed to open/close files, combine them, and adjust the threshold to identify significant SNPs. They also had to record the results in a table with columns for the file name(s), the number of significant SNPs, a tick box to indicate that a screenshot had been recorded by clicking on a ‘record’ button found at the corner of the screen. All interactions were recorded in a log file, and observed by the experimenter.
Figure 4. Mean task completion time for each condition and task. Error bars show the standard error of the mean (SE).
Results
The results were analysed using mixed factorial analyses of variance (ANOVAs) that treated the interface as a between-participants factor (tangible vs. multi-touch) and the task as a repeated measure (task 1 vs. task 2).
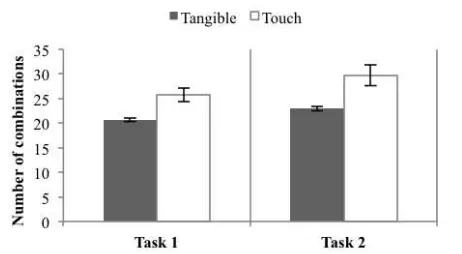
Overall performance was measured by calculating the total time that participants took to complete each task. An ANOVA showed that task completion was significantly faster with the tangible than the multi-touch interface(F1,18=6.64,p=.02),
and significantly faster in task 1 than task 2 (F1,18=14.89,p=
.001). There was also a significant interface×task interaction
(F1,18=10.74,p=.004), with the time difference between
the two interfaces increasing with number of files involved in the task (see Figure 4).
To investigate the overall performance difference, two separate analyses were performed. First, the time that participants took to check each combination of files was calculated from the log file data (this was measured as the time between the start and the end of a combination). An ANOVA showed that there was no significant difference between the conditions (F1,18=.35,p=.56) or tasks (F1,18=.06,p=.81). Second,
the number of combinations that participants checked in each task was analysed. An ANOVA showed that they checked fewer combinations with the tangible than the multi-touch interface (F1,18=13.93,p=.002). Furthermore, fewer files
were explored in task 1 than task 2 (F1,18=11.89,p=.003).
See Figure 5.
The experimental task can be represented as a tree that par-ticipants needed to traverse: the root is the start of the task, the individual files are at level 1, combinations involving two files are at level 2, and so on. Three strategies were adopted by participants to traverse the tree: breadth-first, depth-first, and mixed.
[image:7.612.68.294.77.203.2]A breadth-first traversal goes through combinations level-by-level, and starts by checking all combinations that involve pairs of files. A depth-first traversal completes checks for a given branch of the tree (e.g., all combinations that involve two particular files) before exploring sibling combinations. The mixed approach traverses the tree two levels at a time,
Figure 5. Total number of file combinations for each condition and task. Error bars show the standard error of the means (SE).
combining depth- and first strategies. The breadth-first strategy allowed participants to eliminate the most file combinations, and speeded up the analysis.
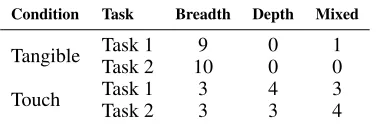
Most participants in the tangible condition used a breadth-first traversal for both tasks, whereas in the multi-touch condition they adopted all three strategies (see Table 3). Most partici-pants used the same strategy for both tasks.
Three sources of inefficiency were noted:repetition(checking the same combination of files twice),unnecessary(the result of a previous combination meant that it was impossible for the present combination to have any shared significant SNPs), andstrategy(it would not have been necessary to check the combination if a more effective strategy had been adopted). Unnecessary and strategy inefficiencies accounted for most of the additional analyses that participants performed with the touch interface (see Table 4).
The USE questionnaire data indicated that the participants found the tabletop tangible interface to be slightly more useful, easier to use, easier to learn and satisfactory. However, the multi-touch interface was rated slightly higher for the time it took to learn and its simplicity. Subsequent analysis with Bonferroni-corrected t-tests showed that none of the differ-ences were significant.
Discussion
Participants completed the interactive visualization task sig-nificantly faster with the tabletop tangible than with the multi-touch interface. This section discusses that finding in the context of our hypotheses regarding bimanual interaction (H1) and epistemic actions (H2).
inter-Condition Task Breadth Depth Mixed
Tangible Task 1 9 0 1
Task 2 10 0 0
Touch Task 1 3 4 3
[image:8.612.83.271.64.126.2]Task 2 3 3 4
Table 3. Strategies adopted by participants for each condition and task.
action would encourage bimanual interaction and reduce the time it took to analyse file combinations.
Epistemic actions are used to change the physical world and simplify tasks, rather than move towards a goal [10]. Findings from previous studies suggest that tangible interaction and TUIs use epistemic actions and thus encourage more effective and efficient motor-cognitive strategies to solve tasks [1, 7]. We hypothesized (H2) that the adoption of epistemic actions would result in more efficient exploration during data visu-alization when interaction took place with tangible objects rather than multi-touch. The results supported H2, as partic-ipants explored combinations more efficiently. Repetitions and unnecessary explorations were reduced and more effective strategies were adopted. This in turn reduced the time spent on a task for tangible, compared with multi-touch, interaction.
As video recordings were not used, the full Artifact, Tool and Body (ATB) framework [6] could not be adopted for data analysis. However it proved helpful in the identification of the types of epistemic actions that participants adopted based on a combination of screenshots of participants’ results and the investigator’s observations. While epistemic actions were noted for the tabletop TUI for the majority of participants, it was not the case for the multi-touch interface. The rest of this section discusses the epistemic actions performed with the tabletop TUI.
Participants spatially arranged physical objects around the edges of the display as minimized windows. This arrangement was related to the task environment as it followed the order in which they were displayed in the file explorer. In most ses-sions, participants verbalized their thoughts, while their hands either pointed or hovered over an object prior to performing an action.
As combinations were being explored and evidence of rela-tionships between a number of gene expression files became apparent, most participants clustered and grouped physical objects together. With multiple clusters displayed, partici-pants brought the cluster they were ready to explore closer to them. While exploring a combination and adding/removing files from a combination, some participants designated areas around the view to arrange physical objects that had already been added, and those that would be added to the combination.
CONCLUSION AND FUTURE WORK
This paper makes two contributions. First, we described the design of a tabletop TUI that combined multi-touch and tangi-ble interactions for data visualization. Second, we reported on a user experiment that compared the tabletop TUI with a multi-touch interface. The results showed that participants found
Condition Task Repetition Unnecessary Strategy
Tangible Task 1 0 0.4 0.2
Task 2 0.1 0.8 0
Touch Task 1 0.7 2.6 2.4
Task 2 0.5 3.9 3.4
Table 4. Average distribution of inefficiencies for each condition and task.
patterns faster with the tangible than the multi-touch interface, as they adopted more effective strategies and performed fewer unnecessary analyses.
In future work we plan to extend the software to make it suitable for use in day-to-day eQTL data analysis, e.g. by linking genes and SNPs to external databases. We also intend to further evaluate the tabletop TUI against a GUI version, and conduct a field study of the software’s usage in a non-experimental setting.
REFERENCES
1. Alissa N. Antle and Sijie Wang. 2013. Comparing Motor-cognitive Strategies for Spatial Problem Solving with Tangible and Multi-touch Interfaces. InProceedings of the 7th International Conference on Tangible, Embedded and Embodied Interaction (TEI ’13). ACM, New York, NY, USA, 65–72.
2. Jeffrey C. Barrett. 2009. Haploview: Visualization and Analysis of SNP Genotype Data.Cold Spring Harbor Protocols2009, 10 (2009).
3. Matthew Brehmer and Tamara Munzner. 2013. A Multi-Level Typology of Abstract Visualization Tasks.
IEEE Transactions on Visualization and Computer Graphics19, 12 (Dec. 2013), 2376–2385.
4. Liam Don and Shamus P. Smith. 2010. Applying Bimanual Interaction Principles to Text Input on Multi-touch Surfaces and Tabletops. InACM
International Conference on Interactive Tabletops and Surfaces (ITS ’10). ACM, New York, NY, USA, 253–254.
5. Bruno Dumas, Bram Moerman, Sandra Trullemans, and Beat Signer. 2014. ArtVis: combining advanced
visualisation and tangible interaction for the exploration, analysis and browsing of digital artwork collections. In
Proceedings of the 2014 International Working
Conference on Advanced Visual Interfaces. ACM, 65–72.
6. Augusto Esteves, Saskia Bakker, Alissa N. Antle, Aaron May, Jillian Warren, and Ian Oakley. 2015. The ATB Framework: Quantifying and Classifying Epistemic Strategies in Tangible Problem-Solving Tasks. In
Proceedings of the Ninth International Conference on Tangible, Embedded, and Embodied Interaction (TEI ’15). ACM, New York, NY, USA, 13–20.
Proceedings of the 7th International Conference on Tangible, Embedded and Embodied Interaction (TEI ’13). ACM, New York, NY, USA, 167–174.
8. Alexandre Gillet, Michel Sanner, Daniel Stoffler, and Arthur Olson. 2005. Tangible Interfaces for Structural Molecular Biology.Structure13, 3 (March 2005), 483–491.
9. David Kirk, Abigail Sellen, Stuart Taylor, Nicolas Villar, and Shahram Izadi. 2009. Putting the Physical into the Digital: Issues in Designing Hybrid Interactive Surfaces. InProceedings of the 23rd British HCI Group Annual Conference on People and Computers: Celebrating People and Technology (BCS-HCI ’09). British Computer Society, Swinton, UK, 35–44.
10. David Kirsh and Paul Maglio. 1994. On Distinguishing Epistemic from Pragmatic Action.Cognitive Science18, 4 (1994), 513–549.
11. Stefanie Klum, Petra Isenberg, Ricardo Langner, Jean-Daniel Fekete, and Raimund Dachselt. 2012. Stackables: Combining Tangibles for Faceted Browsing. InProceedings of the International Working Conference on Advanced Visual Interfaces (AVI ’12). ACM, New York, NY, USA, 241–248.
12. Aurélien Lucchi, Patrick Jermann, Guillaume Zufferey, and Pierre Dillenbourg. 2010. An Empirical Evaluation of Touch and Tangible Interfaces for Tabletop Displays. InProceedings of the Fourth International Conference on Tangible, Embedded, and Embodied Interaction (TEI ’10). ACM, New York, NY, USA, 177–184.
13. Arnold M. Lund. 2001. Measuring Usability with the USE Questionnaire.STC Usability SIG Newsletter,8, 2 (2001).
14. Joyce Ma, Lisa Sindorf, Isaac Liao, and Jennifer Frazier. 2015. Using a Tangible Versus a Multi-touch Graphical User Interface to Support Data Exploration at a Museum Exhibit. InProceedings of the Ninth International Conference on Tangible, Embedded, and Embodied Interaction (TEI ’15). ACM, New York, NY, USA, 33–40.
15. Chris North, Tim Dwyer, Bongshin Lee, Danyel Fisher, Petra Isenberg, George Robertson, and Kori Inkpen. 2009. Understanding Multi-touch Manipulation for Surface Computing. InProceedings of the 12th IFIP TC 13 International Conference on Human-Computer Interaction: Part II (INTERACT ’09). Springer-Verlag, Berlin, Heidelberg, 236–249.
16. Fabio Pittarello and Riccardo Stecca. 2011. Mapping Physical Objects to Digital Functions: A Tangible Interface for Querying and Navigating a Multimedia
Database. InProceedings of the 2011 22nd International Workshop on Database and Expert Systems Applications (DEXA ’11). IEEE Computer Society, Washington, DC, USA, 134–138.
17. Chris Rooney and Roy A. Ruddle. 2008. A New Method for Interacting with Multi-window Application on Large, Hight Resolution Displays. InProceedings of the 6th Theory and Practice of Computer Graphics Conference (TPCG ’08). 75–82.
18. Bertrand Schneider, Megan Strait, Laurence Muller, Sarah Elfenbein, Orit Shaer, and Chia Shen. 2012. Phylo-Genie: Engaging Students in Collaborative ’Tree-thinking’ Through Tabletop Techniques. In
Proceedings of the SIGCHI Conference on Human Factors in Computing Systems (CHI ’12). ACM, New York, NY, USA, 3071–3080.
19. Orit Shaer and Eva Hornecker. 2010. Tangible User Interfaces: Past, Present, and Future Directions.Found. Trends Hum.-Comput. Interact.3, 1–2 (Jan. 2010), 1–137.
20. Orit Shaer, M. Strait, C. Valdes, H. Wang, T. Feng, M. Lintz, M. Ferreirae, C. Grote, K. Tempel, and S. Liu. 2012. The Design, Development, and Deployment of a Tabletop Interface for Collaborative Exploration of Genomic Data.Int. J. Hum.-Comput. Stud.70, 10 (Oct. 2012), 746–764.
21. Martin Spindler, Christian Tominski, Heidrun Schumann, and Raimund Dachselt. 2010. Tangible Views for Information Visualization. InACM International Conference on Interactive Tabletops and Surfaces (ITS ’10). ACM, New York, NY, USA, 157–166.
22. Faisal Taher, John Hardy, Abhijit Karnik, Christian Weichel, Yvonne Jansen, Kasper Hornbæk, and Jason Alexander. 2015. Exploring Interactions with Physically Dynamic Bar Charts. InProceedings of the 33rd Annual ACM Conference on Human Factors in Computing Systems (CHI ’15). ACM, New York, NY, USA, 3237–3246.
23. Lucia Terrenghi, David Kirk, Abigail Sellen, and Shahram Izadi. 2007. Affordances for Manipulation of Physical Versus Digital Media on Interactive Surfaces. In
Proceedings of the SIGCHI Conference on Human Factors in Computing Systems (CHI ’07). ACM, New York, NY, USA, 1157–1166.
![Table 1. The generic visualization tasks (see [3]), and the multi-touch and tangible interaction provided for each of our eQTL tasks.](https://thumb-us.123doks.com/thumbv2/123dok_us/7805719.171154/3.612.322.564.299.397/table-generic-visualization-tasks-multi-tangible-interaction-provided.webp)