THE INTERSECTION BETWEEN AEROBIC GLYCOLYSIS, CEREBELLAR NEUROGENESIS, AND MEDULLOBLASTOMA
Katherine Rose Tech
A dissertation submitted to the faculty at the University of North Carolina at Chapel Hill in partial fulfillment of the requirements for the degree of Doctor of Philosophy in the Department of Biomedical Engineering.
Chapel Hill 2016
Approved by:
Jeffrey M. Macdonald
Timothy R. Gershon
Mohanish Deshmukh
ABSTRACT
Katherine Rose Tech: The Intersection between Aerobic Glycolysis, Cerebellar Neurogenesis, and Medulloblastoma
(Under the direction of Jeffrey M. Macdonald and Timothy R. Gershon)
Aerobic glycolysis supports proliferation in development and cancer through unresolved mechanisms. Aerobic glycolysis, which supports the generation of biomass, is integral to cerebellar granule neuron progenitors (CGNPs) for normal growth and is hijacked in medulloblastoma.
Medulloblastoma, the most common malignant pediatric brain tumor, is approached as a disorder of normal brain development. Arising as a disruption of normal cerebellar growth, medulloblastoma exploits the cellular processes used for cerebellar development to promote tumor formation. Thus, genes that are involved in developmentally-regulated progenitor growth may contribute to tumorigenesis when aberrantly expressed. A better understanding of cerebellar development and thus the pathogenesis of
medulloblastoma, may lead to more targeted cancer treatments.
In response to the developmental mitogen Sonic Hedgehog (SHH), CGNPs increase aerobic glycolysis and up-regulate key glycolytic enzymes Hexokinase-2 (Hk2) and Pyruvate Kinase M2 (Pkm2). HK2, which catalyzes the first step in glycolysis, is required for aerobic glycolysis in brain progenitors and medulloblastomas. Hk2 deletion blocks aerobic glycolysis, disrupts proliferation, and restricts
ACKNOWLEDGEMENTS
The work I describe here was made possible by the support and generosity of many people. First, I would like to thank my two advisors, Jeffrey M. Macdonald and Timothy R. Gershon. Thank you, Jeff and Tim, for your guidance, for encouraging me to think critically, for supporting my professional development side quests, for helping me to write analytically, and for creating an environment that enabled me to achieve greater.
I would also like to thank my thesis committee members for their advice and support. Mohanish Deshmukh, Mark Tommerdahl, and Robert G. Dennis, each of you brought a different perspective to this project and provided much appreciated support.
Thank you to the funding sources that made this work possible, which include the National Institute of Neurological Disorders and Stroke (NINDS; R01NS088219), the National Institutes of Health (NIH; 1K08NS077978-01), the St. Baldrick’s Foundation, and the American Institute for Cancer Research. Thank you to the UNC CGBID Histology Core supported by P30 DK 034987, the UNC Tissue Pathology Laboratory Core supported by NCI CA016086 and UNC UCRF, UNC Neuroscience Center Confocal and Multiphoton Imaging Core, and the LCCC Animal Studies Core supported by the NCI Center Core Support Grant CA16086 to the UNC LCCC. These facilities provided expertise and technical assistance in immunohistochemistry, confocal imaging, and in drug studies. With the kindness and support of the core facility staff this work has been greatly accelerated.
To all of my nuclear and sister lab mates, both past and present, I am truly honored to have the opportunity to work with each and every one of you. I have learned so much from each of you in regards to both science and life. Thank you for being there to talk, providing advice and encouragement, and being there to shoot rapid-fire ideas around. With laughter and fun, you made the long lab meetings, long experiments, and setbacks seem like dust in the wind, or rather, meninges in HBSS.
Thank you to my wonderful friends, whom I cannot thank enough for their support, lending their ears, insightful advice, and knowing how to make a jokester laugh. You have been the light to my late nights and so much more. You gave me the strength when I had none, and for that, I cannot thank you enough.
I would like to thank my family for encouraging me to be my very best. Your endless support for me was all that I could ask for. I could not be person I am today without you and words cannot express my gratitude for everything that you have given me.
PREFACE
Chapter Four of this dissertation was previously published. Permission to include the following article was provided by Elsevier:
Tech K, Deshmukh M, Gershon TR. 2014. Adaptations of energy metabolism during cerebellar neurogenesis are co-opted in medulloblastoma. Cancer Lett 356: 268–272.
TABLE OF CONTENTS
LIST OF TABLES ... xii
LIST OF FIGURES ... xiii
LIST OF ABBREVIATIONS ... xiv
CHAPTER I: INTRODUCTION ... 1
1.1 Aerobic glycolysis ... 1
1.1.1 Overview ... 1
1.1.2 Supporting biosynthesis ... 1
1.1.3 Lactate ... 3
1.1.4 In cancer ... 4
1.2 Medulloblastoma and cerebellar development ... 7
1.2.1 Overview ... 7
1.2.2 SHH-driven medulloblastoma ... 8
1.3 Metabolomics ... 10
1.3.1 Overview ... 10
1.3.2 Nuclear magnetic resonance spectroscopy ... 11
1.3.3 Metabolic footprint and fingerprint ... 12
1.4 Figures and Legends ... 14
1.5 References ... 17
CHAPTER II: PYRUVATE KINASE INHIBITS PROLIFERATION DURING POSTNATAL CEREBELLAR NEUROGENESIS AND SUPPRESSES MEDULLOBLASTOMA FORMATION ... 23
2.1 Overview ... 23
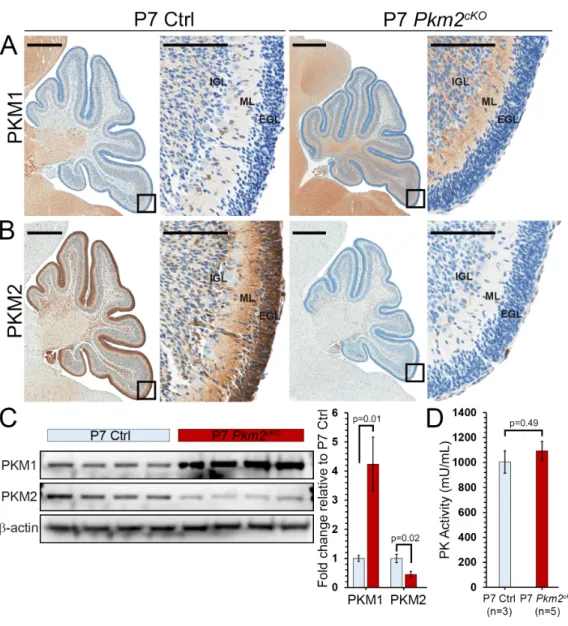
2.3.4 Pkm2 deletion is not replaced by Pkm1 in brain progenitors ... 28
2.3.5 Pkm2 deletion increases CGNP proliferation ... 29
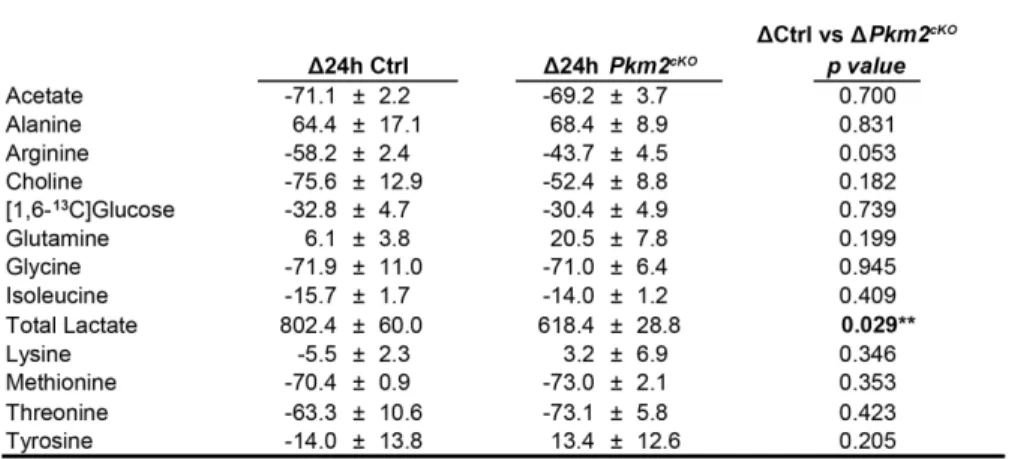
2.3.6 Pkm2 deletion inhibits the catabolism of glucose to lactate ... 30
2.3.7 Medulloblastoma tumorigenesis is exacerbated by loss of PKM2 ... 32
2.4 Discussion ... 34
2.5 Materials and Methods ... 37
2.6 Figures and Legends ... 44
2.7 Tables ... 57
2.8 Supplemental Figures and Legends ... 58
2.9 References ... 63
CHAPTER III: VISMODEGIB TREATMENT AND HK2 DELETION ACT IN CONCERT TO RESTRICT MEDULLOBLASTOMA GROWTH ... 68
3.1 Overview ... 68
3.2 Introduction ... 69
3.3 Results ... 71
3.3.1 Vismodegib reduces proliferation in cultured, Hk2-deleted SHH-driven medulloblastomas ... 71
3.3.2 Injectable vismodegib maintains anti-tumor effects in vivo ... 72
3.3.3 Hk2 deletion and IP vismodegib treatment restrict tumor growth ... 73
3.3.4 Oral vismodegib does not prevent toxicity or prolong survival in Hk2-deleted mice ... 73
3.4 Discussion ... 74
3.5 Materials and Methods ... 76
3.6 Figures and Legends ... 79
3.7 References ... 88
CHAPTER IV: ADAPTATIONS OF ENERGY METABOLISM DURING CEREBELLAR NEUROGENESIS ARE CO-OPTED IN MEDULLOBLASTOMA ... 91
4.1 Overview ... 91
4.2 Introduction ... 91
4.3 Metabolism and medulloblastoma ... 93
4.3.1 Lipid metabolism ... 93
4.3.3 Metabolic switches ... 97
4.4 Discussion ... 99
4.5 Figures and Legends ... 101
4.6 References ... 103
CHAPTER V: CONCLUSIONS ... 106
5.1 Overview ... 106
5.2 Future studies ... 107
5.3 References ... 109
LIST OF TABLES
LIST OF FIGURES
Figure 1.1 SHH signaling pathway ... 14
Figure 1.2 The basis of NMR ... 16
Figure 2.1 Mutually exclusive expression patterns of PKM1 and PKM2 correspond to differentiation state. ... 44
Figure 2.2 Growth factor signaling regulates PKM expression and activity. ... 46
Figure 2.3 Conditional Pkm2 deletion blocks all Pkm expression in CGNPs. ... 48
Figure 2.4 Pkm2 deletion increases CGNP proliferation. ... 49
Figure 2.5 Pkm2 deletion reduces the conversion of glucose to lactate. ... 51
Figure 2.6 Pkm2-deleted CGNPs show altered glutamate progression through the Krebs cycle but comparable PPP flux. ... 53
Figure 2.7 Pkm2 deletion accelerates medulloblastoma tumorigenesis ... 55
Figure 2.S1 Germline deletion of Pkm2. ... 58
Figure 2.S2 Scrambling of 13C glucose label in the Krebs cycle. ... 60
Figure 2.S3 Entrapped PKM1+ cells in Pkm2-deleted tumors are not proliferating. ... 62
Figure 3.1 Multiple ways Sleeping Beauty mutagenesis can occur ... 79
Figure 3.2 Vismodegib decreases proliferation in cultured Hk2-deleted medulloblastoma cells ... 81
Figure 3.3 Vismodegib increased differentiation and decreased proliferation in vivo ... 82
Figure 3.4 Vismodegib has anti-tumor effects in Hk2-intact and -deleted mice ... 84
Figure 3.5 Oral vismodegib does not prolong survival in Hk2-deleted animals ... 86
Figure 4.1 Shh signaling regulates lipid metabolism and glycolysis in an integrated manner. ... 101
LIST OF ABBREVIATIONS
Acc1 Acetyl-CoA carboxylase 1 Acox1 Acyl-CoA oxidase
ADP Adenosine diphosphate AMP Adenosine monophosphate
AMPK Adenosine monophosphate-activated kinase ATP Adenosine triphosphate
cC3 Cleaved caspase-3 CCND2 Cyclin D2
CDK Cyclin-dependent kinases CGNs Cerebellar granule neurons
CGNPs Cerebellar granule neuron progenitors CNS Central nervous system
CoA Coenzyme A
DNA Deoxyribonucleic acid
E Embryonic day
E2F1 E2F Transcription Factor 1 E4P Erythrose 4-phosphate EdU 5’-ethynyl-2’-deoxyuridine EGL External granule layer F6P Fructose 6-phosphate FASN Fatty acid synthase FBP Fructose-1,6-bisphosphate FDG Fluorodeoxyglucose FE Fractional enrichment
FPKM Fragments per kilobase of transcript per million mapped reads GAP Glyceraldehyde 3-phosphate
HCC Hepatocellular carcinoma
hGFAP Human glial fibrillary acidic protein
HK2 Hexokinase-2
1H NMR Proton nuclear magnetic resonance
iEGL Inner external granule layer IGFR Insulin growth factor receptor IGL Internal granule layer
IHC Immunohistochemistry IP Intraperitoneal injection
LC-MS Liquid chromatography-mass spectrometry LDH Lactate dehydrogenase
MCAD Medium chain acyl-CoA dehydrogenase MCT 0.5% Methylcellulose in 0.2% Tween-80 MEF Mouse embryonic fibroblast
MRI Magnetic resonance imaging mRNA Messenger ribonucleic acid ND2 Neuronal differentiation 2 NeuroD2 Neuronal differentiation 2 NMP N-methyl-2-pyrrolidone
Non-OxPPP Non-oxidative phase of pentose phosphate pathway oEGL Outer external granule layer
OxPPP Oxidative phase of pentose phosphate pathway
P Postnatal day
PEG Polyethylene glycol PEP Phosphoenolpyruvate
PET Positron emission tomography PGAM1 Phosphoglycerate mutase 1 PI3K Phosphoinositide 3-kinase
Pklr Pyruvate kinase, liver and red blood cell Pkm Pyruvate kinase, muscle
PKM1 Pyruvate kinase isoform M1 PKM2 Pyruvate kinase isoform M2
Pkm2cKO Pyruvate kinase isoform M2 conditional deletion PPARγ Peroxisome proliferator-activated receptor-γ PPP Pentose phosphate pathway
Ptc Patched 1
R5P Ribose 5-phosphate
Rb Retinoblastoma
RBC Red blood cell
RMS Rostral migratory stream RNA Ribonucleic acid
RNA-seq Ribonucleic acid sequencing Ru5P Ribulose 5-phosphate S7P Sedoheptulose 7-phosphate
SB Sleeping beauty
SHH Sonic hedgehog
shRNA Short hairpin ribonucleic acid
Smo Smoothened
SVZ Subventricular zone Vismo Vismodegib
CHAPTER I: INTRODUCTION
1.1 Aerobic glycolysis
1.1.1 Overview
Glucose is a major source of cellular energy and carbons for biosynthetic reactions. Cells may
metabolize glucose through glycolysis to produce pyruvate. Under high cellular energy demands,
pyruvate is oxidized into CO2 in the Krebs cycle to produce 38 ATP per glucose molecule through coupled
oxidative phosphorylation. Pyruvate can have other metabolic fates such as its conversion into ethanol,
acetate, alanine, and lactate. Aerobic glycolysis is the conversion of glucose to lactate and 2 ATP even in
the presence of sufficient oxygen needed for oxidative phosphorylation. Likewise, cells with large ATP
requirements are less likely to use aerobic glycolysis over energy-efficient oxidative phosphorylation for
ATP production. In addition to low energy production, glucose catabolism through aerobic glycolysis
generates metabolic intermediates that can be used for lipid, amino acid, and nuclei acid biosynthesis.
Thus, proliferating cells exhibiting increased aerobic glycolysis must use this metabolic phenotype to
meet competing cellular demands for energy production and biosynthesis. Increased aerobic glycolysis is
a metabolic phenotype found in both unicellular and multicellular organisms used to support normal and
aberrant proliferation1.
1.1.2 Supporting biosynthesis
Glycolysis is inefficient at ATP production compared to oxidative phosphorylation. Aerobic
glycolysis, however, can produce more ATP than oxidative phosphorylation by generating ATP at a faster
rate2. However, it is unlikely that rapidly dividing cells are opting for the faster but less efficient route for
primary ATP production when glycolysis-derived ATP only makes up on average 17% of the total ATP
glycolysis4. Specifically, phosphofructokinase is sensitive to the ATP:AMP ratio, controlling the
downstream flow of glycolytic intermediates5. To maintain low ATP:AMP ratio, proliferating cells can also
increase ATP consumption to promote the catabolism of glucose to lactate, increasing glycolytic flux6. In
all, aerobic glycolysis serves a more important function beyond energy metabolism in proliferating cells.
The major function of increased aerobic glycolysis is to support biosynthesis. Rapidly dividing
cells use anabolic reactions to generate nucleotides, amino acids, and lipids required for cell division.
Glucose catabolism can generate the precursors needed for these synthesis reactions, and increased
aerobic glycolysis is likely used to maintain the glycolytic intermediate pool needed for biosynthesis1,7. For
example, in de novo nucleotide synthesis carbon atoms are needed from the extracellular environment.
Once phosphorylated, glucose can supply carbons to nucleotide synthesis as the ribose ring in two ways.
The direct way is through the oxidative phase of the pentose phosphate pathway where glucose
6-phosphate (G6P) becomes ribose 5-6-phosphate (R5P)8. The indirect route is through glycolytic
intermediates fructose 6-phosphate (F6P) and glyceraldehyde-3-phosphate (GAP) feeding into the
non-oxidative pentose phosphate pathway to generate the ribose ring9,10. R5P is then converted to
5-phosphoribosyl-α-pyrophosphate (PRPP), the last common intermediate in the de novo synthesis
pathways for pyrimidine and purine nucleotides11. The generation of PRPP is catalyzed by PRPP
synthetase, which exhibits increased activity in response to mitogen stimulation12. Moreover, PRPP is
specifically important for purine nucleotides as its synthesis is the rate-limiting step in the production of
purine precursors11. Thus, PRPP production is important for nucleotide synthesis during cell growth. In
addition to the ribose ring, glucose metabolism through glycolysis can source up to an additional 3 and 4
carbons to the synthesis of the pyrimidine and purine bases1. The purine base, adenine, furthers the
reach of glucose-derived carbons as adenine is an essential component of cofactor biosynthesis1,5.
In addition to nucleotide synthesis, glucose catabolism through glycolysis also supplies carbons
precursor for other major phospholipid head groups ethanolamine and choline, further emphasizing the
importance of glucose-derived carbons5. Downstream of glycolysis, glucose-derived pyruvate can enter
the Krebs cycle to generate oxaloacetate and α-ketoglutarate. These intermediates are, in turn, used to
make asparagine, aspartate, glutamate, glutamine, proline and arginine1,5. Thus, aerobic glycolysis can
supply the carbons required for amino acid synthesis during proliferation.
As for lipid synthesis, the glycolytic intermediate dihydroxyacetone phosphate is the precursor to
glycerol 3-phosphate and lipids such as cardiolipin. Glycerol 3-phosphate is critical for the generation of
phospholipids and triglycerides, which are major structural lipids in cell membranes, while cardiolipin is a
component of mitochondrial membranes5. Another glycolytic intermediate, 3-phosphoglycerate, is the
precursor to sphingolipids, which are important membrane components and mediate cell signaling13.
Glucose metabolism through glycolysis also indirectly supplies carbons for acetyl-CoA, an important
component of lipid synthesis. After the conversion of glucose to pyruvate, pyruvate is decarboxylated and
becomes acetyl-CoA in the mitochondria. As acetyl-CoA cannot cross the mitochondrial membrane,
acetyl-CoA must enter the Krebs cycle and be exported as citrate. ATP-citrate lyase then converts citrate
to acetyl-CoA in the cytosol. The recovered cytosolic acetyl-CoA provides the carbons for fatty acid
chains and for mevalonate, a precursor to cholesterol. In all, the ability to produce cytosolic acetyl-CoA14
and synthesize fatty acids from extracellular nutrients15,16 is critical to proliferation.
Nucleotide, amino acid, and lipid synthesis all rely on glycolysis to source glucose carbons for
their respective reactions. The increased aerobic glycolysis of proliferating cells is used to maintain pools
of precursors needed for biosynthesis. Thus, the function of aerobic glycolysis extends beyond energy
metabolism as a metabolic phenotype that supports rapid growth.
1.1.3 Lactate
Excess lactate is not a driver but a by-product of increased aerobic glycolysis. As described
previously, high glycolytic flux maintains precursor pools for biosynthetic reactions. Biosynthesis, a
was a slight decrease in the latter17. High glycolytic flux produces pyruvate, and as a way to remove
excess from the cell, pyruvate is converted to alanine and lactate18 given that its entry into the Krebs
cycle is rate limited by slower pyruvate dehydrogenase activity1,19. Lactate generation efficiently produces
NAD+20, balancing the NAD+/NADH ratio and supplying the NAD+ used in upstream glycolytic
reactions1,5. NAD+ is also used during nucleotide and amino acid synthesis, suggesting that lactate
generation facilitates high glycolytic flux and faster utilization of glucose-derived carbons by anabolic
reactions. Nonetheless, the production of excess lactate is a wasteful and inefficient use of
glucose-derived carbons. However, proliferating cells are willing to accept the cost of lactate production over
efficient carbon utilization because of the biosynthetic growth advantage provided by aerobic glycolysis.
1.1.4 In cancer
In 1924, Otto Warburg first reported in that cancer cells consume more glucose and produce
more lactate than their normal counterparts in oxygen-rich environments21. This metabolic phenotype of
increased aerobic glycolysis in cancer cells became to be known as the “Warburg effect”. Initially,
Warburg thought that a defect in mitochondrial respiration caused cancer cells to increase glycolytic flux.
However, most cancer cells do not have impaired mitochondrial respiration3,22 and enhanced aerobic
glycolysis actually supports rapid, aberrant growth. After Warburg’s discovery, a major focus in cancer
research now is the study of metabolic reprogramming and its unanswered questions. What is the impact
of altered metabolism and increased aerobic glycolysis? What are the exact reactions that mediate this
phenotype? What are the cellular mechanisms upstream of this phenotype? Can we target metabolism as
an anticancer therapy? Briefly described below are few of the ways that cancer reprograms its cellular
metabolism to increase aerobic glycolysis and support growth.
To support aberrant growth, cancer cells hijack and reprogram signaling pathways, increasing
In addition to appropriating signaling pathways, altering metabolic enzymes is another
mechanism used during tumorigenesis to tailor metabolism for growth. One prominent example is
Pyruvate kinase M (Pkm), which catalyzes the conversion of phosphoenolpyruvate (PEP) to pyruvate in
glycolysis. Pkm is preferentially expressed in cancer cells and normal proliferating cells as the PKM2
isoform. The alternative to PKM2 is the PKM1 isoform, which is typically found in differentiated tissues
requiring constitutively high pyruvate kinase activity27. PKM2, with its intrinsically low pyruvate kinase
activity, is expressed ubiquitously in cancer, suggesting that this isoform may mediate a growth
advantage. At the level of PEP, cancer cells can redirect glycolytic intermediates upstream of PEP by
expressing PKM2. Thus, during increased aerobic glycolysis, glucose is metabolized quickly and not
immediately turned into lactate as PKM2 expression lowers pyruvate production and replenishes
glycolytic intermediate pools for biosynthesis. A seminal study by Israelsen et al demonstrated that low
pyruvate kinase activity provides a growth advantage as their Pkm2-deleted breast cancers exhibited
accelerated tumorigenesis28. In the case of nutrient stress during rapid growth, cancer cells can activate
PKM2 through intracellular signaling pathways29 or allosterically30. Increasing pyruvate kinase activity
would shift the metabolic program from anabolic reactions and growth to efficient ATP production31,32.
Thus, PKM2 is a tool cancers can use to direct glycolytic intermediates in response to changes in
precursor pools and nutrient availability.
In contrast to the well-known PKM2 isoform paradigm, is the lesser-known
phosphofructokinase/fructose-2,6-bisphosphatase B3 gene (PFKFB3). While PFKFB3 is not a canonical
glycolytic enzyme, its catalytic activity increases the rate of glycolysis resulting in its high expression in
human tumors33. PFKFB3 has six splice variants that are preferentially expressed in specific cancerous
and normal tissues to support growth23. Besides expressing specific isoforms, cancer cells can also
mutate metabolic enzymes such as succinate dehydrogenase34, fumarate hydratase35, and isocitrate
dehydrogenase36,37. Mutations in these enzymes facilitate a metabolic phenotype that is conducive
towards growth in diverse cancers23,38. In all, metabolic reprogramming is a signature of cancer cells used
Since Warburg’s first report of increased aerobic glycolysis in cancer cells, cancer diagnoses and
treatment strategies have been developed around the Warburg effect. The most commonly known
diagnostic method is fluorodeoxyglucose-position emission tomography (FDG-PET) imaging. FDG is a
glucose analogue that cannot be metabolized and competes with glucose for transport across the cell
membrane. FDG-PET is based on the assumption that malignant tissues have a higher rate of glucose
uptake than normal tissues, such that tumors are identified by FDG accumulation when visualized by PET
imaging. However, FDG uptake is influenced by confounding factors such as endogenous glucose pools,
tissue heterogeneity, tissue volume, and non-glycolytic catabolism of glucose, which limit the usefulness
of the FDG-PET technique3,39.
As for cancer treatments, inhibition of glycolysis alone is not potent enough to induce significant
anti-cancer effects40,41. The lack of potency in targeting glycolysis alone most likely arises from tumor
heterogeneity and metabolic plasticity such that malignant cells can use alternative metabolic pathways to
sustain rapid growth. Targeted therapies against glycolysis are being tested to determine if they
potentiate the cytotoxic effects of other therapies40,41 or should be multiplexed with additional
metabolically-based therapies. For example, 2-deoxyglucose (2DG), the unlabeled form of FDG, may be
used in combination with radiation therapy in the treatment of glioblastoma multiforme (GBM)42. However,
further clinical studies are required to determine efficacy of this combination therapy. Another strategy in
the treatment of GBM could be 2DG and metformin combination therapy. Metformin, an inhibitor of
oxidative phosphorylation, in combination with 2DG decreased the invasiveness of tumorspheres and
significantly prolonged survival in a GBM xenograft model43. Furthermore, direct and selective therapies
against aerobic glycolysis can be limited by the lack of small molecule inhibitors. Hexokinase-2 (HK2)
catalyzes the first irreversible step in glycolysis and is considered to be a potent target for cancer
treatment. However, for the past 50 years, the intrinsic properties of the HK2 enzyme have delayed the
development of selective HK2 small molecule inhibitors and their application in the clinic. Only recently
1.2 Medulloblastoma and cerebellar development
1.2.1 Overview
Medulloblastoma is the most common malignant pediatric brain tumor. Current therapies for
medulloblastoma rely on the sensitivity of the tumor to DNA damage. Craniospinal radiation therapy,
which was first implemented in the 1950s, transformed medulloblastoma from a 100% fatal disease into a
treatable cancer with 60% long-term survival45–47. Since then, the coupling of optimized radiation
regimens with chemotherapeutics has improved patient outcomes to 80% long-term survival48–51. The
success of these therapies, however, is dampened by their debilitating side effects. Survivors must live
with significant long-term injuries, such as growth impairment, early strokes, cognitive deficits, and
endocrine failure, while acutely aware of the risk of recurrence46,52,53. Importantly, 20-30% of
medulloblastoma patients ultimately die from the disease. Thus, the identification of new therapeutic
targets in addition to DNA damage-based chemotherapies is necessary. By improving our understanding
of medulloblastoma tumorigenesis, we may discover novel pathways to target in the clinic, which may
also bring reduced toxicity and improved patient outcomes.
Defined by molecular analyses, there are four distinct subgroups of medulloblastoma: wingless
(WNT), sonic hedgehog (SHH), Group 3, and Group 454–56. Approximately 35% of all medulloblastomas
are Group 4 tumors, followed by SHH (30%), Group 3 (25%), and (10%) WNT tumors56. Among infants
and adults, however, the SHH subgroup is the most common medulloblastoma, representing more than
50% of patient cases, with significant decreased frequency in children54. In contrast, the WNT (1%) and
Group 4 (11%) subgroups rarely arise in infants while Group 3 (6%) is less common in adults54. Each
medulloblastoma subgroup presents as a distinct disease with different patient demographics,
transcriptomics, and genomics54–58. Of the four subgroups, SHH-driven medulloblastoma is the best
characterized as animals models that recapitulate the disease59 have enabled and progressed basic,
In research, medulloblastoma has been increasingly approached as a disorder of brain
development. During the first year of life in humans, or the first 15 days of life in mice, neural progenitors
rapidly divide. Cerebellar granule neuron progenitors (CGNPs) proliferate in the external granule cell layer
(EGL), located along the outside of the cerebellum. In mice, peak CGNP proliferation and expansion
occurs between postnatal day (P) 5 and 860. Then, CGNPs switch to the postmitotic, premigratory state in
the inner EGL (iEGL)61 before differentiating and migrating to the internal granule cell layer (IGL) where
they reside as cerebellar granule neurons (CGNs)60,62,63. By P20, CGNP migration and differentiation is
complete. CGNPs represent the largest population of neurons in the brain and the cell of origin for
SHH-driven medulloblastoma. SHH-medulloblastoma specifically arises in the cerebellum from CGNPs that
aberrantly proliferate, lacking normal growth control62,64,65. Thus, developmentally-regulated genes
involved in normal cerebellar growth may contribute to tumorigenesis when they fail to turn off during
differentiation.
1.2.2 SHH-driven medulloblastoma
SHH-driven medulloblastoma is characterized by activation of the SHH signaling pathway. This
developmental pathway regulates postnatal CGNP proliferation at physiological levels but mutations that
activate the SHH pathway can prolong proliferation and lead to SHH-driven medulloblastoma61,63,66.
During normal cerebellar development, Purkinje cells secrete the SHH mitogen which diffuses to the EGL
where CGNPs proliferate61 (Fig. 1.1A). In CGNPs, SHH binds to the transmembrane protein Patched 1
(PTC), inducing a conformational change that releases the transmembrane protein Smoothened (SMO)
from inhibition (Fig. 1.1B). Activated SMO then initiates an intracellular signal transduction pathway that
activates the GLI transcription factor family and other target genes such as cyclinD1 and D267,68 (Fig.
1.1B). SHH signaling drives CGNP expansion and wanes as progenitors differentiate and migrate to the
These activating mutations in patients have led to the development of animal models that
recapitulate the disease. These models are critical for elucidating medulloblastoma tumorigenesis and
have allowed for unprecedented, preclinical in vivo studies that test for targeted therapies against
SHH-driven medulloblastoma. Multiple models of SHH-SHH-driven medulloblastoma have been made; activating the
developmental pathway through manipulation of different pathway effectors. One of the first models was
the Ptc1-knockout mouse in which viable heterozygotes (Ptc+/-) developed tumors at a 15% incidence73.
This model has been significantly improved as a research tool after crossing with Tp53-/- mice, as tumor
incidence increased to 100% with loss of p5374.
Of the tumor models that alter the SHH pathway downstream of Ptc, the ND2:SmoA1 model is
the most widely used75. In these tumor-prone transgenic mice, the SHH subgroup is recapitulated in
pathology and transcriptionally by the constitutive expression of the activated Smoothened transgene,
SmoA1. The activating point mutation in SmoA1 is the single amino acid substitution W539L, derived
from a sporadic basal cell carcinoma patient exhibiting SHH pathway activation59,76,77. The mutation, a
conversion of Trp to Leu at residue 539, alters the binding pocket where PTC adheres to permit
SmoA1-mediated activation. Thus, the SHH pathway is activated and primarily in CGNPs as controlled by the
NeuroD2 promoter, ND259,78. In mice hemizygous for ND2:SmoA1, tumor incidence is about 50% over 6
months59 while the homozygous Smo/Smo model has >90% incidence over 2 months78. Similar to these
models is the Cre-driven SmoM2 model, which expresses the constitutively active SMO-W539L mutant
when activated by Cre recombinase79. In Math1-Cre;SmoM2 mice, mutant SMO activates the SHH
pathway in Math1 lineage CGNPs to induce medulloblastoma with 100% incidence and with an average
survival of 41 days64. As for hGFAP-Cre driven SmoM2 tumors, the developmental pathway is activated
in the stem cells that give rise to the neurons and glia of the cerebrum and cerebellum, excluding Purkinje
cells80. These animals have 100% medulloblastoma formation with an average survival of 33 days64.
Together, these models provide a way to study how SHH-regulated genes impact both cerebellar
development and medulloblastoma tumorigenesis, resulting in new targets for clinical treatments and
Using animal models, previous work has shown that the SHH pathway induces aerobic glycolysis
during CGNP proliferation and medulloblastoma formation81,82. To increase aerobic glycolysis, SHH
up-regulates the expression of key glycolytic enzymes, HK2 and PKM2, which catalyze virtually irreversible
reactions at opposing ends of glycolysis81,82. Required for proper CGNP proliferation and tumor growth,
as previously shown in SHH-driven medulloblastoma and glioblastoma multiforme, HK2 is a potential
target to inhibit in metabolism-based clinical interventions82–84. The role of PKM2 in neural progenitors and
tumorigenesis, however, needs to be elucidated in order to assess its potential as a therapeutic target.
Identifying PKM2 as a target is particularly important as the dual targeting of direct SHH pathway
effectors and an interacting non-SHH pathway (such as aerobic glycolysis) is a clinical strategy in the
treatment of SHH-driven medulloblastoma. In all, studies with these models have led to the development
of targeted therapies for the SHH subgroup56 and continued work will provide the insight needed to treat
the primary and recurrent tumor in new ways.
1.3 Metabolomics
1.3.1 Overview
Metabolites are low molecular weight compounds (<2 kDa), not encoded by the genome, and are
produced and altered by cells under a specific state85–87. The metabolome refers to all metabolites
present in and produced by an organism86,88. Analytical techniques that can detect changes in
metabolites are critical to the study of metabolism and its role in cancer. While routinely used in other
disciplines such as analytical chemistry and biochemistry, methods based on mass spectrometry (MS)
and nuclear magnetic resonance (NMR) are just starting to be used by the cancer research community to
study metabolism89. The resurgent interest in metabolomics and cancer stems from its inherent
measurement of cell function and phenotype23,86,87,89. In contrast to the transcriptome and proteome,
1.3.2 Nuclear magnetic resonance spectroscopy
NMR is a nondestructive, unbiased method to analyzing metabolites. Independently developed by
Felix Bloch92 and Edward Mills Purcell93 in the 1940s, NMR is a technique use to determine physical,
chemical, and electronic properties of molecules. NMR, the foundation for magnetic resonance imaging
(MRI), uses the magnetic properties of atomic nuclei, such that any nucleus possessing a magnetic
moment can be studied. After applying a strong, external magnetic field, nuclei are observed by the
absorption and emission of electromagnetic radiation at a wavelength that corresponds to
radiofrequencies, or megahertz (MHz) (Fig. 1.2). Zeeman levels, the induced energy differences between
nuclear spin states, is relatively small in NMR compared to other techniques and reduces sensitivity94.
Since the 1940s, NMR sensitivity has improved greatly by the use of higher magnetic fields and with the
advent of Fourier transform NMR95 and noise decoupling96. Together, these innovations have made 1H
and 13C NMR robust analytical techniques.
1H NMR is a analytical technique used to study biologically important metabolites in normal and
malignant cells and tissues, including alanine in ovarian cancer97 and lactate in CGNPs and
medulloblastoma82. The proton nucleus (1H) is the most sensitive nucleus for NMR besides the hydrogen
isotope tritium, which has a low natural abundance and is radioactive. 1H has a high natural abundance
(>99%) and intrinsically high sensitivity for NMR as indicated by its high gyromagnetic ratio. The
gyromagnetic ratio is the ratio of the magnetic moment to the angular moment of a particle, a constant for
a given nuclei94. However, the application of 1H NMR can be challenging, as the precise resonance
frequency range (i.e., the chemical shift range) is only 8 ppm for nonexchangeable protons. The short
chemical shift range limits the separation and quantification of many overlapping metabolites94. Thus,
spectral processing methods such as line broadening correction, phase/frequency adjustment, baseline
correction, and water signal removal, are required to distinguish and measure metabolites in 1H NMR
spectra.
13C NMR analysis complements 1H NMR analysis as almost all metabolites contain carbon. In
has a 1.1% natural abundance and low gyromagnetic ratio, resulting in relatively low sensitivity for
detection by NMR. To overcome low sensitivity, dynamic nuclear polarization (DNP) is used to increase
13C NMR sensitivity by 5-fold. The concept behind DNP is to increase the polarization of nuclear spins in
order to overcome the low gyromagnetic ratio. DNP is achieved in an amorphous solid state at ~1 K by
coupling the nuclear spins with unpaired electrons through an organic-free radical94. As another way to
achieve spectral sensitivity, metabolites of interest can be fractionally enriched using 13C precursors. If
there is enough signal, 13C NMR can provide positional information with better resolution compared to 1H
NMR, as a simpler system with inherently fewer coupling partners85. Moreover, 13C-labeled metabolites
are detectable by 1H NMR as 1H-13C coupling gives rise to distinct satellite peaks around the main 1H
peak on the spectra. Notably, 13C is a naturally abundant tracer that can be studied and does not interfere
with the intact metabolism of a system. Thus, 13C-labeled precursors can be used in 1H and 13C NMR
analyses to study metabolic flux, i.e. the mass balance of a system85.
1.3.3 Metabolic footprint and fingerprint
The metabolic footprint and fingerprint of a given system are the profiles of metabolites outside
and inside of the analyzed system86. In metabolic footprinting, the less technically-demanding process
begins with tissue or cell culture in complete medium. After reaching equilibrium with cells, media are
sampled and analyzed, a design that permits high-throughput studies. Media analysis is used to
determine the change in metabolites consumed from and secreted into the media. The consequent
metabolite profile of the media represents the effect of a specific, cellular metabolic program on the
extracellular environment. For example, lactate and alanine secretion into the media are indicators of
increased, intracellular glutamine metabolism in transformed cells18. For metabolic fingerprinting, the
transformed cell extracts would be analyzed to detect changes in a wide range of metabolites at a given
concentration, it could mean that elevated glycolysis is replenishing intermediate pools of the Krebs cycle.
Another interpretation is that decreased activity in the later reactions of the Krebs cycle is causing a
backflux of intermediates such as citrate. Moreover, the increased citrate could be sourced from
increased glutamine consumption in response to drug treatment. To improve clarity in metabolic
fingerprinting studies, 13C tracers should be used. 13C precursor studies provide the added benefit of
studying metabolic flux while determining metabolite concentration. Thus, in this described example,
labeled glutamine or glucose would elucidate the carbon source for the increased citrate and show which
1.4 Figures and Legends
Figure 1.1 SHH signaling pathway
During postnatal cerebellar development, (A) CGNPs located in the EGL proliferate in response
to SHH secreted by Purkinje cells. Postmitotic, premigratory CGNPs reside in the inner EGL before
migrating to the IGL. In active SHH signaling, (B) the mitogen SHH binds with PTC, releasing SMO from
inhibition. Active SMO initiates intracellular signal transduction to activate the GLI family of transcription
factors to express target genes and support growth. SUFU is degraded and GLI can initiate transcription.
EGL, external granule layer; PCL, purkinje cell layer, IGL, internal granule layer; ECM, extracellular
Figure 1.2 The basis of NMR
Spin-1/2 nuclei include 1H and 13C nuclei. As in (A), nuclei are electrically charged and have an
intrinsic spin that causes them to act like a magnet. Once an external magnetic field (Bo) is applied, nuclei
spin at two energy states, β and α. In the (B) higher energy state β, the nucleus spins to generate a
magnetic field in the opposite direction to the applied field. In the (C) lower energy state α, the nucleus
spins to generate a magnetic field that aligns with the applied field. NMR spectroscopy is the
measurement of the energy difference that reads as radiofrequencies.
1.5 REFERENCES
1 Lunt SY, Vander Heiden MG. Aerobic Glycolysis: Meeting the Metabolic Requirements of Cell Proliferation. Annu Rev Cell Dev Biol 2011; 27: 441–464.
2 Pfeiffer T, Schuster S, Bonhoeffer S. Cooperation and competition in the evolution of ATP-producing pathways. Science 2001; 292: 504–507.
3 Zu XL, Guppy M. Cancer metabolism: Facts, fantasy, and fiction. Biochem Biophys Res Commun 2004; 313: 459–465.
4 Racker E. Why do tumor cells have a high aerobic glycolysis? J Cell Physiol 1976; 89: 697–700.
5 Lehninger AL. Lehninger Principles of Biochemistry. 4th ed. W.H. Freeman: New York, USA, 2005.
6 Fang M, Shen Z, Huang S, Zhao L, Chen S, Mak TW et al. The ER UDPase ENTPD5 promotes protein N-glycosylation, the Warburg effect, and proliferation in the PTEN pathway. Cell 2010; 143: 711–724.
7 Hume A, Weidemann MJ. Role and regulation of glucose metabolism in proliferating cells. Natl Cancer Inst 1956; 62: 3–8.
8 Katz J, Rognstad R. Labeling of Pentose Phosphate from Glucose-14C and Estimation of Rates of Transaldolase Transketolase Contribution of Pentose Cycle and Ribose Phosphate Synthesis. Biochemistry 1967; 6: 2227–2246.
9 Lee W-NP, Boros LG, Puigjaner J, Bassilian S, Lim S, Cascante M. Mass isotopomer study of the nonoxidative pathways of the pentose cycle with [1,2-13C2]glucose. Am J Physiol 1998; 274: 843– 851.
10 Boros LG, Lee PWN, Brandes JL, Cascante M, Muscarella P, Schirmer WJ et al. Nonoxidative pentose phosphate pathways and their direct role in ribose synthesis in tumors: Is cancer a disease of cellular glucose metabolism? Med Hypotheses 1998; 50: 55–59.
11 Green CD, Martin DW. A direct, stimulating effect of cyclic GMP on purified phosphoribosyl pyrophosphate synthetase and its antagonism by cyclic AMP. Cell 1974; 2: 241–245.
12 Chambers DA, Martin DW, Weinstein Y. The effect of cyclic nucleotides on purine biosynthesis and the induction of PRPP synthetase during lymphocyte activation. Cell 1974; 3: 375–380.
13 Hannun YA, Obeid LM. Principles of bioactive lipid signalling: lessons from sphingolipids. Nat Rev Mol Cell Biol 2008; 9: 139–150.
14 Hatzivassiliou G, Zhao F, Bauer DE, Andreadis C, Shaw AN, Dhanak D et al. ATP citrate lyase inhibition can suppress tumor cell growth. Cancer Cell 2005; 8: 311–321.
15 Menendez JA, Lupu R. Fatty acid synthase and the lipogenic phenotype in cancer pathogenesis. Nat Rev Cancer 2007; 7: 763–777.
16 Abramson HN. The lipogenesis pathway as a cancer target. J Med Chem 2011; 54: 5615–5638.
18 DeBerardinis RJ, Mancuso A, Daikhin E, Nissim I, Yudkoff M, Wehrli S et al. Beyond aerobic glycolysis: transformed cells can engage in glutamine metabolism that exceeds the requirement for protein and nucleotide synthesis. Pnas 2007; 104: 19345–19350.
19 Curi R, Newsholme P, Newsholme EA. Metabolism of pyruvate by isolated rat mesenteric lymphocytes, lymphocyte mitochondria and isolated mouse macrophages. Biochem J 1988; 250: 383–388.
20 Wuntch T, Chen RF, Vesell ES. Lactate Dehydrogenase Isozymes : Kinetic Properties at High Enzyme Concentrations. Science 2013; 167: 63–65.
21 Warburg O. On the Origin of Cancer Cells. Science 1956; 123: 309–314.
22 Moreno-Sánchez R, Rodríguez-Enríquez S, Marín-Hernández A, Saavedra E. Energy metabolism in tumor cells. FEBS J 2007; 274: 1393–1418.
23 Ward PS, Thompson CB. Metabolic Reprogramming: A Cancer Hallmark Even Warburg Did Not Anticipate. Cancer Cell 2012; 21: 297–308.
24 DeBerardinis RJ, Lum JJ, Hatzivassiliou G, Thompson CB. The Biology of Cancer: Metabolic Reprogramming Fuels Cell Growth and Proliferation. Cell Metab 2008; 7: 11–20.
25 Zhang G, Yang P, Guo P, Miele L, Sarkar FH, Wang Z et al. Unraveling the mystery of cancer metabolism in the genesis of tumor-initiating cells and development of cancer. Biochim Biophys Acta 2013; 1836: 49–59.
26 Hanahan D, Weinberg RA. Hallmarks of cancer: The next generation. Cell 2011; 144: 646–674.
27 Mazurek S. Pyruvate kinase type M2 : A key regulator of the metabolic budget system in tumor cells. Int J Biochem Cell Biol 2011; 43: 969–980.
28 Israelsen WJ, Dayton TL, Davidson SM, Fiske BP, Hosios AM, Bellinger G et al. PKM2 isoform-specific deletion reveals a differential requirement for pyruvate kinase in tumor cells. Cell 2013; 155: 397–409.
29 Iqbal MA, Siddiqui FA, Gupta V, Chattopadhyay S, Gopinath P, Kumar B et al. Insulin enhances metabolic capacities of cancer cells by dual regulation of glycolytic enzyme pyruvate kinase M2. Mol Cancer 2013; 12: 72–83.
30 Ikeda Y, Noguchi T. Allosteric regulation of pyruvate kinase M2 isozyme involves a cysteine residue in the intersubunit contact. J Biol Chem 1998; 273: 12227–12233.
31 Israelsen WJ, Vander Heiden MG. Pyruvate kinase: Function, regulation and role in cancer. Semin Cell Dev Biol 2015; 43: 43–51.
32 Anastasiou D, Yu Y, Israelsen WJ, Jiang J-K, Boxer MB, Hong BS et al. Pyruvate kinase M2 activators promote tetramer formation and suppress tumorigenesis. Nat Chem Biol 2012; 8: 839– 847.
35 Tomlinson IPM, Alam NA, Rowan AJ, Barclay E, Jaeger EEM, Kelsell D et al. Germline mutations in FH predispose to dominantly inherited uterine fibroids, skin leiomyomata and papillary renal cell cancer. Nat Genet 2002; 30: 406–410.
36 Parsons DW, Jones S, Zhang X, Lin JC, Leary RJ, Angenendt P et al. An Integrated Genomic Analysis of HUman Glioblastoma Multiforme. Science 2008; 321: 1807–1812.
37 Sjoblom T, Jones S an, Wood LD, Parsons DW, Lin J, Barber TD et al. The consensus coding sequences of human breast and colorectal cancers. Science 2006; 314: 268–274.
38 Yen KE, Bittinger M a, Su SM, Fantin VR. Cancer-associated IDH mutations: biomarker and therapeutic opportunities. Oncogene 2010; 29: 6409–6417.
39 Pauwels EKJ, Sturm EJC, Bombardieri E, Cleton FJ, Stokkel MPM. Positron-emission tomography with [18F]fluorodeoxyglucose. J Cancer Res Clin Oncol 2000; 126: 549–559.
40 Gatenby RA, Gillies RJ. Glycolysis in cancer: A potential target for therapy. Int J Biochem Cell Biol 2007; 39: 1358–1366.
41 Tennant D a, Durán R V, Gottlieb E. Targeting metabolic transformation for cancer therapy. Nat Rev Cancer 2010; 10: 267–277.
42 Singh D, Banerji AK, Dwarakanath BS, Tripathi RP, Gupta JP, Mathew TL et al. Optimizing Cancer Radiotherapy with 2-Deoxy-D-Glucose. Strahlentherapie und Onkol 2005; 181: 507–514.
43 Kim EH, Lee J-H, Oh Y, Koh I, Shim J-K, Park J et al. Inhibition of glioblastoma tumorspheres by combined treatment with 2-deoxyglucose and metformin. Neuro Oncol 2016; : now174.
44 Lin H, Zeng J, Xie R, Schulz MJ, Tedesco R, Qu J et al. Discovery of a Novel 2,6-Disubstituted Glucosamine Series of Potent and Selective Hexokinase 2 Inhibitors. ACS Med Chem Lett 2016; 7: 217–222.
45 Paterson E, Farr RF. Cerebellar Medulloblastoma: Treatment by Irradiation of the whole central nervous system. Acta radiol 1952; 39: 323–336.
46 Hirsch JF, Renier D, Czernichow P, Benveniste L, Pierre-Kahn A. Medulloblastoma in Childhood. Survival and Functional Results. Acta Neurochir (Wien) 1979; 48: 1–15.
47 Park TS, Hoffman HJ, Hendrick EB, Humphreys RP, Becker LE. Medulloblastoma: clinical presentation and management. J Neurosurg 1983; 58: 543–552.
48 Packer RJ, Sutton LN, Elterman R, Lange B, Goldwein J, Nicholson HS et al. Outcome for children with medulloblastoma treated with radiation and cisplatin, CCNU, and vincristine chemotherapy. J Neurosurg 1994; 81: 690–698.
49 Packer RJ, Goldwein J, Nicholson HS, Vezina LG, Allen JC, Ris MD et al. Treatment of Children With Medulloblastomas With Reduced-Dose Craniospinal Radiation Therapy and Adjuvant Chemotherapy : A Children ’ s Cancer Group Study. J Clin Oncol 1999; 17: 2127–2136.
50 Packer RJ, Gajjar A, Vezina G, Rorke-Adams L, Burger PC, Robertson PL et al. Phase III study of craniospinal radiation therapy followed by adjuvant chemotherapy for newly diagnosed average-risk medulloblastoma. J Clin Oncol 2006; 24: 4202–8.
52 Johnson DL, McCabe MA, Nicholson HS, Joseph AL, Getson PR, Byrne J et al. Quality of long-term survival in young children with medulloblastoma. J Neurosurg 1994; 80: 1004–1010.
53 Duffner PK. Long-term effects of radiation therapy on cognitive and endocrine function in children with leukemia and brain tumors. Neurologist 2004; 10: 293–310.
54 Kool M, Korshunov A, Remke M, Jones DTW, Schlanstein M, Northcott PA et al. Molecular subgroups of medulloblastoma: an international meta-analysis of transcriptome, genetic aberrations, and clinical data of WNT, SHH, Group 3, and Group 4 medulloblastomas. Acta Neuropathol 2012; 123: 473–484.
55 Northcott PA, Korshunov A, Witt H, Hielscher T, Eberhart CG, Mack S et al. Medulloblastoma comprises four distinct molecular variants. J Clin Oncol 2011; 29: 1408–1414.
56 Northcott PA, Korshunov A, Pfister SM, Taylor MD. The clinical implications of medulloblastoma subgroups. Nat Rev Neurol 2012; 8: 340–351.
57 Northcott P a., Shih DJH, Peacock J, Garzia L, Sorana Morrissy a., Zichner T et al. Subgroup-specific structural variation across 1,000 medulloblastoma genomes. Nature 2012; 488: 49–56.
58 Northcott P a, Dubuc AM, Pfister S, Taylor MD. Molecular subgroups of medulloblastoma. Expert Rev Neurother 2012; 12: 871–884.
59 Hallahan AR, Pritchard JI, Hansen S, Benson M, Stoeck J, Hatton BA et al. The SmoA1 Mouse Model Reveals That Notch Signaling Is Critical for the Growth and Survival of Sonic Hedgehog-Induced Medulloblastomas. Cancer Res 2004; 21: 7794–7800.
60 Hatten ME, Alder J, Zimmerman K, Heintz N. Genes involved in cerebellar cell specification and differentiation. Curr Opin Neurobiol 1997; 7: 40–47.
61 Dahmane N, Ruiz i Altaba A. Sonic hedgehog regulates the growth and patterning of the cerebellum. Development 1999; 126: 3089–3100.
62 Vaillant C, Monard D. SHH pathway and cerebellar development. Cerebellum 2009; 8: 291–301.
63 Hatten ME, Roussel MF. Development and cancer of the cerebellum. Trends Neurosci 2011; 34: 134–42.
64 Schüller U, Heine VM, Mao J, Kho AT, Dillon AK, Han Y-G et al. Acquisition of granule neuron precursor identity is a critical determinant of progenitor cell competence to form Shh-induced medulloblastoma. Cancer Cell 2008; 14: 123–134.
65 Yang Z-J, Ellis T, Markant SL, Read T-A, Kessler JD, Bourboulas M et al. Medulloblastoma can be initiated by deletion of Patched in lineage-restricted progenitors or stem cells. Cancer Cell 2008; 14: 135–145.
66 Wechsler-Reya RJ, Scott MP. Control of Neuronal Precursor Proliferation in the Cerebellum by Sonic Hedgehog. Neuron 1999; 22: 103–114.
70 Zurawel RH, Allen C, Chiappa S, Cato W, Biegel J, Cogen P et al. Analysis of PTCH/SMO/SHH pathway genes in medulloblastoma. Genes Chromosomes Cancer 2000; 27: 44–51.
71 Taylor MD, Liu L, Raffel C, Hui C, Mainprize TG, Zhang X et al. Mutations in SUFU predispose to medulloblastoma. Nat Genet 2002; 31: 306–310.
72 Reifenberger J, Wolter M, Weber RG, Megahed M, Ruzicka T, Lichter P et al. Missense mutations in SMOH in sporadic basal cell carcinomas of the skin and primitive neuroectodermal tumors of the central nervous system. Cancer Res 1998; 58: 1798–1803.
73 Goorich L V, Milenkovic L, Higgins KM, Scott M. Altered neural cell fates and medulloblastoma in mouse patched mutants. Science 1997; 277: 1109–1113.
74 Wetmore C, Eberhart DE, Curran T. Loss of p53 but not ARF accelerates medulloblastoma in mice heterozygous for patched. Cancer Res 2001; 61: 513–516.
75 Markant SL, Wechsler-Reya RJ. Personalized mice: Modelling the molecular heterogeneity of medulloblastoma. Neuropathol Appl Neurobiol 2012; 38: 228–240.
76 Xie J, Murone M, Luoh S-M, Ryan A, Gu Q, Zhang C et al. Activating Smoothened mutations in sporadic basal-cell carcinoma. Nature 1998; 391: 90–92.
77 Taipale J, Chen JK, Cooper MK, Wang B, Mann RK, Milenkovic L et al. Effects of oncogenic mutations in Smoothened and Patched can be reversed by cyclopamine. Nature 2000; 406: 1005– 1009.
78 Hatton BA, Villavicencio EH, Tsuchiya KD, Pritchard JI, Ditzler S, Pullar B et al. The Smo/Smo model: Hedgehog-induced medulloblastoma with 90% incidence and leptomeningeal spread. Cancer Res 2008; 68: 1768–1776.
79 Mao J, Ligon KL, Rakhlin EY, Thayer SP, Bronson RT, Rowitch D et al. A Novel Somatic Mouse Model to Survey Tumorigenic Potential Applied to the Hedgehog Pathway. Cancer Res 2006; 66: 10171–10178.
80 Zhuo L, Theis M, Alvarez-Maya I, Brenner M, Willecke K, Messing A. hGFAP-cre transgenic mice for manipulation of glial and neuronal function in vivo. Genesis 2001; 31: 85–94.
81 Bhatia B, Potts CR, Guldal C, Choi S, Korshunov A, Pfister S et al. Hedgehog-mediated regulation of PPARγ controls metabolic patterns in neural precursors and shh-driven medulloblastoma. Acta Neuropathol 2012; 123: 587–600.
82 Gershon TR, Crowther AJ, Tikunov A, Garcia I, Annis R, Yuan H et al. Hexokinase-2-mediated aerobic glycolysis is integral to cerebellar neurogenesis and pathogenesis of medulloblastoma. Cancer Metab 2013; 1: 1–17.
83 Gershon TR, Crowther AJ, Liu H, Miller CR, Deshmukh M. Cerebellar granule neuron progenitors are the source of Hk2 in the postnatal cerebellum. Cancer Metab 2013; 1: 15–16.
84 Wolf A, Agnihotri S, Munoz D, Guha A. Developmental profile and regulation of the glycolytic enzyme hexokinase 2 in normal brain and glioblastoma multiforme. Neurobiol Dis 2011; 44: 84– 91.
85 Tikunov AP, Winnike JH, Tech K, Jeffries RE, Semelka C, Martin J et al. Fluxomics by NMR spectroscopy from cells to organisms focusing on liver. Curr Metabolomics 2013; 1: 1–32.
87 Rochfort S. Biology and Implications for Natural Products Research. J Nat Prod 2005; 68: 1813– 1820.
88 Oliver S. Systematic functional analysis of the yeast genome. Trends Biotechnol 1998; 16: 373– 378.
89 Patel S, Ahmed S. Emerging field of metabolomics: Big promise for cancer biomarker identification and drug discovery. J Pharm Biomed Anal 2015; 107: 63–74.
90 Raamsdonk LM, Teusink B, Broadhurst D, Zhang N, Hayes A, Walsh MC et al. A functional genomics strategy that uses metabolome data to reveal the phenotype of silent mutations. Nat Biotechnol 2001; 19: 45–50.
91 Urbanczyk-Wochniak E, Luedemann A, Kopka J, Selbig J, Roessner-Tunali U, Willmitzer L et al. Parallel analysis of transcript and metabolic profiles: a new approach in systems biology. EMBO Rep 2003; 4: 989–993.
92 Freeman R. A short history of NMR. Chem Heterocycl Compd 1995; 31: 1004–1005.
93 Purcell E, Torrey H, Pound R. Resonance Absorption by Nuclear Magnetic Moments in a Solid. Phys Rev 1946; 69: 37–38.
94 Fan TW-M, Lane AN, Higashi RM (eds.). The Handbook of Metabolomics. Springer: New York, NY, 2012 doi:10.1007/978-1-61779-618-0.
95 Ernst RR, Anderson WA. Application of fourier transform spectroscopy to magnetic resonance. Rev Sci Instrum 1966; 37: 93–102.
96 Ernst RR. Nuclear magnetic double resonance with an incoherent radio-frequency field. J Chem Phys 1966; 45: 3845–3861.
CHAPTER II: PYRUVATE KINASE INHIBITS PROLIFERATION DURING POSTNATAL CEREBELLAR
NEUROGENESIS AND SUPPRESSES MEDULLOBLASTOMA FORMATION
2.1 Overview
Aerobic glycolysis supports proliferation in development and cancer through unresolved
mechanisms. Aerobic glycolysis is integral to cerebellar neurogenesis and medulloblastoma, a malignant
cerebellar tumor. Blocking glycolysis in cerebellar granule neuron progenitors (CGNPs) by deleting
Hexokinase-2 (Hk2) disrupts proliferation and restricts medulloblastoma growth. In contrast, we now show
that inhibiting the later stages of glycolysis by disrupting Pyruvate kinase-M (Pkm) increases CGNP
proliferation and medulloblastoma growth. Differentiated neurons splice Pkm to the more active PKM1
isoform while neural progenitors and medulloblastomas exclusively express the less active PKM2.
Isoform-specific Pkm2 deletion in CGNPs ablated PKM2 without inducing compensatory PKM1, resulting
in reduced glycolysis and increased progenitor proliferation. Moreover, Pkm2 deletion accelerated tumor
formation in medulloblastoma-prone ND2:SmoA1 mice. Thus PKM2 is not required for neural progenitor
proliferation or tumorigenesis. Rather, the loss of pyruvate kinase releases cells from growth inhibition.
We show that aerobic glycolysis supports growth through steps upstream of pyruvate kinase.
2.2 Introduction
Increased aerobic glycolysis is a common feature of proliferating cells during developmental and
malignant growth1–3. CGNPs are transit amplifying cells that proliferate in the postnatal brain4,5 and utilize
aerobic glycolysis during normal brain development6. CGNP proliferation is strictly regulated; excessive
CGNP growth and delayed maturation promote the formation of medulloblastoma, the most common
malignant pediatric brain tumor7–9. Medulloblastomas co-opt developmentally-regulated programs of
aerobic glycolysis supports CGNP proliferation and medulloblastoma tumorigenesis may provide new
insight into both neurodevelopmental disorders and cancer biology.
During postnatal brain development, CGNPs proliferate in the cerebellum in response to locally
secreted Sonic Hedgehog (SHH), generating the largest neuron population in the mammalian brain13–16.
In synchrony with increased proliferation, SHH signaling in CGNPs induces Hexokinase-2 (HK2)
expression and aerobic glycolysis6,12. 30% of medulloblastoma patients show SHH-pathway activation17–
19 and mice with activating SHH-pathway mutations develop spontaneous medulloblastomas that
recapitulate the human disease20–22. These tumors, like CGNPs, up-regulate HK2 and aerobic glycolysis.
Examining CGNP proliferation and SHH-driven tumorigenesis in mice provides an in vivo model for
determining how aerobic glycolysis supports developmental and malignant growth.
We have previously shown that conditional deletion of Hk2 in the developing brain blocks
SHH-induced aerobic glycolysis, disrupts the typical pattern of CGNP differentiation, and reduces
medulloblastoma growth, extending the survival of medulloblastoma-prone mice6. These findings suggest
that blocking glycolysis through HK2 inhibition may produce a clinically significant anti-tumor effect.
Development of HK2 inhibitors for anti-cancer therapy however, has been problematic23. Furthermore,
while the effects of HK2 inhibition demonstrate the importance of aerobic glycolysis in development and
cancer, the specific glycolytic reactions or products that support proliferation have not been identified. To
better characterize how glycolysis supports physiologic and malignant proliferation, we investigated the
role of pyruvate kinase in cerebellar growth and medulloblastoma.
While HK2 catalyzes the first step in glycolysis24, pyruvate kinase catalyzes the final step in the
pathway, converting phosphoenolpyruvate (PEP) and ADP into pyruvate and ATP25. Pkm is the pyruvate
kinase gene expressed in most tissues including the central nervous system26. Alternative splicing of a
single exon from Pkm gives rise to either Pkm1, which includes exon 9, or Pkm2, which replaces exon 9
tetramer26,33,34. PKM2 activation can be suppressed by interaction with tyrosine-phosphorylated proteins
in response to growth factor receptor signaling31,33,35. The ability to regulate PKM2 through both
endogenous allosteric effectors and intracellular signaling pathways may allow proliferating cells to adjust
their metabolism to meet dynamic cellular requirements29.
Because PKM2is the pyruvate kinase isoform expressed in most cancers, it has been suggested
as a potential target for anti-cancer therapy. Xenograft tumors engineered to overexpress either PKM1 or
PKM2 showed that PKM2 isoform expression confers a growth advantage36. Other studies have reported
nonmetabolic, growth-promoting functions such as transcriptional regulation37,38 and histone
phosphorylation30,39–41, however, whether PKM2 can act as a protein kinase is controversial42. Moreover,
the oncogenic potential of Pkm2 was challenged by the finding that the isoform-specific deletion of PKM2
accelerates tumorigenesis in a mouse model of breast cancer43, and promotes late-onset liver cancer in
mice44.
In the brain, PKM2 has been reported to be induced by SHH in CGNPs and expressed in the
ND2:SmoA1 mouse model of medulloblastoma12,45, suggesting a role in SHH-driven growth. PKM2
up-regulation has also been noted in MYC-amplified Group 3 medulloblastomas46, suggesting a role for
PKM2 in tumor growth across medulloblastoma subgroups. Here, we analyzed how conditional Pkm2
deletion in CGNPs alters metabolism, proliferation, and medulloblastoma tumorigenesis. Pkm2 deletion,
like Hk2, decreased glycolysis. In contrast to Hk2-deleted mice, however, Pkm2-deleted animals showed
increased CGNP growth and accelerated medulloblastoma formation. The differential effects of impeding
aerobic glycolysis through deletion of Hk2 or Pkm2 point to the glycolytic steps upstream of pyruvate
kinase as critical to promoting proliferation.
2.3 Results
2.3.1 Pkm isoform expression in the brain mirrors differentiation status
We found a dichotomous pattern of Pkm splicing in the postnatal brain, with PKM2 expressed by
showed PKM1 expression in differentiated neurons throughout the brain and absence of PKM1 in
progenitor regions, including the cerebellar external granule layer (EGL), the hippocampus, and the
subventricular zone/rostral migratory stream (SVZ/RMS) (Fig. 2.1A). In contrast, the neural progenitors of
the EGL, the hippocampus, and the SVZ/RMS specifically expressed PKM2 and not PKM1 (Fig. 2.1B).
In the postnatal cerebellum, neural progenitor proliferation peaks at P7 then wanes, ending by
P15, as CGNPs exit the cell cycle, migrate to the internal granule layer (IGL), and differentiate into
cerebellar granule neurons (CGNs)4,11,47. Western blot of whole cerebellum lysates showed that PKM2,
like the proliferation marker Cyclin D2 (CCND2), decreased between P7 and P15, while PKM1 conversely
increased (Fig. 2.1C). PKM2 expression, however, was not limited to proliferating cells; both proliferating
PCNA+ CGNPs in the outer layer of the EGL (oEGL), and differentiating PCNA- CGNPs of the inner EGL
(iEGL) expressed PKM2 (Fig. 2.1D). Similarly, in the SVZ/RMS, both PCNA+ and PCNA- progenitors
expressed PKM2 (Fig. 2.1E). Thus, PKM2 marked undifferentiated brain progenitors, whether
proliferating or quiescent, while PKM1 marked differentiated neurons.
To determine if medulloblastomas, like CGNPs, exclusively expressed PKM2, we analyzed PKM
isoform expression in transgenic, medulloblastoma-prone ND2:SmoA1 mice. ND2:SmoA1 mice express a
mutant, constitutively active allele of Smo, driven by the NeuroD2 promoter. In CGNPs of ND2:SmoA1
mice, cell autonomous SHH activation prolongs proliferation beyond P15. These mice develop
medulloblastoma with incomplete penetrance after a variable latency20. During this latent period, CGNPs
continue to proliferate as premalignant lesions within the EGL, generating progeny that differentiate,
undergo apoptosis, or remain proliferative.
We found that CGNPs in the premalignant lesions of P60 ND2:SmoA1 mice expressed PKM2
and not PKM1 (Fig. 2.1F). Similarly, medulloblastomas that arose from these premalignant lesions
consistently and homogeneously expressed PKM2, while adjacent, normal brain expressed PKM1 (Fig.
expression of PKM1 in all four medulloblastoma subgroups (Fig. 2.1H). Together, our studies of mouse
and human tumors show that PKM2 expression in the mouse model recapitulates the distinct pattern of
PKM expression in medulloblastoma patients.
2.3.2 SHH stimulates PKM2 expression
To examine the effect of SHH signaling on PKM1/2 expression, we isolated CGNPs and
compared PKM isoform expression in the presence or absence of SHH ligand. We identified cells at
S-phase by adding 5-ethynyl-2’-deoxyuridine (EdU) to CGNP cultures 1h before fixation. EdU+ cells and
PKM2+ cells were more numerous in treated wells (Fig. 2.2A; cyan arrows) compared
SHH-deprived controls (Fig. 2.2B; arrows). In SHH-treated wells, PKM2 was detected in both EdU+ and EdU-
cells (Figs. 2.2A,B; white arrowheads). Consistent with the absence of PKM1 expression in the EGL, no
CGNPs in either condition showed a detectable level of PKM1; rare cells that were PKM1 positive did not
have the size and shape characteristic of CGNPs (Figs. 2.2C,D). These data show that SHH sustained
PKM2 expression in CGNPs, while PKM1 expression remained low as SHH-deprived CGNPs exited the
cell cycle.
We used Western blot to compare PKM1 and PKM2 expression between CGNPs cultured with or
without SHH ligand or with SHH ligand plus the Smo inhibitor vismodegib (vismo)48. As an indicator of
SHH-driven proliferation, we also measured the expression of CCND2 protein. As expected, SHH-treated
CGNPs expressed 5.5-fold more CCND2 compared to CGNPs without SHH (Fig. 2.2E). SHH-treated
CGNPs expressed 2-fold more PKM2 (Fig. 2.2E). The low level of PKM1 expression that did not localize
to CGNPs by immunostaining was also significantly increased by SHH (Fig. 2.2E). However, while SHH
inhibition by vismo decreased CCND2 by 30%, the effects of vismo on PKM1 and PKM2 were relatively
small and not statistically significant (Fig. 2.2E). These data show that the expression of both PKM2 and
CCND2 was up-regulated by SHH. Compared to CcnD2, however, Pkm was markedly less responsive to
2.3.3 Pyruvate kinase activity in CGNPs is increased by growth stimulation
SHH and IGF receptor (IGFR) signaling converge to regulate aerobic glycolysis in CGNPs6.
Tyrosine kinase signaling, and specifically insulin signaling, can down-regulate the enzymatic activity of
PKM2 in diverse cell lines33,49,50. While CGNPs are typically cultured with insulin-rich N2 supplement to
improve cell viability51, we have previously shown that CGNPs can be cultured in the absence of N2 for
24h, reducing IGFR activation without compromising survival6. We maintained CGNPs in the presence or
absence of SHH or N2, to determine the effect of SHH and IGFR stimulation on CGNP pyruvate kinase
activity.
We found that withholding either SHH6 or N2 similarly reduced glycolysis, detected by reduced
lactate production (Fig. 2.2F). We measured pyruvate kinase activity in lysates of CGNPs cultured with or
without SHH or N2 by quantifying the conversion of exogenous PEP to pyruvate. CGNPs maintained with
SHH + N2 showed significantly higher pyruvate kinase activity compared to either SHH without N2 or N2
without SHH (Figs. 2.2G,H). These findings show that CGNP pyruvate kinase activity, like PKM
expression, was responsive to extracellular signaling, and was maximal with SHH/IGFR co-activation.
While reduced pyruvate kinase activity has been correlated with growth factor stimulation in cancer
cells31,35,36, in CGNPs, developmentally-relevant growth factors increased pyruvate kinase expression,
pyruvate kinase activity, and aerobic glycolysis.
2.3.4 Pkm2 deletion is not replaced by Pkm1 in brain progenitors
To determine the developmental significance of PKM function and splicing in CGNPs, we
examined the effect of conditionally deleting Pkm exon 10, the exon that is differentially included in PKM2
and excluded from PKM127. We crossed Math1-Cre mice, which express Cre recombinase in CGNPs52,53,