Previously, we have reported a lipid-based Trp2 peptide vaccine for immunotherapy against melanoma. The sup-pressive immune microenvironment in the tumor is a major hurdle for an effective vaccine therapy. We hypothesized that curcumin (CUR) would remodel the tumor micro-environment to improve the vaccine activity. Curcumin– polyethylene glycol conjugate (CUR–PEG), an amphiphilic CUR-based micelle, was delivered intravenously (i.v.) to the tumor. Indeed, in the B16F10 tumor–bearing mice, the combination of CUR–PEG and vaccine treatment resulted in a synergistic antitumor effect (P < 0.001) com-pared to individual treatments. In the immune organs, the
combination therapy significantly boosted in vivo
cyto-toxic T-lymphocyte response (41.0 ± 5.0% specific killing) and interferon-γ (IFN-γ) production (sevenfold increase). In the tumor microenvironment, the combination therapy led to significantly downregulated levels of immunosup-pressive factors, such as decreased numbers of myeloid-derived suppressor cells and regulatory T cells (Treg) cells and declined levels of interleukin-6 and chemokine ligand 2—in correlation with increased levels of proinflammatory cytokines, including tumor necrosis factor-α and IFN-γ as
well as an elevation in the CD8+ T-cell population. The
results indicated a distinct M2 to M1 phenotype switch in the treated tumors. Combining CUR–PEG and vaccine also dramatically downregulated the signal transducer and activator of transcription 3 pathway (76% reduction). Thus, we conclude that CUR–PEG is an effective agent to improve immunotherapy for advanced melanoma. Received 24 June 2015; accepted 26 August 2015; advance online publication 13 October 2015. doi:10.1038/mt.2015.165
INTRODUCTION
Cancer immunotherapy is based on certain approaches intended to generate immune responses against malignant cells.1 Melanomas, some of the most immunogenic tumors, are often the targets of these
approaches, among which, vaccination strategies play important roles in the immunotherapeutic interventions by specifically boost-ing both the innate and adaptive immune responses.2 However, as the tumor escalates to a late stage, the local tumor microenvironment becomes dominantly immunosuppressive, which avoid immune recognition and elimination.3,4 This results in the compromised suc-cesses of therapeutic vaccines. Breaking down the innate and adap-tive systems barriers and reversing the tumor microenvironment as well as the whole periphery of the system in order to achieve a maxi-mal antitumor efficacy and longer survival rate remains a challenge for us. Our nano-based vaccine platform, containing both tumor-associated antigen Trp2 and CpG ODN (a Toll-like receptor 9 ago-nist) adjuvant,5 exhibited a potent antitumor ability against murine melanoma in the early stages. Although our vaccine still could stim-ulate a strong cytotoxic T-cell response once the tumor progressed to a late stage, it was not able to inhibit tumor growth effectively. This is most likely due to the suppressive tumor microenvironment pres-ent in late-stage tumors. Myeloid-derived suppressor cells (MDSCs) are such kinds of immune-suppressive cells in the immune organs and tumor tissue.6,7 It has been shown that elevated MDSCs sup-press the immune response, promoting tumor growth through impairing dendritic cell antigen presentation functions and CD8+ T-cell killing.8 In addition, signal transducer and activator of tran-scription 3 (STAT3) signaling pathway also plays an important role in facilitating tumor growth.9,10 The constitutively activated STAT3 in the tumor is believed to block the secretion of proinflammatory mediators (such as interferon-γ (IFN-γ), interleukin-12 (IL-12), etc.) and to increase that of immunosuppressive factors (such as MDSC, vascular endothelial growth factor, IL-10, etc.).11,12 The reduction of MDSCs and blockade of STAT3 pathway have been indicated as strategies for the purpose of enhancing the effectiveness of cancer immunotherapy. To remodel the microenvironment, it is also neces-sary to get help from a drug that could play pivotal roles not only in killing tumor cells but also in dealing with the immune environment such as reducing MDSCs13 or downregulation of STAT3.14,15
Curcumin (CUR), a component of turmeric and one of the oldest natural polyphenols in traditional Asian medicine, is such 364
374
Curcumin Micelles Enhance Vaccine Activity
Molecular Therapy 10.1038/mt.2015.165
00
feb2016
242
24June2015
26August2015
© The American Society of Gene & Cell Therapy
Correspondence: Guangya Xiang, School of Pharmacy, Tongji Medical College, Huazhong University of Science and Technology, 13 Hang Kong Road, Wuhan, Hubei 430030, China. E-mail: [email protected] or Leaf Huang, Division of Molecular Pharmaceutics, Center for Nanotechnology in Drug Delivery, Eshelman School of Pharmacy, University of North Carolina at Chapel Hill, 1315 Kerr Hall, 311 Pharmacy Lane, Chapel Hill, North Carolina 27599, USA. E-mail: [email protected]
Curcumin Micelles Remodel Tumor
Microenvironment and Enhance Vaccine
Activity in an Advanced Melanoma Model
Yao Lu
1,2, Lei Miao
1, Yuhua Wang
1, Zhenghong Xu
1, Yi Zhao
1, Youqing Shen
3, Guangya Xiang
2and Leaf Huang
11Division of Molecular Pharmaceutics, Center for Nanotechnology in Drug Delivery, Eshelman School of Pharmacy, University of North Carolina at
a chemodrug.16,17 As a well-known JAK-STAT3 pathway inhibi-tor,14,15,18 CUR inhibits MDSCs in the spleen and tumor tissue in breast cancer models19 and 3LL Lewis lung cancer models.20 However, its lipophilic nature and relatively low solubility in aque-ous solutions create a major challenge in clinical applications as a potent anticancer agent. In an effort to circumvent these obsta-cles, numerous strategies have been tried to enhance anticancer efficacy, including development of delivery systems such as lipo-somes,14,21 poly(lactic-co-glycolic acid) nanoparticles (NPs),22 and other polymeric micelles.23,24 In our present work, we synthesized an intracellular-labile amphiphilic CUR-based micelle as our drug delivery system.25,26 Previous results showed that this novel micelle system exhibited enhanced anticancer activity in several cell lines both in vitro and in vivo.14,21–24 If combined with a cancer thera-peutic vaccine, curcumin–polyethylene glycol conjugate (CUR– PEG) would probably boost the tumor immune environment,18,19 effectively fighting against aggressively advanced melanoma.
Based on the above researches, intracellular-labile CUR–PEG micelles may synergize with our lipid/calcium/phosphate nanopar-ticles (LCP NPs) based vaccine for the treatment of advanced mela-noma. The combination of CUR–PEG and Trp2 vaccine treatment may break down the barriers of cancer immunotherapy, achieving enhanced cytotoxic T-cell killing, inhibition of tumor-promoting sig-naling pathways, and tumor microenvironment modulation. In our present works, the two modalities were rationally combined for the following studies (Figure 1c). The anticancer efficacy of the com-bined therapy was compared with the two individual treatments and a control group. Subsequently, in vivo cytotoxic T-lymphocyte (CTL) response, IFN-γ production, key signaling pathways, and changes in the local tumor microenvironment were also studied to verify our hypothesis.
RESULTS
Characterization of the CUR–PEG micelle
First, the CUR–PEG was synthesized and dissolved in sterile 5% glucose in order to form nanoscaled micelles. The mean diam-eters and zeta potentials of the micelle NPs were 45.3 ± 5.4 nm and −6.5 ± 2.1 mV, respectively. For further confirmation of the mor-phologies and sizes of the particles, transmission electron micros-copy pictures were taken showing that the mean sizes of micelles were about 45 nm (Supplementary Figure S1a–c). In vitro, CUR– PEG could enter into B16F10 cells in 1 hour, exhibiting higher cellular uptake than free CUR (Supplementary Figure S1d,e).
Biodistribution of CUR–PEG and CUR
CUR–PEG is stable in the blood circulation but is quickly hydro-lyzed to release CUR in the presence of glutathione or esterase when it enters into the tumor cytosol.25 Thus, the prodrug CUR– PEG exhibited the same property as free CUR in the intracellular compartment. To compare the biodistribution of CUR–PEG with that of free CUR, two groups of mice were intravenously (i.v.) injected with CUR–PEG and intraperitoneally (i.p.) injected with free CUR, respectively. After 1, 4, and 24 hours of injection, the concentrations of CUR in different organs were determined and the biodistribution of CUR in the mice is shown in Figure 1a. In the free CUR group, most of the drugs accumulated in the kidneys and blood after 1 hour and were quickly cleared from the blood
circulation and body. After 24 hours, there was no detectable CUR in the tumor tissue and blood. On the other hand, the i.v. injected CUR–PEG group showed a much higher concentration in liver, kidney, and tumor after 1 and 4 hours. After 24 hours, there was still a modest amount of CUR in the tumor tissue even though the liver and spleen were still the major accumulation sites. Therefore, the PEGylated CUR micelles achieved significantly higher levels in the tumor tissue compared to the free CUR. The improved CUR bioavailability enhanced passive tumor accumulation most likely due to the enhanced permeability and retention effect of the leaky tumor vasculature.27–29 However, the drug concentra-tion in the tumor tissue, estimated to be 0.8 µg/ml at 24 hours, was still not high enough to significantly inhibit tumor growth in this advanced melanoma model (compared to its IC50in vitro; Supplementary Figure S1f). Thus, we suspected that any signifi-cant antitumor activity of the CUR–PEG must be the result of its action in the tumor microenvironment.
Combined therapy with CUR–PEG and vaccine-improved antitumor response against B16F10 tumor
CUR is a mild antitumor agent. In order to maximize its efficacy against an aggressive melanoma, a peptide cancer vaccine for-mulated in LCP NP was used as the synergistic agent. A peptide derived from the tumor-associated antigen Trp2 was phosphory-lated and encapsuphosphory-lated in the NPs. The vaccine containing calcium phosphate, phosphopeptide, and CpG adjuvant in the central core and a wrapping asymmetric lipid membrane was first developed in our lab.30 The vaccine showed a good therapeutic activity for the treatment of preexisting melanoma. Even in the immune-suppressive microenvironment, with compromised antitumor activity, the vaccinated mice could exhibit moderate specific T-cell response. As shown in Figure 1b, both the Trp2 vaccine group and CUR–PEG-only group showed a slight tumor inhibi-tion activity (P < 0.05). On the contrary, the combination group significantly inhibited tumor growth (P < 0.001) compared to the control group. There was no decrease in body weight observed in any of the four treatment groups (data not shown), indicating that neither vaccine nor CUR–PEG caused toxicity. This result veri-fied our hypothesis that the chemodrug combined with the Trp2 vaccine indeed exhibited superior antitumor efficacy even in this relatively late-stage tumor–bearing mouse model when a suppres-sive tumor microenvironment existed.5
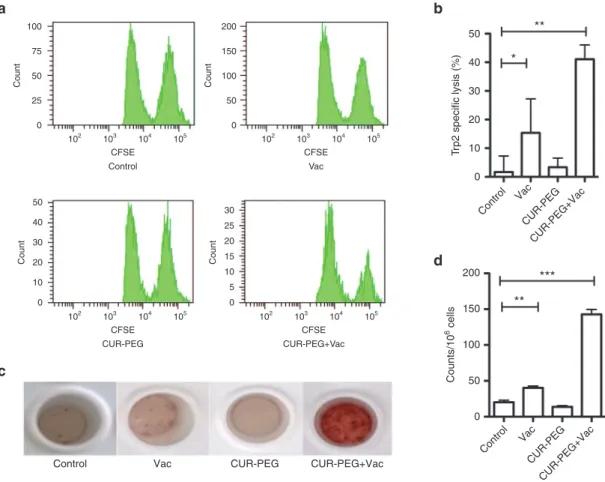
CUR–PEG enhanced in vivo CTL response and IFN-γ
production elicited by the vaccine
Figure 1 Drug biodistribution determination and tumor growth inhibition experiment. (a) CUR–PEG and CUR biodistribution in tumor-bear-ing mice. CUR was dissolved in dimethyl sulfoxide and administered through i.p. injection. An equivalent amount of CUR–PEG was i.v. injected in the B16F10 tumor–bearing mice. Treated mice were sacrificed and different organs were collected at 1, 4, and 24 hours. (b) Antitumor effi-cacy of the different treatments against B16F10 melanoma. About 2 × 10⁵ B16F10 cells were inoculated in C57BL/6 mice on day 0. Trp2 vaccine was given on day 12 and 16 (blue arrows). CUR–PEG was i.v. injected every other day for a total of five doses (black arrows). Tumor volumes were measured every 2–3 days. Data show mean ± SD, n = 10. *P < 0.05, ***P < 0.001. (c) The schematic representation of the combination therapy. APC, antigen-presenting cells; CCL2, chemokine ligand 2; CTL, cytotoxic T lymphocyte; CUR–PEG + Vac, curcumin–polyethylene glycol conjugate–treated and vaccinated group; DC, dendritic cell; IFN, interferon; IL, interleukin; LCP NPs, lipid/calcium/phosphate nanoparticles; MDSC, myeloid-derived suppressor cell; NP, nanoparticle; s.c., subcutaneous; STAT3, signal transducer and activator of transcription 3; TNF, tumor necrosis factor; Vac, vaccine-treated group.
60
50
40
30
20
10
Curcumin ID%/g of tissue
8 7 6 5 4 3 2 1 0
Tumor Heart Liver Spleen
CUR-PEG
Tumor microenvironment
Immune organs
Vaccination
CUR-PEG Micelles (i.v.) Tumor
CUR-PEG
CUR-PEG CUR-PEG
MDSC
Treg
Apoptosis Anti-angiogenesis
Tumor antigen CTL
CD8+T
CD8+T
IL-6
CCL2 IFN-rTNF-α
Antigen
IFN-r TNF-α
DC
DC
LCP
(s.c.)
CUR-PEG Self-assembling
Micelle LCP-based peptide NP Core: Trp2 peptide and CpG
Lung Kidney
CUR-PEG 1 hour CUR-PEG 4 hours CUR-PEG 24 hours
CUR 1 hour CUR 4 hours CUR 24 hours
4,500
Control
Vac
CUR-PEG
CUR-PEG+Vac
* * ***
4,000
3,500
3,000
2,500
2,000
1,500
Tumor volume (mm
3)
1,000
500
0
12 14 16 18
Days after tumor inoculation
20 22 24
Blood
a
c
in comparison with the other groups. The data indicated a syner-gized adaptive immunity through the CD8+ T-cytotoxic pathway.
IFN-γ is produced predominantly by cytotoxic T cells, medi-ating tumor rejection once adaptive immune response develops. So, an IFN-γ production study may further illustrate the syner-gized mechanism. IFN-γ production by lymphocytes was ana-lyzed using a BD ELISPOT assay system. As shown in Figure 2c,d, consistent with the result of the in vivo CTL assay, splenic cells extracted from both the control group and CUR–PEG group could barely generate IFN-γ. Failure to produce IFN-γ confirmed that these treatments could not induce Trp2-specific immune response. On the other hand, the group treated with the Trp2 vac-cine obtained modest IFN-γ production. The combination group exhibited a dramatically increased amount of IFN-γ.
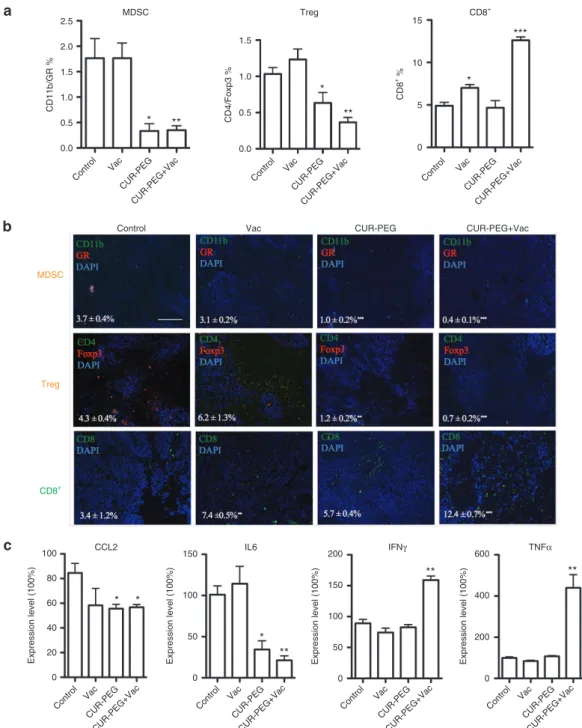
Changes of tumor-infiltrating immune cells and cytokine levels in tumor microenvironment
To further elucidate why the combination strategy could efficiently inhibit tumor growth, we also checked the changes of the related immune regulatory subsets and cytokines in the tumor microen-vironment, in which, cancer cells, tumor-infiltrating lymphocytes,
neovasculature, fibroblasts, and secreted cytokines all partake in a complicated interplay network.32 Results were quantified by flow cytometry and were also shown by immunostaining of tumor sections. MDSCs were checked as the first regulatory subset. As shown in Figure 3a, the percentages of MDSC in the CUR–PEG-only group and combination group were much lower than those for both the vaccine and control groups. Since MDSCs can estab-lish immune tolerance by induction of regulatory T cell (Treg) development, the blockage of MDSC may lead to inhibition of Treg. We therefore detected the percentage of Treg in tumor tis-sues (Figure 3a). Consistent with the trends of MDSCs, the CUR– PEG drug–treated group and combination group exhibited fewer Treg cells than the vaccine and control groups. The depletion of MDSC and Treg cells may facilitate effector T cells,3 and there-fore the CD8+ T cells were also detected. As shown in Figure 3a, the vaccine group and combination group both induced a sig-nificant increase in CD8+ T cells compared to the control and CUR–PEG-only groups. Immunostaining further confirmed the flow cytometry results (Figure 3b). Our results indicated that the single-treatment groups could only partially reverse the immu-nosuppressive microenvironment. For example, the vaccine-only Figure 2 In vivo cytotoxic T-lymphocyte (CTL) response and ELISPOT assay. (a,b) In vivo CTL response after different treatments. Targeted lym-phocytes from naive mice were pulsed with ovalbumin (OVA) or Trp2 peptides and then stained with 0.5 or 5 µmol/l carboxyfluorescein succinimidyl ester (CFSE), respectively. The mix of both pulsed cells were injected back into the vaccinated mice though the tail vein. Sixteen hours after injection, splenocytes were separated again and analyzed with flow cytometry. The specific lysis activity of CTL was calculated using the equation mentioned in the Materials and Methods section. n = 3. A representative graph from each treatment is shown. (c,d) Interferon-γ (IFN-γ) production from the treated mice. Spleens were collected from which single-cell suspension was prepared 7 days after the second vaccination. The splenocytes were cocultured with either OVA or Trp2 peptide at 37 °C for 18 hours. The production of IFN-γ was calculated with a BD ELISPOT assay set. One of the representative results is shown in c. n = 3. *P < 0.05; **P < 0.01, ***P < 0.001. All data show mean ± SD. CUR–PEG + Vac, curcumin–polyethylene glycol conjugate– treated and vaccinated group; Vac, vaccine-treated group.
102 103 104
CFSE
Count Count
100
75
50
25
0
Count
50
Count
30 25 20 15 10 5 0 40
30
20
10
0
Tr
p2 specific lysis (%)
50 40 30 20 10 0
Contro l
Vac
CUR-PEG+Vac CUR-PEG Contro
l Vac
CUR-PEG+Vac CUR-PEG
Control Vac CUR-PEG CUR-PEG+Vac
200
150
100
50
0
105 102 103 104
CFSE
Control Vac
105
102 103 104
CFSE
105 102 103 104
CFSE
CUR-PEG CUR-PEG+Vac
105
200 ***
** **
*
150
Counts/1
0
6 cells
100
50
0
a b
c
group could increase the number of CD8+ T cells, but there was no decrease in MDSCs or Treg cells. The CUR–PEG-treated group could both decrease MDSC and Treg cell population, but due to the lack of vaccine, the amount of CD8+T cells in the drug-only group was still the same as that of the control group. Only the combination group could decrease both MDSCs and Treg
cells while increasing the CD8+ T cells, indicating an effective reversion of the suppressed microenvironment.
We then monitored the cytokine levels in the local tumor tissue in order to see whether or not the combination group could reverse the suppressed microenvironment via cytokine levels (Figure 3c). As we know, IL-6 is a potent pleiotropic inflammatory cytokine Figure 3 Changes of tumor-infiltrating immune cells and cytokine levels in tumor microenvironment. The B16F10 murine–bearing mice were divided into four groups and treated with phosphate-buffered saline, vaccine, CUR–PEG, or CUR–PEG/vaccine, respectively. At the end of treatment, mice were euthanized and tumor tissues were collected for (a) flow cytometry assay and (b) immunostaining evaluation: the first panel shows the MDSCs (orange), the second panel shows the Treg cells (orange), and the third panel shows the CD8+ T cells (green). *P < 0.05, **P < 0.01, ***P < 0.001. Data show mean ± SEM. Bar = 200 µm. The statistical analyses were calculated by comparison with the control group if not specifically mentioned. (c) Cytokine level detection using quantitative real-time PCR. n = 4, *P < 0.05, **P < 0.01. The statistical analyses were calculated by comparison with the control group if not specifically mentioned. All data show mean ± SD. CCL2, chemokine ligand 2; CUR–PEG + Vac, curcumin–polyethylene glycol conjugate–treated and vaccinated group; DAPI, 4′,6-diamidino-2-phenylindole; IFN, interferon; IL, interleukin; MDSC, myeloid-derived suppressor cell; TNF, tumor necrosis factor; Treg, regulatory T cell; Vac, vaccine-treated group.
2.5
CD11b/GR
%
2.0
1.5
**
*
* **
** **
*
**
***
*
*
*
1.0
0.5
0.0
Control Vac
CUR-PEG+Vac CUR-PEG
CD4/Foxp3
%
1.5
1.0
0.5 MDSC
0.0
Control Vac
CUR-PEG+Vac CUR-PEG
CD8
+ %
0 5 10 15
Control Vac
CUR-PEG+Vac CUR-PEG
Control Vac
CUR-PEG+Vac
CUR-PEG Control Vac
CUR-PEG+Vac
CUR-PEG Control Vac
CUR-PEG+Vac
CUR-PEG Control Vac
CUR-PEG+Vac CUR-PEG Control
CCL2
100 150
100
50
0 80
60
Expression level (100%) Expression level (100%)
200 600
400
200
0 150
100
50
0
Expression level (100%) Expression level (100%)
40
20
0
IL6 IFNγ TNFα
MDSC
Treg
CD8+
Vac CUR-PEG CUR-PEG+Vac
Treg CD8+
a
b
that is considered a key growth-promoting and antiapoptotic fac-tor.33,34 Chemokine ligand 2 (CCL2) is a small cytokine, which is critical for immunosuppression to promote cancer metastasis. Meanwhile, IFN-γ and tumor necrosis factor-α (TNF-α) are the cytokines secreted by cytotoxic T cells that facilitate T-cell kill-ing and fight against tumor progression.31,35 Compared with the control group, cytokines in the vaccine group neither increased nor decreased substantially (P > 0.05), indicating that the vaccine was not potent enough to inhibit the indicators in the suppressive microenvironment even though it could partially induce cytotoxic T cells. In the CUR–PEG group, CCL2 and IL-6 decreased substan-tially, and TNF-α and IFN-γ also slightly decreased although with-out significant differences (P > 0.05). In the combination group, CCL2 and IL-6 were significantly decreased, even when compared to the CUR–PEG treatment group. However, TNF-α and IFN-γ
were dramatically increased, indicating a M2 to M1 phonotype switch36–38 to an immune-stimulating microenvironment.39,40 This would consequently facilitate tumor antigen presentation and acti-vate recruitment of lymphocytes to act as scavengers and result in a robust cytotoxic T-cell-mediated tumor–specific killing.
STAT3 expression level was downregulated by the combination treatment
What was the underlying mechanism that changed the immuno-suppressive microenvironment to an immune-responsive tumor microenvironment in the combination therapy? Recent studies have identified that inhibiting STAT3 signaling pathway plays a pivotal role in cancer immunotherapy. STAT3 can be activated by IL-6– mediating signaling and by various other cytokines.34,41 Considering that the levels of IL-6 in the tumor tissue decreased in the CUR–PEG
group and the combination group, p-STAT3 expression levels were detected using western blotting analysis. First, B16F10 cells were treated with different concentrations of CUR–PEG and free CUR in vitro. Results showed that CUR–PEG could inhibit the STAT3 path-way like free CUR itself (Figure 4a), indicating that CUR–PEG is a prodrug for CUR. The inhibition was concentration dependent. Levels of p-STAT3 and STAT3 were then analyzed in vivo. In Figure 4b–d, the p-STAT3 and STAT3 levels were not downregulated in either the vaccine group or the CUR–PEG-alone group when com-pared with the control group. In the combination group, however, the p-STAT3 level was dramatically downregulated, even the STAT3 expression itself was slightly lower than other groups.
Changes of the tumor vessel and tumor-associated fibroblast
Tumor-associated fibroblasts (TAFs) and angiogenesis impede the infiltration of CTLs to the tumor tissues. The effect of the vaccine and drug on TAFs was investigated by staining for α-smooth mus-cle actin (α-SMA), a marker of TAFs, and CD31, a marker for the vasculature. The density and mean florescence were detected by fluorescence microscopy. Three microscopic fields were randomly selected for analysis. As shown in Figure 5a, the density of α-SMA and CD31 in the vaccine-only and drug-only groups was lower than that of the control group. The combination group exhibited the lowest density of α-SMA and CD31, which is consistent with previous reports of CUR’s antiangiogenic activity.14,42
Combination therapy–enhanced tumor apoptosis
Finally, the apoptotic assay was also performed. The apoptotic tumor cells act as both the adaptive immune response initiator
Figure 4 STAT3 levels after various treatments using western blotting assay. (a) In vitro p-STAT3 level changes after treatment with free CUR and an equivalent amount of CUR–PEG. (b) p-STAT3 expression levels in tumor tissues at the end of the treatments. Three repeated results were quantitatively analyzed using Image J. (c) p-STAT3 expression levels in tumor tissues. (d) STAT3 expression levels. *P < 0.05, ***P < 0.001. Data show mean ± SEM. CUR–PEG + Vac, curcumin–polyethylene glycol conjugate–treated and vaccinated group; GAPDH, glyceraldehyde 3-phosphate dehydrogenase; ns, nonsignificant; STAT3, signal transducer and activator of transcription 3; Vac, vaccine-treated group.
0 µmol/l p-STAT3
GAPDH
0.8 1.5
1.0
0.5
0.0 ns
ns 0.6
0.4
p-STAT3/GAPDH 0.2 STAT3/GAPDH
0.0
p-STAT3
*** *
STAT3 GAPDH
10 20 10 20
Control CUR CUR CUR-PEG CUR-PEG Control Vac CUR-PEG CUR-PEG+Vac
Contro l
Vac
CUR-PEG+Vac CUR-PE
G
Contro l
Vac
CUR-PEG+Vac CUR-PE
G
a b
and the reactor. As shown in Figure 5b, only a trace amount of terminal deoxynucleotidyl transferase dUTP nick end label-ing (TUNEL)-positive cells were observed in the control group, whereas a small amount of TUNEL-positive nuclei (green fluores-cent dots) were observed in vaccine-only group. The CUR–PEG-alone group showed a moderate amount of apoptotic cells. But in the combination group, an extensive amount of apoptotic cells were observed. Once again, the above results clearly demonstrate that the combination treatment showed superior antitumor activ-ity compared to either of the single-treatment groups.
Toxicity evaluation for the different treatments and blood chemistry analysis
The results of the toxicological evaluation demonstrated that there were not any noticeable morphological changes in the heart, liver, spleen, lungs, and kidneys for all of the four treatment groups. The serum biochemical value analysis demonstrated that the drug treatment group had no liver (aspartate aminotransferase and alanine aminotransferase) or kidney (creatinine and blood urea nitrogen) toxicity caused by tumor progression (Supplementary Figure S2a,b).
Figure 5 Tumor microenvironment changes after various treatments. The B16F10 murine–bearing mice were divided into four groups and treated with either phosphate-buffered saline, vaccine, CUR–PEG, or CUR–PEG/vaccine. At the end of treatment, mice were euthanized and tumor tissues were harvested for: (a) CD31 and TAF staining: upper panels were stained with CD31, lower panels were stained with α-SMA. (b) TUNEL assay. Trace amount of apoptosis were found in the untreated group (the first panel). Bar = 200 µm. A small amount of TUNEL-positive nuclei (green fluorescent dots) were found in the vaccine-only group (the second panel). A moderate amount of apoptotic cells were observed when treated with CUR–PEG alone (the third panel). Extensive apoptotic cells were found in the combination group (the fourth panel). N = 3, **P < 0.01, ***P < 0.001. Data show mean ±SEM. CUR–PEG + Vac, curcumin–polyethylene glycol conjugate–treated and vaccinated group; DAPI, 4',6-diamidino-2-phenylindole; α-SMA, α-smooth muscle actin; TAF, tumor-associated fibroblast; Vac, vaccine-treated group.
Control Vac
DAPI
Contro
l
Vac
CUR-PEG+Vac CUR-PEG
Merged
*** *** ** 80
60
40
Apoptotic areas
%
20
0 TUNEL
CUR-PEG+Vac
CUR-PE
G
Contro l
Vac
CUR-PEG+Vac CUR-PEG
a
DISCUSSION
The success of cancer vaccination is strongly hampered by immune suppression in the immune organs and tumor micro-environment, especially when tumors have developed to later stages. In the study presented here, we combined a therapeutic vaccine and nano-based CUR–PEG for the treatment of B16F10 melanoma and demonstrated that the combination therapy sig-nificantly retarded tumor growth compared to the Trp2 vaccine or CUR–PEG alone.
In the immune organs, why only the combination treatment group could generate the strongest adaptive immune response, achieving the best antitumor efficacy compared to other groups? As MDSCs impair the T-cell function, strongly contributing to immune suppression, MDSC content in the spleen was ana-lyzed. We found that CUR–PEG alone could significantly reduce MDSC numbers in the spleen of B16F10 tumor–bearing mice (Supplementary Figure S3), which was probably because CUR directly interfered with MDSC proliferation.13 MDSC is a popula-tion of early myeloid cells that are expanded in various disease states, including cancers, and are capable of suppressing the immune response.4,43 They are more abundant in tumor-bearing mice than in healthy mice. Blocking T-cell activities is one of the main MDSC functions. MDSC impairs the efficacy of can-cer vaccines by directly effecting dendritic cell antigen presenta-tion and T-cell activapresenta-tion.32 Therefore, in the combination group, the reduced MDSCs caused by CUR–PEG treatment sensitized the CTL response when immune cells encountered with tumor antigens presented by the vaccine and restored the immune- stimulating environment in the immune organs. In the combina-tion treatment group, CUR–PEG played a critical role in enhancing the CD8+ T-cytotoxic killing and facilitated IFN-γ production, which resulted in a strong adaptive immune response.16,19,40 The more effector T cells that proliferate and circulate in the body, the more they can infiltrate the tumor tissues for tumor cell killing.
In the tumor microenvironment, STAT3 played a central role in crosstalk between cancer and immune cells.41 Activated STAT3 not only stimulates proteins that are critical for tumor proliferation and survival, including cyclin D1, BCL-X, MYC, and survivin,44,45 but also acts as an important molecule that mediates immune sup-pression in local tumor tissues. The constitutively activated STAT3 in tumor tissue upregulates the expression of tumor-derived fac-tors, including IL-6 and IL-10,46 which are both STAT3 activating and immunosuppressive. These factors, in turn, promote STAT3 signaling in Treg cells, MDSCs, and tolerogenic dendritic cells in the tumor microenvironment, which subsequently produce more downstream mediators such as Foxp, IL-6, IL-10, and vascular endothelial growth factor,47,48 creating an efficient “feedforward” mechanism41 to guarantee prolonged activation of STAT3 both in tumor cells and in immune cells. Inhibiting STAT3 activity should block the feedforward link as well as promote the expression of several proinflammatory cytokines and chemokines. Therefore, inhibiting the STAT3 pathway in tumor cells helped reverse the suppressed tumor microenvironment13,18,43,46,49 and can result in enhanced antitumor effect. In our case, the vaccine by itself could not downregulate STAT3 because of the immunosuppressive envi-ronment in the late-stage tumor model. In the drug-only treat-ment group, CUR–PEG decreased the levels of IL-6 and CCL2 in
the local tumor tissue but could not increase the proinflamma-tory cytokines such as IFN-γ and TNF-α, due to the insufficient CD8+ T-cell infiltration. So, it was not able to effectively inhibit the STAT3 pathway in vivo. Meanwhile, in the combination group, the more CD8+ T cells were generated and infiltrated to the tumor tissue, the more proinflammatory mediators (IFN-γ, IL-2, and TNF-α) were produced. Within the decreased level of immuno-suppressive factors as well as the elevated level of proinflamma-tory cytokines, the STAT3 pathway can be effectively abrogated. The downregulated STAT3, in turn, resulted in further activation of tumor antigen–specific CD8+ T cells in vivo, subsequently lead-ing to a potent antitumor activity.
From all of the above analyses, we know that mice treated with the Trp2 vaccine can induce effective tumor-specific cytotoxic T cells even in a late-stage tumor model and that these cells can infiltrate into the tumor microenvironment. When the tumor microenvironment was immunosuppressive, cytotoxic T-cell– mediated killing was largely abrogated. With the help of CUR–PEG micelles, the combination therapy could block STAT3 activation in the local tumor tissue by downregulating the immunosup-pressive factors, including IL-6, CCL2, MDSCs, and Treg cells, which can in turn facilitate CD8+ T-cell infiltration. Additionally, CUR–PEG could also downregulate the MDSCs in the immune organs such as the spleen, which could augment the vaccine activ-ity by producing more cytotoxic T cells. This would subsequently enhance the infiltrating cytotoxic T-cell numbers in a feedforward manner. CUR–PEG could also directly kill tumor cells through an apoptotic pathway, facilitating tumor antigen presentation. Lastly, CUR–PEG micelles accumulated in the tumor tissue could reduce angiogenesis, creating an immune-responsive microenviron-ment. So, with the help of the vaccine, CUR–PEG was capable of lowering the antigen threshold, enhancing antigen presentation, and increasing T-cell accumulation within the tumor, creating an immune-responsive tumor microenvironment. With such a dynamic interaction, the combination therapy achieved an effec-tive antitumor performance.
In conclusion, CUR–PEG micelles improved therapeutic effi-cacy of a Trp2–LCP vaccine by reducing the MDSCs, Treg cells, IL-6, CCL2, and significantly reducing the STAT3 pathway as well as increasing the production of CTL and IFN-γ together with an improved cytotoxic T-cell response. Most importantly, this approach achieved a dramatically enhanced antitumor effect for the combination therapy for the late-stage melanoma, without causing any detectable side effects. The current study documents the superior value of CUR–PEG as a useful anticancer formula-tion of CUR and its activity to augment the activity of a cancer vaccine.
MATERIALS AND METHODS
complex class I molecule-H-2Kb restricted peptides, purity 98%,
oval-bumin (OVA) (SIINFEKL, MW 1773), Trp2 (SVYDFFVWL, MW1175), and phosphoserine-modified Trp2 peptide (pSpSSSVYDFFVWL, MW1626) were synthesized by Peptide 2.0 (Chantilly, VA). CpG ODN 1826 (5′-TCCATGACGTTCCTGACGTT-3′) was ordered from Sigma-Aldrich. CUR was purchased from Santa Cruz (Dallas, TA). PEG methyl ether acrylate, 3-mercaptopropionic acid, and 4-dimethylaminopyridine were purchased from Sigma-Aldrich. All other chemicals were purchased from Sigma-Aldrich if not specifically mentioned.
Cell line, mice, and antibodies. Murine B16F10 melanoma cell line, which is syngeneic with C57BL/6 mice, was purchased from American Type Culture Collection (ATCC) and cultured in Dulbecco’s Modified Eagle’s medium, supplemented with 10% fetal bovine serum, 100 U/ml penicillin, and 100 µg/ml streptomycin (Invitrogen, Carlsbad, CA). Six- to eight-week old female C57BL/6 mice were obtained from Charles River (Bethesda, MD). Animals were raised in the Center for Experimental Animals (an AAALAC accredited experimental animal facility) in the University of North Carolina (UNC) at Chapel Hill. All animal handling procedures were approved by the UNC at Chapel Hill’s Institutional Animal Care and Use Committee.
Primary antibodies used for western blot analysis and immunostaining included anti-α-SMA, glyceraldehyde 3-phosphate dehydrogenase, anti-CD31 polyclonal antibody (Abcam, Cambridge, MA), anti- p-STAT3 monoclonal antibody, and anti-STAT3 antibody (Cell Signaling, Cambridge, MA). Fluorescent primary antibodies including fluorescein isothiocyanate (FITC)-conjugated anti-mouse CD8α, FITC-conjugated anti-mouse CD4, PE-conjugated anti-mouse FOXP3, FITC-conjugated anti-mouse CD11b, and PE-conjugated anti-mouse Gr were obtained from BD Biosciences (San Jose, CA). Secondary antibodies used for western blot analysis included bovine anti-rabbit IgG–horseradish peroxidase and rabbit anti-mouse IgG–horseradish peroxidase purchased from Santa Cruz. Secondary antibody used for immunofluorescence staining Alexa Fluor 647 conjugated anti-rabbit was purchased from Abcam. Analysis was performed on a FACSCalibur flow cytometer and analyzed using Cell Quest software (BD Biosciences).
Synthesis of CUR–PEG and the formation characterization of micelles. CUR–PEG was synthesized as previously reported.25 In brief, PEG methyl
ether acrylate, 3-mercaptopropionic acid, and trace amount of trimeth-ylamine were mixed in anhydrous tetrahydrofuran. After mixing, these components were stirred for 24 hours at room temperature. After PEG oligomer precipitation, it was mixed with N,N′-dicyclohexylcarbodiimide, CUR, and 4-dimethylaminopyridine in anhydrous tetrahydrofuran con-taining a trace amount of trimethylamine. Twenty-four hours after stir-ring, the solution was filtered to remove dicyclohexylurea byproducts. The filtrate was then precipitated again with excess amount of anhydrous ether followed by further repeated purification steps. The purified final product was directly dissolved in sterile 5% glucose and injected into the C57BL/6 mice by tail vein injection. The morphology of CUR–PEG micelles was observed by transmission electron microscopy (JEOL 100CX II TEM; Tokyo, Japan). The mean diameters and zeta potentials of the micelles were measured by dynamic light scattering, Malvern Zetasizer Nano ZS machine (Malvern, Worcestershire, UK).
Preparation of LCP-based peptide vaccine NP. The LCP–Trp2 vaccine NP was prepared in a water-in-oil microemulsion method as previously described.30 In brief, 600 µl of Na
2HPO4 (12.5 mmol/l, pH 9.0) and 200
µl of DOPA (20 mmol/l) were dispersed in 20 ml of a Cyclohexane/Igepal CO-520 (70:30, v/v) reverse oil solution for the formation of a well-dis-persed phosphate phase. At the same time, 600 µl of CaCl2 (2.5 mol/l) containing both phospho-Trp2 peptide and CpG ODN was dispersed in another 20 ml reverse oil solution to obtain the calcium phase. After sepa-rately stirring for 20 minutes, the two oil phases were immediately mixed together and stirred for another 30 minutes at room temperature. Then,
40 ml of ethanol was added in order to precipitate the calcium phosphate cores. Calcium phosphate cores were subsequently collected by centrifu-gation (8,582 rpm × 15–20 minutes) and washed twice with ethanol. The pellets were dissolved again in chloroform. For final particle preparation, the cores were mixed with 100 µl of DOTAP, 100 µl of cholesterol, 10 µl of DSPE–PEG-2000, and 10 µl of DSPE–PEG–mannose. After chloroform evaporation, the LCP-based vaccine was rehydrated in 100 µl of 5% glucose solution.
Biodistribution assay. Forty milligrams of CUR–PEG was i.v. injected into the tail vein of the mice. Equivalent amount of free CUR in dimethyl sulf-oxide was i.p. injected into the mice due to its hydrophobic property. After 1, 4, and 24 hours, mice were euthanized and the heart, liver, spleen, lungs, kidneys, and tumor tissues were collected. CUR was extracted by incu-bating 100 mg of tissue in 1 ml methanol overnight. The concentrations of extracted CUR in different organs and the plasma were determined using fluorescence spectroscopy. The excitation wavelength was set at 485 nm, while the emission wavelength was set at 575 nm.
Tumor growth inhibition study. On day 0, 6- to 8-week-old female C57BL/6 mice were subcutaneously inoculated with 2 × 10⁵ B16F10 cells
on their lower flank. For late vaccination studies, the LCP NP vaccine in 5% glucose was subcutaneously injected into the contralateral side of the lower flank on days 12 and 16, respectively. For tumor growth inhibi-tion studies, tumor-bearing mice were i.v. administrated with 40 mg/kg of CUR–PEG every other day for a total five injections once tumor volume reached 150 mm3. For combination therapy, mice received both the
vac-cine and repeated injections of CUR–PEG. Tumor sizes were measured every other day using digital calipers (Thermo Fisher Scientific, Pittsburgh, PA) and tumor volume was calculated using the equation: volume = 0.5 × length × width2. All mice were euthanized on day 23.
CTL assay (in vivo). Seven days after the second vaccination, a CTL response assay was performed following the published method with slight modifications.5 Briefly, lymphocytes from naive C57BL/6 mice were
sepa-rated from the spleens. The single lymphocytes were immediately pulsed with either 10 µmol/l of control peptide (OVA) or tumor-associated antigen peptide (Trp2) in complete RPMI 1640 medium at 37 °C for 1.5 hours. Both kinds of peptide-pulsed lymphocytes were then stained with 2 µmol/l of PKH-26 strictly according to the manufacturer’s manual. OVA peptide–pulsed and Trp2 peptide–pulsed cells were then labeled with 0.5 and 5 µmol/l of carboxyfluorescein succinimidyl ester (CFSE), respec-tively. Incubating for 15 minutes, equal numbers of CFSElow cells (OVA
control peptide pulsed) and CFSEhigh cells (Trp2 peptide pulsed) were
mixed together and i.v. injected into the four groups of treated mice. After 16–18 hours, splenocytes were collected again from the vaccinated or control mice and subjected to flow cytometry analysis. The numbers of CFSElow cells and CFSEhigh cells were calculated and the in vivo
Trp2-specific lysis percentage was enumerated according to the equation below.
% Specific lysis = OVA Trp2
OVA 100%
× −
× ×
x x
(
)
(
)
ELISPOT assay for IFN-γ production restimulation of spleen cells for vac-cinated or untreated mice was performed as described previously.30 In
brief, 7 days after the second vaccination, spleens were harvested and sepa-rated into single-cell suspensions in a sterile condition. Following the BD enzyme-linked immunosorbent spot (ELISPOT) assay instructions, cells were seeded at 2 × 10⁵ per well in a capture antibody coated 96-well plate.
Flow cytometry assay. Tumor-infiltrating and splenocyte immune lym-phocytes were quantitatively analyzed by flow cytometry. In brief, tissues were harvested and digested with collagenase A and DNAase at 37 °C for 40–50 minutes. After red blood cell lysis, cells were dispersed with 1 ml of phosphate-buffered saline. For intracellular cytokine staining, the cells from the tissues were penetrated with penetration buffer (BD, Franklin Lakes, NJ) following the manufacturer’s instructions. Different immune lymphocytes (5 × 10⁶/ml) were stained with the fluorescein-conjugated
antibodies mentioned in the previous section.
Quantitative real-time PCR assay. Total RNA was extracted from the B16F10 tumor tissues using an RNeasy kit (Qiagen, Valencia, CA). cDNA was reverse-transcribed using the First-Strand Synthesis System for real-time PCR. One hundred nanograms of cDNA was amplified with the Taqman Universal Probes Supermix system (Bio-Rad, Hercules, CA). All the mouse-specific primers for real-time PCR reactions are listed in Table 1. Mouse β-actin was used as the endogenous control. Reactions were con-ducted using the 7500 Real-Time PCR System and the data were analyzed with Image J.
Immunofluorescence staining. After the deparaffinizing step, antigen retrieval, and permeabilization, tissue sections were blocked in 1% bovine serum albumin at room temperature for 1 hour. Primary antibodies con-jugated with fluorophores (BD) were incubated overnight at 4 °C and the nuclei were counterstained with 4',6-diamidino-2-phenylindole containing mounting medium (Vector Laboratories, Burlingame, CA). All antibod-ies were diluted after optimization. Images were taken using fluorescence microscopy (Nikon, Tokyo, Japan). Three randomly selected microscopic fields were quantitatively analyzed using Image J software.
Western blot analysis. Tumor tissues from four different groups were harvested and the total proteins were extracted using radioimmunopre-cipitation assay lysis buffer (Sigma). After homogenization, the total pro-tein concentrations were determined using a BCA propro-tein assay system (Thermo, Rockford, IL) according to the manufacturer’s instruction. For the gel running step, the same amount of proteins were diluted in the sam-ple-loading buffer and heated at 95 °C for 5 minutes. After separation by NuPAGE Bis-Tris Gels (Invitrogen, Grand Island, NY), proteins were trans-ferred to polyvinylidene fluoride membranes (Millipore, Billerica, MA) by electrophoresis. Then the protein-loaded membranes were blocked by 5% nonfat dry milk (Santa Cruz) for 1 hour at room temperature and incubated with primary antibodies including p-STAT3, STAT3, and glyceraldehyde 3-phosphate dehydrogenase (Cell Signaling) overnight at 4 °C. On the sec-ond day, the membranes were incubated in horseradish peroxidase–con-jugated secondary antibodies for 1 hour at room temperature. The Pierce ECL Western Blotting Substrate kit (Thermo) was used to detect the protein bands. The relative amounts of proteins were quantified using Image J. TUNEL assay. TUNEL assays were performed using a DeadEnd Fluorometric TUNEL System (Promega, Madison, WI) for the detec-tion of apoptotic tumor cells in the paraffin-embedded tumor tissues. Cells that were stained with FITC (green) fluorescence were defined as TUNEL-positive cells. Slides were coverslipped with Vectashield mount-ing media with 4',6-diamidino-2-phenylindole (Vector Laboratories).
TUNEL-positive cells were monitored using fluorescence microscopy (Nikon). Three randomly selected microscopic fields were quantitatively analyzed using Image J.
H&E morphology evaluation and blood chemistry analysis. The untreated mice, vaccinated mice, mice that were i.v. injected with CUR–PEG every other day for a total five doses, and the vaccine/CUR–PEG-cotreated mice were all subjected to a toxicity assay. At the end of the treatments, blood was collected from the different treatment groups and centrifuged at 4,000 rpm for 5 minutes in order to obtain the serum. Creatinine, blood urea nitrogen, serum aspartate aminotransferase, and alanine amino-transferase were assayed as indicators of renal and liver function. Organs including the heart, liver, spleen, lungs, and kidneys were collected and fixed for hematoxylin and eosin (H&E) staining by UNC histology facility to evaluate the organ-specific toxicity.
Statistical analysis. A two-tailed Student’s t-test or a one-way analysis of variance were performed when comparing two groups or larger than two groups, respectively. Statistical analysis was performed using Prism 5.0 Software. Differences were considered to be statistically significant if the
P value was less than 0.05.
SUPPLEMENTARY MATERIAL
Figure S1. Characterizations of CUR–PEG micelles and B16F10 cell uptake.
Figure S2. H&E morphology evaluation and serum biochemical value analysis.
Figure S3. Changes of spleen MDSC after various treatments.
ACKNOWLEDGMENTS
The authors graciously thank NIH for funding (grants CA149363, CA149387, CA151652, and DK100664). The authors declare no com-peting financial interest.
REFERENCES
1. Blattman, JN and Greenberg, PD (2004). Cancer immunotherapy: a treatment for the masses. Science305: 200–205.
2. Haanen, JB (2013). Immunotherapy of melanoma. EJC Suppl11: 97–105. 3. Vasievich, EA and Huang, L (2011). The suppressive tumor microenvironment: a
challenge in cancer immunotherapy. Mol Pharm8: 635–641.
4. Rabinovich, GA, Gabrilovich, D and Sotomayor, EM (2007). Immunosuppressive strategies that are mediated by tumor cells. Annu Rev Immunol25: 267–296. 5. Xu, Z, Wang, Y, Zhang, L and Huang, L (2014). Nanoparticle-delivered transforming
growth factor-β siRNA enhances vaccination against advanced melanoma by modifying tumor microenvironment. ACS Nano8: 3636–3645.
6. Draghiciu, O, Lubbers, J, Nijman, HW and Daemen, T (2015). Myeloid derived suppressor cells-An overview of combat strategies to increase immunotherapy efficacy. Oncoimmunology4: e954829.
7. Talmadge, JE and Gabrilovich, DI (2013). History of myeloid-derived suppressor cells. Nat Rev Cancer13: 739–752.
8. Ozao-Choy, J, Ma, G, Kao, J, Wang, GX, Meseck, M, Sung, M et al. (2009). The novel role of tyrosine kinase inhibitor in the reversal of immune suppression and modulation of tumor microenvironment for immune-based cancer therapies. Cancer Res69: 2514–2522.
9. Molavi, O, Ma, Z, Hamdy, S, Lai, R, Lavasanifar, A and Samuel, J (2008). Synergistic antitumor effects of CpG oligodeoxynucleotide and STAT3 inhibitory agent JSI-124 in a mouse melanoma tumor model. Immunol Cell Biol86: 506–514.
10. Yu, H, Pardoll, D and Jove, R (2009). STATs in cancer inflammation and immunity: a leading role for STAT3. Nat Rev Cancer9: 798–809.
11. Lee, H, Pal, SK, Reckamp, K, Figlin, RA and Yu, H (2011). STAT3: a target to enhance antitumor immune response. Curr Top Microbiol Immunol344: 41–59.
12. Yu, H, Lee, H, Herrmann, A, Buettner, R and Jove, R (2014). Revisiting STAT3 signalling in cancer: new and unexpected biological functions. Nat Rev Cancer14: 736–746. 13. Tu, SP, Jin, H, Shi, JD, Zhu, LM, Suo, Y, Lu, G et al. (2012). Curcumin induces the
differentiation of myeloid-derived suppressor cells and inhibits their interaction with cancer cells and related tumor growth. Cancer Prev Res (Phila)5: 205–215. 14. Mondal, G, Barui, S, Saha, S and Chaudhuri, A (2013). Tumor growth inhibition
through targeting liposomally bound curcumin to tumor vasculature. J Control Release
172: 832–840.
15. Hayakawa, T, Sugiyama, J, Yaguchi, T, Imaizumi, A and Kawakami, Y (2014). Enhanced anti-tumor effects of the PD-1/PD-L1 blockade by combining a highly absorptive form of NF-kB/STAT3 inhibitor curcumin. J Immunother Cancer2: P210.
16. Anand, P, Sundaram, C, Jhurani, S, Kunnumakkara, AB and Aggarwal, BB (2008). Curcumin and cancer: an “old-age” disease with an “age-old” solution. Cancer Lett
267: 133–164. Table 1 Primers for real-time PCR assay
Primers Applied Biosystems/Ref.
Mouse IFN-γ Mm01168134_m1
Mouse IL-6 Mm00446190_m1
Mouse TNF-α Mm00443260_g1
Mouse CCL2 Mm00441242_m1
17. Wilken, R, Veena, MS, Wang, MB and Srivatsan, ES (2011). Curcumin: a review of anti-cancer properties and therapeutic activity in head and neck squamous cell carcinoma. Mol Cancer10: 12.
18. Jagetia, GC and Aggarwal, BB (2007). “Spicing up” of the immune system by curcumin. J Clin Immunol27: 19–35.
19. Singh, M, Ramos, I, Asafu-Adjei, D, Quispe-Tintaya, W, Chandra, D, Jahangir, A et al. (2013). Curcumin improves the therapeutic efficacy of Listeria(at)-Mage-b vaccine in correlation with improved T-cell responses in blood of a triple-negative breast cancer model 4T1. Cancer Med2: 571–582.
20. Luo, F, Song, X, Zhang, Y and Chu, Y (2011). Low-dose curcumin leads to the inhibition of tumor growth via enhancing CTL-mediated antitumor immunity. Int Immunopharmacol11: 1234–1240.
21. Lu, Y, Ding, N, Yang, C, Huang, L, Liu, J and Xiang, G (2012). Preparation and in vitro evaluation of a folate-linked liposomal curcumin formulation. J Liposome Res22: 110–119.
22. Anand, P, Nair, HB, Sung, B, Kunnumakkara, AB, Yadav, VR, Tekmal, RR et al. (2010). Design of curcumin-loaded PLGA nanoparticles formulation with enhanced cellular uptake, and increased bioactivity in vitro and superior bioavailability in vivo. Biochem Pharmacol79: 330–338.
23. Lin, YL, Liu, YK, Tsai, NM, Hsieh, JH, Chen, CH, Lin, CM et al. (2012). A Lipo-PEG-PEI complex for encapsulating curcumin that enhances its antitumor effects on curcumin-sensitive and curcumin-resistance cells. Nanomedicine8: 318–327.
24. Bisht, S, Mizuma, M, Feldmann, G, Ottenhof, NA, Hong, SM, Pramanik, D et al. (2010). Systemic administration of polymeric nanoparticle-encapsulated curcumin (NanoCurc) blocks tumor growth and metastases in preclinical models of pancreatic cancer. Mol Cancer Ther9: 2255–2264.
25. Tang, H, Murphy, CJ, Zhang, B, Shen, Y, Sui, M, Van Kirk, EA et al. (2010). Amphiphilic curcumin conjugate-forming nanoparticles as anticancer prodrug and drug carriers: in vitro and in vivo effects. Nanomedicine (Lond)5: 855–865.
26. Murphy, CJ, Tang, H, Van Kirk, EA, Shen, Y and Murdoch, WJ (2012). Reproductive effects of a pegylated curcumin. Reprod Toxicol34: 120–124.
27. Torchilin, V (2011). Tumor delivery of macromolecular drugs based on the EPR effect. Adv Drug Deliv Rev63: 131–135.
28. Maeda, H, Wu, J, Sawa, T, Matsumura, Y and Hori, K (2000). Tumor vascular permeability and the EPR effect in macromolecular therapeutics: a review. J Control Release65: 271–284.
29. Fang, J, Nakamura, H and Maeda, H (2011). The EPR effect: unique features of tumor blood vessels for drug delivery, factors involved, and limitations and augmentation of the effect. Adv Drug Deliv Rev63: 136–151.
30. Xu, Z, Ramishetti, S, Tseng, YC, Guo, S, Wang, Y and Huang, L (2013). Multifunctiona nanoparticles co-delivering Trp2 peptide and CpG adjuvant induce potent cytotoxic T-lymphocyte response against melanoma and its lung metastasis. J Control Release
172: 259–265.
31. Wen, YJ, Min, R, Tricot, G, Barlogie, B and Yi, Q (2002). Tumor lysate-specific cytotoxic T lymphocytes in multiple myeloma: promising effector cells for immunotherapy. Blood99: 3280–3285.
32. Pan, PY, Ozao, J, Zhou, Z and Chen, SH (2008). Advancements in immune tolerance. Adv Drug Deliv Rev60: 91–105.
33. Stetson, DB and Medzhitov, R (2006). Type I interferons in host defense. Immunity25: 373–381.
34. Burkholder, B, Huang, RY, Burgess, R, Luo, S, Jones, VS, Zhang, W et al. (2014). Tumor-induced perturbations of cytokines and immune cell networks. Biochim Biophys Acta1845: 182–201.
35. Bracci, L, Schiavoni, G, Sistigu, A and Belardelli, F (2014). Immune-based mechanisms of cytotoxic chemotherapy: implications for the design of novel and rationale-based combined treatments against cancer. Cell Death Differ21: 15–25.
36. Mantovani, A, Sica, A and Locati, M (2005). Macrophage polarization comes of age. Immunity23: 344–346.
37. Schwartz, YSh and Svistelnik, AV (2012). Functional phenotypes of macrophages and the M1-M2 polarization concept. Part I. Proinflammatory phenotype. Biochemistry Mosc77: 246–260.
38. Davis, MJ, Tsang, TM, Qiu, Y, Dayrit, JK, Freij, JB, Huffnagle, GB et al. (2013). Macrophage M1/M2 polarization dynamically adapts to changes in cytokine microenvironments in Cryptococcus neoformans infection. MBio4: e00264–e00213.
39. Whiteside, TL (2008). The tumor microenvironment and its role in promoting tumor growth. Oncogene27: 5904–5912.
40. Chang, YF, Chuang, HY, Hsu, CH, Liu, RS, Gambhir, SS and Hwang, JJ (2012). Immunomodulation of curcumin on adoptive therapy with T cell functional imaging in mice. Cancer Prev Res (Phila)5: 444–452.
41. Yu, H, Kortylewski, M and Pardoll, D (2007). Crosstalk between cancer and immune cells: role of STAT3 in the tumour microenvironment. Nat Rev Immunol7: 41–51. 42. Kunnumakkara, AB, Anand, P and Aggarwal, BB (2008). Curcumin inhibits
proliferation, invasion, angiogenesis and metastasis of different cancers through interaction with multiple cell signaling proteins. Cancer Lett269: 199–225. 43. Gajewski, TF, Schreiber, H and Fu, YX (2013). Innate and adaptive immune cells in the
tumor microenvironment. Nat Immunol14: 1014–1022.
44. Bowman, T, Broome, MA, Sinibaldi, D, Wharton, W, Pledger, WJ, Sedivy, JM et al. (2001). Stat3-mediated Myc expression is required for Src transformation and PDGF-induced mitogenesis. Proc Natl Acad Sci USA98: 7319–7324.
45. Gritsko, T, Williams, A, Turkson, J, Kaneko, S, Bowman, T, Huang, M et al. (2006). Persistent activation of stat3 signaling induces survivin gene expression and confers resistance to apoptosis in human breast cancer cells. Clin Cancer Res12: 11–19.
46. Marotta, LL, Almendro, V, Marusyk, A, Shipitsin, M, Schemme, J, Walker, SR et al. (2011). The JAK2/STAT3 signaling pathway is required for growth of CD44+CD24
-stem cell-like breast cancer cells in human tumors. J Clin Invest121: 2723–2735. 47. Sumimoto, H, Imabayashi, F, Iwata, T and Kawakami, Y (2006). The BRAF-MAPK
signaling pathway is essential for cancer-immune evasion in human melanoma cells. J Exp Med203: 1651–1656.
48. Zheng, SG, Wang, J, Wang, P, Gray, JD and Horwitz, DA (2007). IL-2 is essential for TGF-beta to convert naive CD4+CD25- cells to CD25+Foxp3+ regulatory T cells and for
expansion of these cells. J Immunol178: 2018–2027.