ANALYZING GLOBAL CYBER ATTACK CORRELATES THROUGH AN OPEN DATABASE
A Thesis presented to
the Faculty of California Polytechnic State University, San Luis Obispo
In Partial Fulfillment
of the Requirements for the Degree Master of Science in Computer Science
by Brady Aiello
c 2018 Brady Aiello
COMMITTEE MEMBERSHIP
TITLE: Analyzing Global Cyber Attack Correlates Through an Open Database
AUTHOR: Brady Aiello
DATE SUBMITTED: June 2018
COMMITTEE CHAIR: Bruce Debruhl, Ph.D.
Associate Professor of Computer Science
COMMITTEE MEMBER: Foaad Khosmood, Ph.D.
Associate Professor of Computer Science
COMMITTEE MEMBER: Franz Kurfess, Ph.D.
ABSTRACT
Analyzing Global Cyber Attack Correlates Through an Open Database Brady Aiello
ACKNOWLEDGMENTS
TABLE OF CONTENTS
Page
LIST OF TABLES . . . viii
LIST OF FIGURES . . . ix
CHAPTER 1 Introduction . . . 1
2 Background . . . 6
3 The Cyber Attack Database Implementation . . . 11
3.1 Open Data on Cyber Attacks . . . 11
3.2 Hackmageddon . . . 12
3.3 Making the Spreadsheets SQL-Friendly . . . 15
3.4 Creating the Cyber Attack Database . . . 16
3.5 Inserting The Data . . . 16
3.6 Querying The Data . . . 18
3.7 Analysis Overview . . . 19
4 Capturing Socio-economic Data . . . 23
4.1 The World Happiness Report . . . 23
5 Results . . . 28
5.1 By Country . . . 30
5.1.1 Trends . . . 30
5.1.2 Correlates . . . 36
5.2 By Sector . . . 42
5.3 Socioeconomic Factors . . . 51
5.4 Attack Classes . . . 54
5.5 Attack Vectors . . . 56
5.6 Apriori Results . . . 57
6 Discussion . . . 63
6.1 Countries . . . 63
6.2 Sectors . . . 65
6.4 Attack Classes . . . 69
6.5 Attack Vectors . . . 69
7 Conclusion . . . 70
BIBLIOGRAPHY . . . 73
LIST OF TABLES
Table Page
3.1 The “Attacks” Spreadsheet . . . 14
3.2 The “attacks” schema . . . 17
3.3 Total Attacks By Country . . . 21
3.4 Interpreting the Pearson correlation coefficient . . . 22
4.1 Annual GDP Correlates of Total Cyber Attack Volume Received 2014-2017 . . . 26
5.1 Target Country to Target Country Correlation . . . 43
5.2 Most targeted sectors . . . 45
5.3 Cross Industry Attack Correlations . . . 59
5.4 Socio-Economic Correlates of Total Cyber Attack Volume Received 60 5.5 Socio-Economic Correlates of Total Cyber Attack Volume Received Excluding US . . . 61
5.6 Attack Types . . . 62
6.1 Change in Attacks By Sector . . . 66
6.2 Types of Attacks Against Individuals . . . 67
6.3 Types of Attacks Against Industry . . . 67
6.4 Types of Attacks Against Governments . . . 68
A.1 Target Country to Target Country Correlation . . . 82
A.2 Apriori Rules Associations 1 to * . . . 90
A.3 Apriori Rules Associations 2 to * . . . 91
LIST OF FIGURES
Figure Page
1.1 IoT Device Growth . . . 3
3.1 Attacks as a Pandas dataframe . . . 18
5.1 Total Attacks Timeline with Rolling Average . . . 31
5.2 US Attacks Timeline . . . 32
5.3 Attacks by Country Timeline — Timeline of cyber attack volume by country for top 5 victims. . . 32
5.4 Attacks Timeline for Great Britain and India . . . 33
5.5 Attacks Timeline for Canada and Australia . . . 34
5.6 Attacks Timeline for Russia and Israel . . . 34
5.7 Average Attacks / Month US . . . 35
5.8 Average Attacks / Month Great Britain . . . 35
5.9 Average Attacks / Month for India and Pakistan . . . 36
5.10 Average Attacks / Month for Canada and Australia . . . 36
5.11 Attacks Timeline for Turkey and the Phillipines . . . 38
5.12 Attacks Timeline for Canada and Pakistan . . . 39
5.13 Attacks Timeline for Japan and China . . . 39
5.14 Attacks Timeline for India and Pakistan . . . 40
5.15 Attacks Timeline for Italy and Germany . . . 41
5.16 Attacks Timeline for the US and China . . . 41
5.17 Attacks Timeline for Industry and Org Sectors . . . 44
5.18 Attacks Timeline for>1 Label . . . 44
5.19 ISIC Compliant Target Classes . . . 46
5.20 Attacks Timeline for Attacks Against Individuals and Industry Sectors 47 5.21 Attacks Timeline for Individuals and Health Care . . . 49
5.22 Attacks Timeline for Government and Industry Sectors . . . 49
5.23 Attacks Timeline for Government and Individuals . . . 50
Chapter 1 INTRODUCTION
According to a 2017 study by Cybersecurity Ventures:
Cybercrime is the greatest threat to every company in the world, and one of the biggest problems with mankind. The impact on society is reflected in the numbers.
Last year, Cybersecurity Ventures predicted that cybercrime will cost the world $6 trillion annually by 2021, up from $3 trillion in 2015. This represents the greatest transfer of economic wealth in history, risks the incentives for innovation and investment, and will be more profitable than the global trade of all major illegal drugs combined [57].
According to a study by Hiscox Insurance on cyber attacks in 2017 across the US, Great Britain, Spain, Germany, and the Netherlands, involving 4,103 organizations in private and public sectors, the average annual cost due to cyber attacks to a single business is $229,000, and %73 of organizations were not prepared for a cyber attack [47]. For organizations with more than 1,000 employees, the average annual cost of total cyber incidents was $356,000 in Spain, and $1.05M in the US [47]. The largest firms in the US lost $25M annually to cyber crime, while the largest firms in the Great Britain and Germany lost $20M [47]. Businesses with fewer than 100 employees lost between $24,000 on average in Spain to $63,000 on average in Germany [47]. The greatest cost for a single incident ranged from $800,000 in Spain to $5M in Germany, and the US in the middle at $2M [47]. Cyber crime presents a substantial and growing threat to both the private and public sector.
of May 2017 affected 300,000 machines, and cost $4B [47]. The attack, carried out by North Korea, disabled the machines of users all around the world, promising to free them for a ransom, an instance known as “ransomware” [34]. The attacks hit hospitals in Great Britain especially hard, impeding medical work, and risking lives [34]. In September 2017, Equifax experienced a data breach exposing the information of 145 million Americans, and some citizens of Great Britain and Canada, exposing their Social Security numbers, dates of birth, driver’s license numbers, driver’s license dates and states, home addresses, and credit card numbers [29].
As computers become more ingrained in human life, cyber attacks even have the capacity to kill. In 2017, a pacemaker model implanted in 465,000 people was recalled over concerns about holes in its security that could let a hacker drain the battery or alter the heart’s rhythm arbitrarily [45]. In July 2017, a security researcher demon-strated how a popular internet-connected car wash system could be commandeered from anywhere in the world to attack anyone inside the car wash [65]. Full adminis-trator privileges were granted by entering the default password “12345” [65].
destroyed 1/5 of its nuclear centrifuges by spinning them out of control, and went undetected for 5 years [31] [67]. Politically motivated attacks against public infras-tructure pose an imminent economic and physical threat to all people.
Figure 1.1: Projection of Worldwide Total M2M devices, created by Statista.
of IoT applications are not tested for vulnerabilities [41]. This is understandable, as an influx of countless cheap IoT devices streaming from many manufacturers means that there is not much funding available for security testing, and that there is a litany of development platforms of varying security.
It is clear that Cyber crime is a growing and vastly underestimated threat. As the world puts its businesses, personal lives, personally identifiable information, and credit card and banking information online, cyber crime is more likely to affect everyone, not only businesses and governments. Given the growing prevalence of cyber attacks, it behooves all internet users to understand the large historical trends of previous cyber attacks, in the hope of predicting future cyber attack behavior.
Chapter 2 BACKGROUND
In this chapter I discuss previous works similar to this thesis, what they teach, and how my thesis stands apart from rest. Most previous work on global trends in cyber attacks does not suffice, as it falls into one of the following categories: it discusses only a subset of cyber attacks, is not statistically rigorous, or does not use an open data source. No previous work has generated a cyber attack database for public use as mine does.
In Debeck’s, 2011 MS cybersecurity thesis, “The Correlates of Cyber Warfare: A Database for the Modern Era”, he discusses the general ignorance and disorganization of data pertaining to cyber attacks, and proposes a worldwide network of routers to track attacks as they occur [37]. This hypothetical system would provide perfect knowledge of the country of origin of any attack, tracking the attack as it passes through various routers. Debeck’s motivation for such a tremendous undertaking is the hope of correlating cyber attacks with political, cultural, and socioeconomic conditions in a way analogous to “The Correlates of War” project which does the same for natural war [1]. This work’s emphasis on a general void of reliable and open cyber attack data, which holds true 7 years after its release, was the original impetus for this thesis. Unlike Debeck, in this thesis, the cyber attack database I create is not a hypothetical one, but actually created from cyber attack data.
role in cyber attacks requires further research. However, Ghandi’s does not statis-tically correlate any socioeconomic factors with cyber attack volume; it is more of a narrative that connects socioeconomic and political headlines with cyber security breaches. Ghandi states that, “the movements of Russian troops in Georgia were correlated with cyber-attacks on the Georgian communications infrastructure and defacement of government websites.” This is believable given the evidence presented, but there is no mathematically derived correlation, which is generally a Pearson-R correlation. Again, Ghandi notes, “[a lack of cyber attacks] seems to reinforce the notion that attacks are strongly positively correlated to political and cultural con-flicts”, without deriving the actual correlation. In general, the work is believable, but of small scope, lacking in statistical rigor, and mostly anecdotal. In contrast, this thesis rigorously quantifies cyber attack volume for various countries, target sectors, types of attacks, and the various correlations between types of cyber attacks, as well with socioeconomic data.
the cyber attacks data source is never revealed. All of these factors make the results difficult to use or rely upon. In contrast, in this thesis I reveal my data source, and open source my work for others to reproduce.
In her 2014 paper, “Global Mapping of Cyber Attacks” Carley does much of what I do in this thesis [33]. She quantifies types of attacks, identifies which countries receive the most cyber attacks, and correlates volume of cyber attacks received with various socioeconomic data. Carley’s analysis is truly an impressive work, and it relies upon her previous work of simply creating a database of cyber attacks [56]. Unfortunately, Carley’s work relies upon closed data. The attack signatures are freely available, but the number of Symantec machines who have experienced an attack, and the IP addresses of those machines, which makes identifying the nation of any particular machine affected possible, are all closed source. This was only possible because Carley and her fellow researchers were granted special access to Symantec’s World Intelligence Network Environment (WINE) Intrusion Prevention System’s (IPS) telemetry data. This real world data sampled from over 10 million machines around the world no doubt allows for the highest quality of data, but it is infeasible for most researchers. Carley also does not analyze temporal changes in attack data at all, and only analyzes attacks from November 2009 - September 2011. In contrast, I only use open data, I analyze temporal and seasonal trends in different types of cyber attacks and their victims, and I analyze cyber attacks from January 2014 - February 2018, a longer and more recent history.
approach to seeing cyber attacks through a socioeconomic lens. I also use Aviles’ data source. However, in this thesis I perform rigorous statistical analysis.
Kumar’s 2016 research paper, “DDoS Cyber-Attacks Network: Who’s Attacking Whom?”, analyzes global trends in DDoS attack behavior [51]. DDoS, or Distributed Denial of Service, is a type of attack in which a machine is overwhelmed by the network requests made by thousands of machines in different geographical locations, causing the victim machine to become unavailable. Using open DDoS data from Dig-ital Attack Map [6], Kumar discovers that, from May 2013 - March 2016, the top 10 victims of DDoS in descending order are the US, China, Peru, France, Canada, Poland, Great Britain, Brazil, Germany, and South Korea. The top 10 DDoS aggres-sors in descending order are China, the US, the Netherlands, Germany, South Korea, Brazil, Great Britain, Russia, France, and Turkey. Kumar notes that the country of the attacker is only known for about 13 of the attacks. It is similar to what I achieve in examining international relationships with respect to cyber attacks. However, as this work only examines DDoS attacks, one of many types of attacks, it is more limited in scope, than my own. I examine all types of cyber attacks, and I analyze many other aspects of cyber attacks than the aggressor country and victim country.
Chapter 3
THE CYBER ATTACK DATABASE IMPLEMENTATION
To organize cyber attack data in a way that is structured, persistent, and easily ac-cessible from a single endpoint, an RDBMS is selected. This SQL solution allows researchers around the world to apply data science to cyber attack trends. All other options are inappropriate. Keeping data in spreadsheets or CSV’s potentially splits data, does not allow complex queries, and does not enforce any rules for field values. Storage in document-oriented NOSQL databases such as Dynamo, Mongo, or Redis would not take advantage of any structure inherent in common data fields. A graph database such as Neo4j would allow for more complex connections made between at-tacks, but development time would be much longer, and because graph databases like Neo4j require learning a niche query language, the end result would not be accessible to the vast majority of cybersecurity researchers.
The implementation of a cyber attacks database is contingent on the available data. Finding reliable structured data on attacks can be very difficult, but we show how it can be done. Then the data is conditioned to fill in missing cells, and make text values more symmetric. Next, the data is transformed to a SQL-friendly version. Lastly, the SQL database is created and populated with the cleaned data.
3.1 Open Data on Cyber Attacks
secu-rity agencies also want to conceal what they know, and could end up exposing their own state-sponsored attacks. So they are also motivated to keep data secret. Most individuals do not have the time or resources to maintain a database of cyber-attacks, which is constantly growing. Hence, most researchers don’t have access to data re-garding the trends in cyber attacks. Past research has required meticulously collected articles from security-oriented news sites, such as in Gandhi’s “Dimensions of Cyber-Attacks”[42]. Other research, such as Kumar’s “Cyber Attacks DDoS Network”[51], has relied on www.ddosmap.com as a data source for understanding DDoS attacks. Still other research, such as Solano’s “Socio-economic factors in cybercrime” [64] and Avile’s “How US Political and Socio-economic Trends Promotes Hacktivist Activity” [25], has used the data from www.hackmageddon.com to analyze larger cyber attack trends. This last option covers many different types of attacks (not only DDoS), is structured, contains enough metadata to make detailed analysis, is semi-open, and saves researchers the trouble of handpicking cyber attack incidents. Therefore, it is the sole cyber attack data source used in this thesis.
3.2 Hackmageddon
The site “Hackmageddon” is the labor of security professional Paolo Passeri [59]. Passeri manually collects the cyber attacks data from following many security news sites, and uploads graphs and charts of them which he uses in a security blog. Users of Hackmageddon can submit an attack, which Passeri will review, and may include in the data at his discretion. To gain access to the original data used on the security blog, this author needed to contact Passeri personally. Thankfully, Passeri freely opens the data to anyone who asks.
analyzing attacks. The fields are as follows: ID, Date, Author, Target, Description, Attack, Target Class, Attack Class, Country, Link, Tags.
1. ID: An integer unique to that half-month file
2. Date: The date the attack was reported
3. Attack: The type of attack (e.g. DDoS)
4. Target Class: The sector targeted.
5. Attack Class: Cyber War, Cyber Crime, Cyber Espionage, or Hacktivism
6. Country: ISO alpha-2 country code (e.g. US)
7. Link: A URL for a new article describing the attack
8. Tags: Important keywords
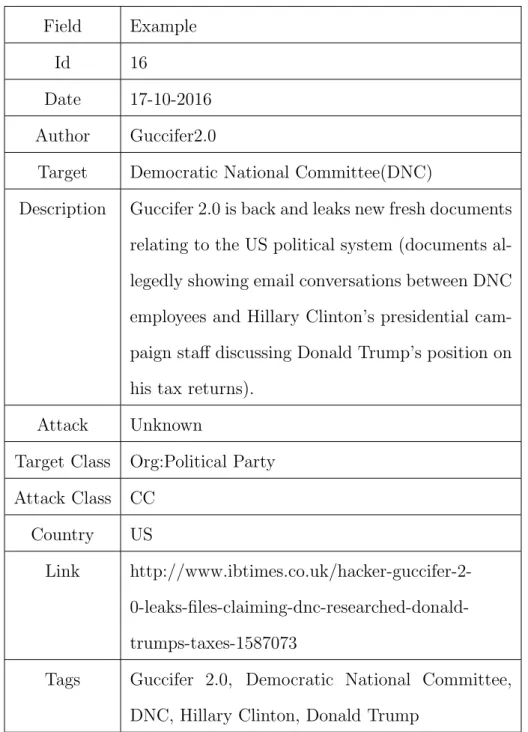
Field Example
Id 16
Date 17-10-2016 Author Guccifer2.0
Target Democratic National Committee(DNC)
Description Guccifer 2.0 is back and leaks new fresh documents relating to the US political system (documents al-legedly showing email conversations between DNC employees and Hillary Clinton’s presidential cam-paign staff discussing Donald Trump’s position on his tax returns).
Attack Unknown
Target Class Org:Political Party Attack Class CC
Country US
Link http://www.ibtimes.co.uk/hacker-guccifer-2- 0-leaks-files-claiming-dnc-researched-donald-trumps-taxes-1587073
Tags Guccifer 2.0, Democratic National Committee, DNC, Hillary Clinton, Donald Trump
Table 3.1: The fields of the “attacks” spreadsheets used by Hackmageddon, and a sample row.
when a large group of consumer that mostly or solely live in a certain country are targeted, though some attacks target a few or many countries. In these cases, the “Country” either lists the ISO alpha-2 country codes of 2-3 countries delimited by spaces or commas, or may simply read, “>1”.
3.3 Making the Spreadsheets SQL-Friendly
the fields in Passeri’s spreadsheets map directly to a MySQL schema, which shall now be described.
3.4 Creating the Cyber Attack Database
After all addressing all the necessary changes to the schema, the creation of the table is as follows:
CREATE TABLE a t t a c k s (
I d INT( 1 1 ) PRIMARY KEY AUTO INCREMENT, AttackDate DATE,
Author VARCHAR( 9 6 ) , T a r g e t VARCHAR( 2 5 6 ) ,
D e s c r i p t i o n VARCHAR( 5 1 2 ) , Attack VARCHAR( 6 4 ) ,
T a r g e t C l a s s VARCHAR( 7 2 ) , A t t a c k C l a s s VARCHAR( 1 6 ) , TargetCountry VARCHAR( 3 2 ) , Link VARCHAR( 2 5 6 ) ,
Tags VARCHAR( 5 1 2 ) ) ;
The table 3.2 shows the schema and a sample row.
3.5 Inserting The Data
Field Type Size Example
Id INT(11) 4 38820
AttackDate DATE 3 2016-10-17
Author VARCHAR 96 Guccifer2.0
Target VARCHAR 256 Democratic National Committee(DNC) Description VARCHAR 512 Guccifer 2.0 is back and leaks new fresh
documents relating to the US political sys-tem (documents allegedly showing email conversations between DNC employees and Hillary Clinton’s presidential cam-paign staff discussing Donald Trump’s po-sition on his tax returns).
Attack VARCHAR 64 Unknown
TargetClass VARCHAR 72 Org:Political Party AttackClass VARCHAR 16 CC
TargetCountry VARCHAR 32 US
Link VARCHAR 256 http://www.ibtimes.co.uk/hacker- guccifer-2-0-leaks-files-claiming-dnc-researched-donald-trumps-taxes-1587073 Tags VARCHAR 512 Guccifer 2.0, Democratic National
Com-mittee, DNC, Hillary Clinton, Donald Trump
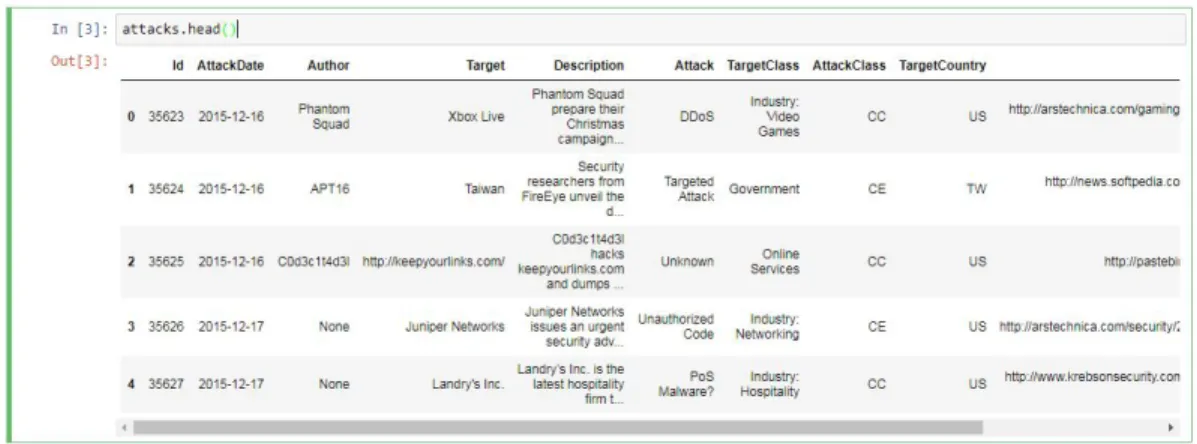
attacks (again, about 1000/yr). Instead of reading the CSV’s directly into a MySQL database, it is read into a “dataframe” object, a data type from the “pandas” python package, for inspection. This lets us double-check that all fields and rows look as they should, before adding them to the table. Pandas also does a nice job of handling null values without an explicit NULL in the cell, as well as escaping quotes and other sequences that are meant to be part of the field entry. After they are inspected, pandas dataframe objects have a niceto sql()method we use for inserting data into the database an entire dataframe at a time.
Figure 3.1: Inspecting the attacks as a pandas dataframe in a Jupyter notebook.
3.6 Querying The Data
SELECT TargetCountry , COUNT(∗) as n u m a t t a c k s FROM a t t a c k s
GROUP BY TargetCountry ORDER BY n u m a t t a c k s DESC;
This produces table 3.3. Often, there are discrepancies in how the TargetCountry or Sector is recorded, so a more flexible query can gather any attack in which ‘US’ appears, which may be in a field such as “US UK”. So actual volume numbers are more accurately calculated using a query of the following form:
SELECT COUNT(∗) as n u m a t t a c k s FROM a t t a c k s
WHERE TargetCountry LIKE ”%US%” ;
Doing this repeatedly for the top 12 countries in attack volume produces a more ac-curate estimate of attack volume. If make “countries” table, we have an easier way to get more reliable estimates for all countries of the form:
SELECT c o u n t r i e s . CountryCodeTwo , c o u n t r i e s . CountryName , COUNT( a t t a c k s . TargetCountry ) AS n u m a t t a c k s FROM
c o u n t r i e s LEFT JOIN a t t a c k s ON a t t a c k s . TargetCountry LIKE
CONCAT( ”%” , c o u n t r i e s . CountryCodeTwo , ”%” ) GROUP BY c o u n t r i e s . CountryCodeTwo
ORDER BY n u m a t t a c k s DESC;
After getting an idea of the countries and sectors that are targeted the most, we can focus on detailed queries to gain insight into cyber attack trends.
3.7 Analysis Overview
TargetCountry num attacks
US 1693
>1 599
GB 254
IN 124
NULL 110
CA 96
AU 77
RU 71
IL 65
FR 58
KR 57
UA 55
JP 54
CN 47
IT 45
DE 43
PK 40
BR 37
TR 37
NL 27
SA 25
PH 22
Table 3.3: The top 20 countries by attack volume 2014-2017 inclusive, as queried on the attacks database using a more targeted query for >1 and
Pearson Correlation Correlation Interpetted As
0.00−0.10 very weak
0.10−0.30 weak
0.30−0.50 moderate
0.50−1.00 strong
Chapter 4
CAPTURING SOCIO-ECONOMIC DATA
As discussed, previous works have shown a correlation between socio-economic factors and the volume of cyber-attacks a country receives [64] [42] [25] [37]. Here, we ag-gregate many socio-economic factors from open sources to study the degree to which various socio-economic factors influence a country’s volume of attack received. Most of factors are taken from Heliwell’s World Happiness Report 2015 [49]. The data included on this web page in the form of Excel spreadsheets and found by clicking, “Chapter 2 Online Data Expanded with Trust and Governance” contain data on many socio-economic factors, which shall be detailed in the next section. However, because GDP was not included in this dataset, only a GDP per capita, whose precision had been destroyed by dividing by a very large number (population), additional GDP data is found throughWorld Bank [26]. Two more fields “HappinessRank and “Hap-pinessScore” are found through a dataset that Sustainable Development Solutions Network hosts on Kaggle [58]. SDSN is an organization which actively supports the World Happiness Report [9]. We shall now delve into the contents of these datasets.
4.1 The World Happiness Report
Like the Hackmageddon data, before using the World Happiness Report data, it all needs to be wrangled [55]. In the first analysis, we are relating the socio-economic data from 2014 to the total attack volume over the total 2014-2017 period. This type of analysis assumes that the socio-economic factors relevant to a particular country don’t vary significantly enough to account for the disparity in overall cyber attack volume. Conversely, in the second analysis, which compares total cyber attack volume by year to socio-economic data for that year, assays to relate changes in both year-to-year. The assumption is that using data from every year could produce more detailed results, but relating them to the only first year suffices for seeing large trends in how total attacks received in this 4 year period.
Next, because there are not any columns for ISO alpha-2 or ISO alpha-3 country codes, only full country names, they must be added. Without them, joining to the
attackstable is error-prone. Then, two-word column names are combined into single-word names, and all missing values are filled with “NULL”. Many columns are mostly empty as well, so these areas where data was too difficult to collect are discarded. Finally, we are left with the following fields.
1. CountryName 2. CountryCodeTwo 3. CountryCodeThree 4. Population
5. Region
9. UpperConfInt Hap
10. StudyYear
11. LogGDPperCapita
12. SocialSupport
13. HealthyLifeExpectatBirth
14. FreedomLifeChoices
15. Generosity
16. PerceptionOfCorruption
17. PositiveAffect
18. NegativeAffect
19. ConfidenceInGov
20. DemocraticQuality 21. DeliveryQuality
22. PeopleCanBeTrusted
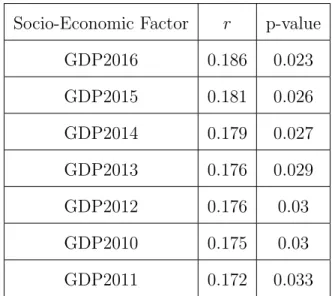
because there aren’t any datasets with happiness scores from 2014 or prior. Because socio-economic data does not vary much between years, but varies greatly between countries, 2014, the earliest year in the cyber attacks database is chosen. The implica-tion is that socioeconomic condiimplica-tions at the beginning of the study serve as an input which affects the output, cyber attack volume, over the subsequent years. To demon-strate the effects of this slight variability of socioeconomic data, consider how little the correlation between annual GDP and the total cyber attacks experienced 2014-2017 varies in table 4.1 There are not socio-economic data for 2014 for every country, in
Socio-Economic Factor r p-value
GDP2016 0.186 0.023
GDP2015 0.181 0.026
GDP2014 0.179 0.027
GDP2013 0.176 0.029
GDP2012 0.176 0.03
GDP2010 0.175 0.03
GDP2011 0.172 0.033
Table 4.1: Annual GDP Correlates of Total Cyber Attack Volume Received 2014-2017 in ascending order by p-value.
average of several fields. The Statistical Appendix for Chapter 2 of the 2015 World Happiness Report explains its significances as follows:
Variables in the expanded data set: Democratic and delivery quality mea-sures of governance are based on Worldwide Governance Indicators (WGI) project (Kaufmann, Kraay and Mastruzzi). The original data have six di-mensions: Voice and Accountability, Political Stability and Absence of Violence, Government Effectiveness, Regulatory Quality, Rule of Law, Control of Corruption. The indicators are on a scale roughly with mean zero and a standard deviation of 1. We reduce the number of dimensions to two using the simple average of the first two measures as an indicator of democratic quality, and the simple average of the other four measures as an indicator of delivery quality, following Helliwell and Huang (2008) [17].
Chapter 5 RESULTS
Risk is often defined in the utility function:
R = N
X
k=1
PrkU(Xk). (5.1)
where Prk is the probability of an event occurring, in the kth state, and U(Xk) is
SELECT d a t e s . AttackYear , d a t e s . AttackMonth , ym . T a r g e t C l a s s , ym . n u m a t t a c k s
FROM d a t e s LEFT JOIN
(SELECT YEAR( AttackDate ) AS AttackYear , MONTH( AttackDate ) AS AttackMonth ,
T a r g e t C l a s s , COUNT(∗) AS n u m a t t a c k s FROM a t t a c k s
WHERE T a r g e t C l a s s LIKE ”%Gov%”
GROUP BY AttackYear , AttackMonth , T a r g e t C l a s s ) ym ON (ym . AttackYear = d a t e s . AttackYear
AND ym . AttackMonth = d a t e s . AttackMonth ) ;
question of this thesis. The section “Socio-economic Factors” only covers correlates, because the census data for these factors are only taken once a year, whereas cyber attack traffic is analyzed at the smallest level on a month-by-month basis. This lays the groundwork for understanding the likelihood of attack, one of the components of risk assessment. The overarching implications of these results are covered in the Discussion section.
5.1 By Country
Countries that receive the most attacks are often not correlated with one another, but are of the most importance. Because their is not much overlap between these two groups, it is useful to break the study into two sections:
1. Trends 5.1.1: Study the cyber attack volume per month of the most heavily targeted countries in a subsection of their own
2. Correlates 5.1.2: Study the country pairs whose attack volumes are most closely correlated
5.1.1 Trends
patterns may appear, which are easier to understand visually.
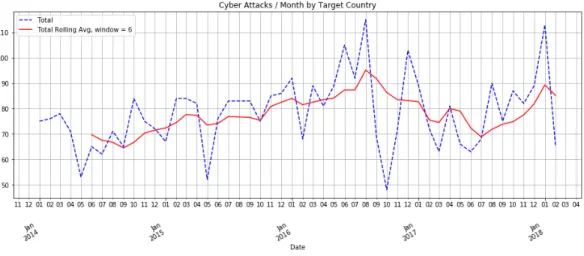
In figure 5.1 I show the total attack volume between January 2014 and February 2018. Note that figures 5.1 and 5.2 represent a high attack volume relative to the change in volume, so they are not shown with a y-axis starting at zero. In figure 5.1 the graph is jagged, with a global maximum of 116 attacks in August 2016 followed by a global minimum of 50 attacks two months later. This jaggedness means that cyber attack volume is changing dramatically in irregular ways. It may indicate dramatic changes in socioeconomic conditions. In figure 5.1, I plot the average of total attacks over the past six months in order to produce a smoother line that helps interpret larger trends. We see in figure 5.1 that rolling average total attacks generally increases from the start of the rolling average plot in June 2014 until the global maximum in August 2016, dipping until July 2017, and ramping back up until at least January 2018.
Figure 5.1: The timeline of total cyber attack volume, with a 6 month rolling average.
Figure 5.2: The timeline of US attack volume for the US with a 6 month rolling average.
of magnitude.
Figure 5.3: Attacks by Country Timeline — Timeline of cyber attack volume by country for top 5 victims.
Britain has global minima at March 2014 and October 2016. India’s attacks peak at global maxima 8 in Jan 2014 and Oct 2014, with global minima of zero attacks recorded at June 2014, Dec 2014, Jan 2015, Sept 2016, March 2017, Nov 2017, Dec 2017, and Feb 2018.
Figure 5.4: Timeline of cyber attack volume by country for Great Britain and India
By volume of cyber attacks received, Canada and Australia occupy spots 4 and 5 respectively. They are also not correlated in any significant way (r = 0.156, p = 0.279). Canada peaks in July 2015, with 12 months of 50 receiving zero reported attacks. Australia peaks in May 2015 and August 2015, with 10 months receiving zero reported cyber attacks.
The cyber attacks reported for the 6 and 7 spots, Russia and Israel, also uncor-related (r = 0.086, p= 0.552), are increasingly sparse as shown in figure 5.6. Russia has 13 months with zero attacks recorded, and Israel has 21 such months. There doesn’t seem to be much here. With few attacks, there doesn’t seem to be much we can learn. In the next subsection 5.1.2, we will see that that is not necessarily the case.
Figure 5.5: Timeline of cyber attack volume by country for Canada and Australia
Figure 5.6: Timeline of cyber attack volume by country for Russia and Israel
Figure 5.7: Average Cyber Attacks / Month for the US.
In figure 5.8 it can be seen that Great Britain’s cyber average cyber attacks peak in November. Glancing back at 5.4 it is shown that in 3 out of 4 years, Britain’s cyber attack volume peaks in November.
Figure 5.8: Average Cyber Attacks / Month for Great Britain.
India’s attack volume hits a global maximum on average in October, as seen in fig 5.9. This behavior is expected, as India’s cyber attack volume peaked in both October in 2014 and 2015, and October is the fourth most targeted month for India in 2016 and the fifth most targeted month for India in 2017.
Figure 5.9: Average Cyber Attacks / Month for India and Pakistan.
bursts in cyber attacks drastically affect the average. Though the average peaks in October, October was the peak in only 2 years, as shown in 5.14. In 2014, it peaks in October with 6 attack recorded, more than 3 times the per month average of 1.74 attacks. Additionally, in 2016, the peak is 1 attack recorded, where October shares the maximum with
Figure 5.10: Average Cyber Attacks / Month for Canada and Australia.
5.1.2 Correlates
likely to have similar changes in attack volume during the same month. The reason may be retaliatory, i.e. country ‘A’ and country ‘B’ may see attacks received increase at the same time because they are attacking each other. The correlation may also have a common cause, in the form of political, social, economic instability, or a common aggressor. This data is of course, not all the data that can be produced with this new cyber attack database, but produces 190 useful Pearson R correlations. A 20×20 correlation matrix render 400 entries, but 20 values along the diagonal are all r = 1.00, p = 0.00, because any item is 100% correlated with itself with absolute significance, and the entries on one side of the diagonal are duplicated on the other side of the diagonal.The r value is the Pearson correlation, where the absolute value determines how closely they are correlated. This is previous discussed in 3.7. Positive rvalues indicate that in general an increase in attacks in one country translates to an increase in attacks on another country, and negativervalues indicate that an increase in attacks on one country translates to a decrease in attacks against another country, and vice versa. As discussed in 3.7, p-values are always positive, and the smaller the more significant, where a value less than 0.05 is statistically significant. The table is sorted in ascending order by p-value, which indicates statistical significance. However, this is not the only thing we care about. For instance, if two countries both have zero cyber attacks reported for the entire 4 years, then they would have a perfect correlation, with absolute significance. The most correlated countries, with the greatest significance, are Turkey and the the Philippines in the top row of 5.1, with a total attack volume over the 4-year period of 36 and 22 attacks, respectively. Here we may want to focus on countries that have a large to moderate volume of cyber attacks, and see how they correlate. The US and China are both in the top 5 target countries, and we can see that they are moderately correlated in attack volume (r= 0.309, p= 0.029).
attack volume is correlated. Out of all countries, it is in fact the most correlated (r= 0.467,p= 0.001). Though Turkey has a global maximum of 4 attacks in January 2014, its next highest attack month is November 2014. Conversely,the Philippines has a global maximum in November 2014, and its second highest attack month is one month after Turkey’s. So, though their 1st and 2nd maxima do not perfectly align, the collectively occupy a similar temporal space, and behave similarly over the 4 year period. It is therefore highly unlikely that their correlation is merely due to their both receiving a low attack volume. Explaining the reasons for many of these correlations is difficult, but shall be discussed in the Discussion section 6.
Figure 5.11: Timeline of cyber attack volume by country for Turkey and the Phillipines.
Another one of the strange results of this research is in figure 5.12. It is surprising to see that Canada and Pakistan are weakly inversely correlated (r = −0.294,p = 0.038) as shown in table 5.1. For much of the graph in figure 5.12 Canada’s attacks will increase while Pakistan’s will decrease, and vice versa. Possible reasons for this, and other correlations will be discussed in the Discussion section 6.
Figure 5.12: Timeline of cyber attack volume by country for Canada and Pakistan.
generally increases and decreases with those of China.The unique maximum of attacks received by China (5 attacks) occurs at the same month, January 2016, as one of Japan’s 3 maxima (3 attacks) over the entire 4 year period.
Figure 5.13: Timeline of cyber attack volume by country for Japan and China.
from 7 months of zero reported attacks to receiving 2 attacks in August, the same month that India has its second greatest attack attack volume. 2016 is somewhat less interesting, because Pakistan only has 5 months of one attack and 7 months of zero attacks. However, in 2016 both India and Pakistan share a maximum in December. Running the Pearson correlation, the attacks received by Pakistan and by India are at least weakly correlated, (r = 0.289, p = 0.042), as one might expect from the previous visual inspection.
Figure 5.14: Timeline of cyber attack volume by country for India and Pakistan.
Figure 5.15: Timeline of cyber attack volume by country for Italy and Germany.
and China do share global minima in May 2015 and Nov 2017 (US = 21, CN = 0). They are moderately correlated (r= 0.309,p= 0.024)
Figure 5.16: Timeline of cyber attack volume by country for the US and China.
of synce, as in Sept 2014 and October 2016, where Japan reports 3 attacks and China reports none, or in Oct 2014 in which China reports 3 attacks and Japan reports none.
5.2 By Sector
Country A Country B r p-value
TR PH 0.458 0.001
AU IT -0.366 0.009
IT DE -0.356 0.011
JP CN 0.339 0.016
US JP 0.326 0.021
SA CN 0.324 0.022
IT PK -0.318 0.024
US CN 0.309 0.029
RU JP 0.305 0.031
IL PK 0.297 0.037
CA PK -0.294 0.038
IN PK 0.289 0.042
IN CN 0.268 0.059
KR NL 0.268 0.059
US TR 0.265 0.063
IN TR 0.264 0.064
IL IT -0.264 0.064
US DE 0.251 0.079
US RU 0.246 0.086
FR PH 0.244 0.088
Figure 5.17: Attacks Timeline for Industry and Org Sectors.
affected, which seems unhelpful. These inconsistencies makes data analysis against target sectors very difficult. For this reason, I focus mainly on the sectors in table
Figure 5.18: Attacks Timeline for >1 Label
5.2, excluding the label “>1”.
distributed amongst all attacks, but they are also independent of attacks against any other significantly targeted sector. They represent a significant portion of cyber attacks, but do not occur in similar frequencies to other popular target sectors; broad attacks are their own beast entirely. For reference I show their behavior in figure 5.18. They could be analyzed by other means, such as the type of attack, “Attack”, such as “DDOS”, “Defacement”, or by “AttackClass”, such as “CC” (Cyber Crime), or “CW” (Cyber Warfare). But broad attacks do not seem to be related to any other important target sectors. This cyber attacks database supports a near infinite combinations of queries for knowledge discovery, but only a fraction of them are presented in this thesis.
Sector Total Attacks Various Industries 1078
Government 592
Individuals 440
Org 306
Education 245
>1 198
Health Care 175
Finance 167
News 94
Table 5.2: The 9 most targeted sectors between January 2014 and February 2018, arranged in descending order by attack volume.
recorded for 2018 so far, as shown by querying the attack database I have created with Passeri’s data, as shown in figure 5.19. The effort undermines itself because it includes both the ISIC code and its associated label. If this is changed, it will greatly aid future studies, but for now, the vast majority of data collected uses the older ad hoc naming convention. Because the sector labels have changed starting January 2018, I present data only from January 2014 through December 2018.
Figure 5.19: ISIC Compliant Target Classes
Though the attacks have now been put into a database, the ad hoc naming conven-tion previously used for the “TargetClass” column makes querying the data difficult. Many sectors have been well-delineated, and those that have not have been grouped into the “Industries” and “Org” categories as previously described. Though “Indus-try” and “Org” are only prefixes to the specific sector, such as “Telecom”, erring on the side of inclusion helps to make inferences on a grander scale, such as the threat to the private sector in general. To get around this inconsistency, targeted queries similar to figure 5 are used to get accurate counts of attacks against a particular industry.
table 5.3 is the result. Because of the complex nature of the motivation behind cyber attacks, one cannot say that the volume of cyber attacks that one sector receives is the cause or effect of the volume of cyber attacks that another sector receives. However, this study allows us to see the shifting priorities of black hat hackers in general.
One insight we can gain from table 5.3 is that the attacks received by individuals and the attacks received against various industries are strongly inversely correlated (r = −0.595,p = 0.000), and are actually the most strongly correlated sectors, by absolute value. As the private sector in general experiences fewer cyber attadcks, individuals experience more, and vice versa. This can be visualized in figure 5.20. As
Figure 5.20: Attacks Timeline for Attacks Against Individuals and Indus-try Sectors
August 2018, the month in which overall cyber attacks peaked over the 4 year period, both attacks against industry and attacks against individuals reach a local maximum. Afterwards, they start diverging, and by July 2017, attacks against individuals have overtaken those attacks against industry.
The 2nd strongest correlation, shown in table 5.3 is between individuals and the health care sector. This is also the strongest positive correlation. In figure 5.21 I compare their monthly attack volume. They both share a global maximum in De-cember 2017, local maxima in August 2014, January 2016, August 2016 (at the peak of all cyber attacks), and April 2017. Though they are strongly correlated and have both grown on average, attacks against individuals have grown much more quickly; starting March 2017 through the end of the year, individuals have received at least twice as many cyber attacks as the entire health care industry. This may be because of the similar goals between attacks against health care institutions and individuals, namely personally identifiable information (PII). Out of the 175 cyber attacks against the health care sector, 42 were of the of the attack class (“Attack” column) “Account Hijacking”, or 24%. This ratio with respect to attacks against individuals is 35%, whereas in industry, a target sector inversely correlated to individuals, only 10% of all cyber attacks are via account hijacking. Evidently, the type of attack varies greatly between sectors, and health car and individual targets are similarly attacked for user account information.
Figure 5.21: Attacks Timeline for Individuals and Health Care sectors
Figure 5.22: Attacks Timeline for Government and Industry Sectors, the top 2 targeted sectors.
Figure 5.23: Attacks Timeline for Government and Individuals.
targeting individuals more.
Attacks against individuals and the financial sector are also moderately correlated (r = 0.446, p = 0.001). Their monthly totals are shown in figure 5.24. . Their
Figure 5.24: Attacks Timeline for Individuals and Finance sectors
period, in which it experienced 15 attacks, more than 4 times the average monthly attack rate. At least 3 of these attacks were against the SWIFT banking network, whose total losses from attacks 2015-2016 are in the millions [27]. SWIFT came under greater scrutiny after $81 million was stolen from one of its banks in Bangladesh in February 2016 [27].
5.3 Socioeconomic Factors
The results of analyzing the correlation between socioeconomic factors of a country and the total cyber attacks received imply that no one factor is even moderately correlated to cyber attack volume. The origin and meaning of these socioeconomic factors is previously discussed in section 4.1. This corroborates the findings of Solano’s “Socio-economic factors in Cybercrime” [64]. Solano’s work examines more specific relationships between socioeconomic factors of individual countries and their cyber attack volume. I find that A few socioeconomic measures are weakly correlated with cyber attack volume, as I show in table 5.4. Population (r = 0.208,p = 0.009) and GDP (r = 0.179,p = 0.027) are the factors most correlated to cyber attack volume. As GDP and population both represent resources for an entire country, this makes sense. In contrast, other socioeconomic factors which are not correlated to cyber attack volume, such as generosity (r = 0.133,p = 0.125), or the belief that people can be trusted (r = 0.134,p = 0.335), represent qualities of a group, but are not considered resources.
each other. In a dystopia it could be the case that a few powerful people are very happy, and the rest are very unhappy, in which case the confidence interval would be very large, and people would not trust each other very much. In general, when these results seem unintuitive, one possible way to understand these correlations may be indirect results which can be explained by other more intuitive correlations. For another example, the happiness confidence interval size is inversely correlated with healthy life expectancy at birth (r =−0.221, p= 0.008), which in turn is correlated with increased cyber attacks (r = 0.299,p= 0.000). This is more intuitive, because a greater life expectancy is generally associated with wealthy countries who experience more cyber attacks. This intuition is confirmed in that life expectancy is strongly positively correlated with the log GDP per capita with r = 0.811, p= 0.000. Many of these seemingly disparate socioeconomic features of a society indicate the assets that a society has, and therefore, the value of launching a cyber attack.
Another important aspect about socioeconomic conditions is the unique patterns to attacks against certain countries. For instance, in 3 of 4 years in question in this study, Great Britain received its peak cyber attacks in November, as previously shown in figure 5.4 implying a heightened risk to GB leading up to holiday shopping season. In 2016 Great Britain had 2 maxima: one in the predictable November spot, and one in June, when the Brexit vote was held [39], it is possible that it is coincidental, or that general social tension is correlated with a greater volume of cyber attacks received.
election, as shown in figure 5.2.
Alternatively, some attacks do not aim to change an election outcome, but to protest it. As shown in figure 5.6, Israel’s maximum cyber attacks received occurs in April 2015. In 2 ways these attacks against Israel are different than both the attacks around the Indian and American elections. Firstly, the individual attacks are clearly politically motivated by their descriptions. Of the 9 attacks in April 2015, 6 attacks are coordinated under the #OpIsrael tag, 1 is carried out by the Palestinian hacker group “Gaza Team” defacing government sites with pro-ISIS propaganda, 1 attacks Israeli military networks, and 1 attacks the Israeli arms importer and manufacturer Fab-Defense. Secondly, these attacks follow the election, rather than precede it. These attackers are not trying to influence an election or taking advantage of the socioeconomic condition for profit; they are likely protesting the recent controversial election of Prime Minister Netanyahu.
5.4 Attack Classes
Figure 5.25: Attacks Timeline for All Attack Classes
Cyber warfare is very minimal and erratic, while cyber espionage is slowly in-creasing. Cyber warfare pits very sophisticated government-sponsored groups known as “advanced persistent threats” (APT’s) against another country. The aggressor APT does not want to be disclosed in fear the country may seem malicious. Often, the victim country will not want to disclose an exposure for fear of appearing weak. Because the sophistication of these attacks, and their mutual concealment, events of cyber warfare may be the most concealed. Thus the Hackmageddon data likely only discloses a very small sample of the actual attacks countries pit against one another.
5.5 Attack Vectors
We show the most common attacks are in table 5.6. Their monthly totals are shown in figure 5.26. Account hijacking is the exfiltration of login credentials. Malware is unauthorized software running on a machine. Targeted attacks are a broad category of attacks that seek to compromise a system, often a piece of infrastructure, as when, in 2015, it was revealed that in 2013, a group of Iranian hackers had penetrated the online control system of a New York dam through a cellular modem [44]. SQL injection attacks occur when a user is able to directly manipulate SQL commands through a web form, thereby injecting malicious statements. DDoS is a distributed denial of service, in which many machines make requests to a server at once, overwhelming the server, making it unavailable. Defacement is hacking a website to change its content, and is a frequent result of hacktivist activity.
increasing, and malware has increased dramatically, eclipsing unknown attacks as the dominant threat.
Figure 5.26: Attacks Timeline for All Attack Types, as a 6 month rolling average
5.6 Apriori Results
Sector A Sector B r p-value Individuals Industry -0.595 0.000 Individuals Health Care 0.562 0.000 Government Industry 0.548 0.000
Industry Org 0.476 0.000
Individuals Finance 0.446 0.001 Health Care News -0.360 0.010 Government Individuals -0.348 0.013
Government Org 0.346 0.014
Government Finance -0.345 0.014 Individuals Org -0.341 0.015 Industry Finance -0.339 0.016 Individuals News -0.326 0.021 Industry Health Care -0.283 0.046 Finance Health Care 0.258 0.070
Industry News 0.234 0.103
News >1 -0.233 0.104
Finance Org -0.225 0.116
Individuals >1 0.199 0.167
Government News 0.151 0.294
News Org 0.150 0.298
Education Individuals -0.140 0.332 Government Health Care -0.137 0.342
Education News 0.099 0.496
Government >1 -0.092 0.523
Socio-Economic Factor r p-value
Population 0.208 0.009
GDP 0.179 0.027
Lower Confidence Interval of Happiness 0.173 0.033
Happiness Score 0.172 0.034
Upper Confidence Interval of Happiness 0.170 0.036
Happiness Rank -0.167 0.040
Log GDP per Capita 0.175 0.041 Healthy Life Expectancy at Birth 0.131 0.114
Generosity 0.133 0.125
Delivery Quality 0.408 0.147
Positive Affect 0.109 0.199
Freedom To Make Life Choices 0.098 0.247
Social Support 0.092 0.274
People Can Be Trusted 0.134 0.335 Confidence In Government -0.062 0.488 Perception Of Corruption -0.046 0.597 Democratic Quality 0.026 0.929 Negative Affect -0.004 0.962
Socioeconomic Factor r p-value
Population 0.360 0.000
Healthy Life Expectancy at Birth 0.299 0.000 Log GDP per Capita 0.297 0.000 Lower Confidence Interval of Happiness 0.281 0.000
Happiness Score 0.274 0.001
Happiness Rank -0.273 0.001
Upper Confidence Interval for Happiness 0.268 0.001
GDP 0.238 0.003
People Can Be Trusted 0.383 0.005
Generosity 0.145 0.095
Perception Of Corruption -0.144 0.097
Delivery Quality 0.408 0.147
Social Support 0.121 0.150
Freedom To Make Life Choices 0.111 0.192 Negative Affect -0.075 0.372
Positive Affect 0.076 0.374
Confidence In Government 0.008 0.925 Democratic Quality 0.026 0.929
Attack Number of Recorded Attacks As
Unknown 1010
Account Hijacking 507
Malware 463
Targeted Attack 449
SQL Injection 349
DDoS 339
Defacement 317
Chapter 6 DISCUSSION
In general, cyber attacks have a range of motivations, from monetary gain, political change, or simply spite, and other works have studied these [50]. In this study I cannot make a detailed conclusion of these motivations. Instead, I focus on the larger implications of each section. The main conclusions can be summarized in the following:
1. Countries with higher population, GDP, happiness, and other metrics that relate to resources are attacked somewhat more often.
2. There is an overall shift from attacking governments and businesses towards attacking individuals, even when political or financial gain is the object of the attack.
3. Malware has become the dominating threat in terms of number of attacks recorded in cyber security news.
The 1st point is supported by previous cyber security research, in which GDP per capita is moderately correlated (r = 0.42, p < 0.001) [33]. The 2nd point has not been examined. The 3rd point is supported by industry reports of a recent doubling of malware against IoT devices [20] and an overall decrease in DDoS attacks [11].
6.1 Countries
publicized for fear of making the target person, corporation, country, or government appear weak. Nevertheless, the biases inherent in the collection of these attacks seem self-consistent. There are no observable changes in these biases, and a small sample of attacks against countries with more recorded attacks can inform us of how cyber attack volume truly changed, and what can be expected in the future.
The US is the most consistent with other studies. By this study, the US is the most attacked country, and this conforms to Kumar’s account in “Approaches to understanding the motivations behind cyber attacks” [50]. Kumar also found that China was attacked with DDoS the 2nd most. However, my findings indicate that China is only attacked by DDoS the 16th most, and is attacked overall the 11th most. As Kumar’s findings usewww.digitalattackmap.com[6] which directly records DDoS attacks as they happen, and mine rely on security reports, their numbers are much more accurate. However, from their limited recorded attacks, and the moderate correlation between attacks against China and Japan, we can say that their similar geography and economy make their cyber attacks tightly coupled. For instance, when the Yen and the Chinese stock market plummeted in January 2016 [2], China and Japan both saw their global maxima in cyber attacks 2014-2017 occur that month 5.13 . This demonstrates the surprising power of incomplete data when sampled consistently.
Great Britain is the 2nd most attacked country according to this study, and in 3 of 4 years, its annual maximum of attacks received occurs in November. This is again, using a very incomplete dataset, but it strongly implies that Great Britain’s cyber attacks are cyclical, and are generally tied to the holiday shopping season.
a fluke . However, accurate relationships have been found in other small sample sets, and the correlation is weak, so perhaps it is not so unusual after all.
On average, Pakistan and India seem periodic, maximizing on average in October in figure 5.9. They are geographically similar, and in mutual conflict, which is not surprising. This average is disproportionately influenced by the cyber attack volume of October 2014, which was a global maximum for both countries as implied by figure 5.14. Another interesting result in figure 5.14 is that the Indian elections, which only occurred once 2014-2017, occurred March through April [16], and one of India’s 2 attack volume maxima occurred 3 months prior, in January. Four of January 2014’s 8 attacks against India target the government directly. This maximization of cyber attacks received around 3 months prior to a national election also occurred in the 2016 US Presidential election. So it is reasonable to expect that 3 months before a contentious election, cyber attacks may increase.
6.2 Sectors
The clearest observation is that attacks against various industries are dereasing and attacks against individuals are increasing, as figure 5.20 illustrates. Attacks against individuals and industry are also the most correlated by absolute value, (r =−0.595, p = 0.000). There seems to be a systematic shift towards attacking individuals, the largest share of which are account hijacking (31%), followed by malware (30%). Of account hijacking against individuals, (14%) were Twitter account hijacking. This is indicative of the types of trends to anticipate in the coming years.
target governments and the private sector at similar times, perhaps due to a tight coupling of politics and the economy of the US, the most attacked nation.
Attacks against several sectors (>1) make up a small portion of attacks in figure 5.18, but are on the rise, quadrupling between 2014 and 2017. In addition to the graphs in section 5.2, the change in attacks against the most targeted sectors can be understood through table 6.1. For clarification, the “Organizations” category includes political parties and religious groups, which are neither private sector nor government agencies.
Sector 2014 January-June 2017 July-December
Individuals 4% 31%
Industry 34% 18%
Government 19% 10%
Healthcare 5% 8%
>1 2% 8%
Finance 3% 5%
Organizations 10% 4%
Education 7% 4%
Table 6.1: Contrast of the attacks by sector at the beginning half of 2014 and the last half of 2017.
Another way to profile these attacks against different sectors is to examine the type of attack most likely to occur in each sector, as shown in tables 6.2, 6.3 6.4
Attack % of Attacks Against Individuals
Account Hijacking 31%
Malware 30%
Unknown 9%
Targeted Attack 7%
Malvertising 5%
Defacement 2%
Mobile Malware 1%
Table 6.2: Types of attacks against individuals, by percentage.
Attack % of Attacks Against Industry
Unknown 31%
Account Hijacking 10%
SQL Injection 10%
Malware 10%
DDoS 9%
Targeted Attack 7%
Point of Sale Malware 7%
Table 6.3: Types of attacks against industry, by percentage.
6.3 Socioeconomic Factors
socioeco-Attack % of Attacks Against Governments
Targeted Attack 23%
Defacement 22%
Unknown 18%
DDoS 14%
SQL Injection 6%
Malware 5%
Account Hijacking 5%
Table 6.4: Types of Attacks Against Governments, by percentage.
citizens, happier citizens, and more wealthy citizens are targeted more often.
6.4 Attack Classes
Over the span of the study 2014-2017, cyber crime has always dominated other attack classes, and continues to grow, as shown in 5.25. This asymmetry is likely because hacktivism is truly does represent a small slice of the pie, and cyber espionage and cyber warfare are not generally reported. Cyber crime is most likely a large source of cyber attacks, but the large gap between cyber crime and other attack classes is indicative of the culture of secrecy around cyber warfare and cyber espionage.
6.5 Attack Vectors
Chapter 7 CONCLUSION
Throughout this thesis I have analyzed cyber attack volume as a function of time, attack type, method of attack, target country, target sector, country to country rela-tionships, socioeconomic factors, and have discovered tentative but meaningful corre-lations in various factors of the victims of cyber attacks. Furthermore, I accomplished this using only freely available data sources. I discovered that annually sampled so-cioeconomic statistics are difficult to correlate with cyber attack volume received, but GDP per capita and population play the strongest roles. Despite this tenu-ous relationship, the largest spikes in cyber attack volume are tied to socioeconomic events, namely contentious elections, political corruption, and stock market dives. The volume of future attacks will continue to increase, more often targeting individ-uals directly, affecting wealthier more populous nations including the US and China, and more often take the form of malware. The imminent ubiquity of the Internet of Things (IoT) will present new challenges to security as easier systems to compromise, a wider attack vector, and higher value objectives, such as home surveillance, and interference with physical systems, such as power plants, as well as consumer devices. Therefore, it is extremely important that the security research community knows as much as possible about trends in cyber attacks.
Paris Climate Accord, has considered pulling out of NAFTA, and recently imposed large tariffs on steel, aluminum, and other goods to allies in the EU, Canada, and Mexico [53]. The announcement of these tariffs recently dipped dramatically, as the Wall Street Journal notes, “Nasdaq was down 6.54 percent, marking their biggest weekly percentage falls since January 2016” [32]. Dramatic US economic changes like these will likely precipitate a higher volume of cyber attacks, as I occurred with the Chinese stock market crash described in section 6.1.
In the future, it would be very helpful obtain more accurate estimates of the numbers and locations of cyber attacks, either using a private database, similar to Carley’s work [33], or by devising a way to reproduce similar results through open means. Additionally, correlating cyber attack volume with socioeconomic data on more than an annual basis, perhaps weekly, would bring greater clarity to how a changing socioeconomic climate directly affects cyber attack volume. Additionally, it may be helpful to store cyber attacks in a graph database, like Neo4j, which values relationships between entities over fast, uniform data access. In graph databases, entities are represented by vertices, and relationships are represented by edges. For instance, it is possible to use Neo4j’s Cypher query language to detect the longest cycles of aggression in the following way:
MATCH p = ( a t t a c k e r : e n t i t y )−[ l a u n c h e s ]−>(a : Attack ) −[ t a r g e t s ]−>( v i c t i m : e n t i t y )−[ l a u n c h e s ]−>[b : Attack ]
−>[ t a r g e t s ]−>( a t t a c k e r : e n t i t y )
WHERE ALL( a . a t t a c k D a t e < ( b . a t t a c k D a t e ) AND ALL( b . a t t a c k D a t e − a . a t t a c k D a t e < 3 0 )
RETURN p
ORDER BY l e n g t h ( p ) DESC;
BIBLIOGRAPHY
[1] About the correlates of war project correlates of war.
http://www.correlatesofwar.org/. (Accessed on 06/03/2018). [2] Chinas stockmarket crashes again - open the door to green.
https://www.economist.com/finance-and-economics/2016/01/04/chinas-stockmarket-crashes-again. (Accessed on 05/27/2018). [3] Country analysis, industry analysis - market risk assessment.
https://www.eiu.com/home.aspx. (Accessed on 06/03/2018).
[4] Credit insurance group — credendo. https://www.credendo.com/. (Accessed on 06/03/2018).
[5] Cyber crime costs projected to reach $2 trillion by 2019.
https://www.forbes.com/sites/stevemorgan/2016/01/17/cyber-crime-costs-projected-to-reach-2-trillion-by-2019/#168014803a91. (Accessed on 05/19/2018).
[6] Digital attack map. http://www.digitalattackmap.com/#anim=1&color=0& country=ALL&list=0&time=17661&view=map. (Accessed on 05/27/2018). [7] Downloads — world happiness report.
http://worldhappiness.report/download/. (Accessed on 04/27/2018). [8] Freedom house — championing democracy. https://freedomhouse.org/.
(Accessed on 06/03/2018).
[9] Frequently asked questions — world happiness report.
[10] International labour organization.
http://www.ilo.org/global/lang--en/index.htm. (Accessed on 06/03/2018).
[11] report-ddos-trends-q42017.pdf.
https://www.verisign.com/assets/report-ddos-trends-Q42017.pdf. (Accessed on 06/09/2018).
[12] Russia used twitter bots and trolls to disrupt brexitvote — news — the times.
https://www.thetimes.co.uk/article/russia-used-web-posts-to-disrupt-brexit-vote-h9nv5zg6c. (Accessed on 05/17/2018). [13] Transparency international - the global anti-corruption coalition.
https://www.transparency.org/. (Accessed on 06/03/2018). [14] Welcome to rsf website — rsf. https://rsf.org/en. (Accessed on
06/03/2018).
[15] World bank open data — data. https://data.worldbank.org/. (Accessed on 06/03/2018).
[16] eci.nic.in/eci main1/current/press note ge-2014 05032014.pdf.
http://eci.nic.in/eci_main1/current/Press%20Note%20GE-2014_05032014.pdf, May 2014. (Accessed on 05/27/2018). [17] Statistical appendix for chapter 2 whr.
https://s3.amazonaws.com/happiness-report/2015/StatisticalAppendixWHR3-April-16-2015.pdf, April 2015. (Accessed on 05/03/2018).
[18] Global device growth traffic profiles. https:
//www.cisco.com/c/dam/m/en_us/solutions/service-provider/vni-forecast-highlights/pdf/Global_Device_Growth_Traffic_Profiles.pdf, 2016. (Accessed on 05/19/2018).
[19] Iot: number of connected devices worldwide 2012-2025 — statista.
https://www.statista.com/statistics/471264/iot-number-of-connected-devices-worldwide/, November 2016. (Accessed on 05/31/2018). [20] Amount of malware targeting smart devices more than doubled in 2017 —
kaspersky lab.
https://www.kaspersky.com/about/press-releases/2017_amount-of-malware-targeting-smart-devices-more-than-doubled-in-2017, June 2017. (Accessed on 06/09/2018).
[21] Cisco’s vni predicts global annual ip traffic to exceed — the network.
https://newsroom.cisco.com/press-release-content?type=webcontent&articleId=1853168, June 2017. (Accessed on 05/31/2018).
[22] Appendix1ofchapter2.pdf. https://s3.amazonaws.com/happiness-report/2018/Appendix1ofChapter2.pdf, March 2018. (Accessed on 05/17/2018).
[23] R. Agarwal, R. Srikant, et al. Fast algorithms for mining association rules. In Proc. of the 20th VLDB Conference, pages 487–499, 1994.
[24] M. Al-Maolegi and B. Arkok. An improved apriori algorithm for association rules. arXiv preprint arXiv:1403.3948, 2014.
[26] T. W. Bank. Gdp per capita, ppp (current international $) — data.
https://data.worldbank.org/indicator/NY.GDP.PCAP.PP.CD, 2016. (Accessed on 04/27/2018).
[27] T. Bergin and N. Layne. Special report: Cyber thieves exploit banks’ faith in swift transfer network — reuters. https://www.reuters.com/article/us-cyber-heist-swift-specialreport-idUSKCN0YB0DD, May 2016. (Accessed on 05/15/2018).
[28] M. Bodley. Why montana is going backward on medical marijuana.
https://www.nbcnews.com/news/us-news/why-montana-going-backward-medical-marijuana-n410081, August 2015. (Accessed on 05/27/2018). [29] D. Borak and K. Vasel. The equifax hack could be worse than we thought.
http://money.cnn.com/2018/02/09/pf/equifax-hack-senate-disclosure/index.html, February 2018. (Accessed on 05/31/2018). [30] S. Brin, R. Motwani, J. D. Ullman, and S. Tsur. Dynamic itemset counting
and implication rules for market basket data. Acm Sigmod Record, 26(2):255–264, 1997.
[31] W. J. BROAD, J. MARKOFF, and D. E. SANGER. Stuxnet worm used against iran was tested in israel - the new york times. https://www.nytimes. com/2011/01/16/world/middleeast/16stuxnet.html?pagewanted=all, January 2011. (Accessed on 05/31/2018).
[32] S. Carew. Wall street nosedives as investors flee on trade war fears — reuters.