ADVANCING THE CLINICAL POTENTIAL OF
CARBON NANOTUBE-ENABLED STATIONARY 3D MAMMOGRAPHY
Andrew Connor Puett
A dissertation submitted to the faculty of the University of North Carolina at Chapel Hill in partial fulfillment of the requirements for the degree of Doctor of Philosophy through the Joint Department of Biomedical Engineering at the University of North Carolina and North Carolina
State University
Chapel Hill 2020
© 2020
ABSTRACT
Andrew Connor Puett: Advancing the Clinical Potential of Carbon Nanotube-enabled stationary 3D Mammography
(Under the direction of Otto Zhou)
Scope and purpose. 3D imaging has revolutionized medicine. Digital breast tomosynthesis
(DBT), also recognized as 3D mammography, is a relatively recent example. stationary DBT (sDBT) is an experimental technology in which the single moving x-ray source of conventional DBT has been replaced by a fixed array of carbon nanotube (CNT)-enabled sources. Given the potential for a higher spatial and temporal resolution compared to commercially-available, moving-source DBT devices, it was hypothesized that sDBT would provide a valuable tool for breast imaging. As such, the purpose of this work was to explore the clinical potential of sDBT. To accomplish this purpose, three broad Aims were set forth: (1) study the challenges of scatter and artifact with sDBT, (2) assess the performance of sDBT relative to standard mammographic screening approaches, and (3) develop a synthetic mammography capability for sDBT.
Throughout the work, developing image processing approaches to maximize the diagnostic value of the information presented to readers remained a specific goal.
Data sources and methodology. Sitting at the intersection of development and clinical
application, this work involved both basic experimentation and human study. Quantitative measures of image quality as well as reader preference and accuracy were used to assess the performance of sDBT. These studies imaged breast-mimicking phantoms, lumpectomy
Key findings. Characterizing scatter and artifact allowed the development of new processing
approaches to improve image quality. Additionally, comparing the performance of sDBT to standard breast imaging technologies helped identify opportunities for improvement through processing. This line of research culminated in the incorporation of a synthetic mammography capability into sDBT, yielding images that have the potential to improve the diagnostic value of sDBT.
Implications. This work advanced the evolution of CNT-enabled sDBT toward a viable clinical
To my beautiful wife, Savannah, who is able to see humor in even the smallest of moments. Thank you for making every day enjoyable. You make me a happier and better person. To my family, who are a constant source of unconditional love and support. You are my role
ACKNOWLEDGEMENTS
I feel incredibly fortunate to have joined Dr. Otto Zhou’s research team at the University of North Carolina at Chapel Hill in the summer of 2016. By that time, over a decade of work by this group had yielded novel imaging systems for a broad range of applications that were ready for clinical testing. As an MD-PhD candidate, it was an ideal time to join the lab. My mentors have been experts in basic research involving the development of x-ray technologies and clinician-scientists specializing in the translation of new imaging systems to the clinic. I will forever be grateful to Dr. Otto Zhou, Dr. Yueh Lee, Dr. Jianping Lu, and Dr. Christy Inscoe for their guidance and support through my PhD training. Thank you for your investment in me and your incredible mentorship.
Thank you to Dr. David Lalush and Dr. Cherie Kuzmiak for providing me with
invaluable feedback over the years. I hope to emulate your dedication to teaching and training. Thank you to both past and current members of the Zhou lab. My research has built on the work of others, and I have greatly enjoyed collaborating with and getting to know each and every one of you.
Thank you to the UNC MD-PhD leadership team. I am very grateful for your support while navigating this complex training path.
Thank you to Cassandra Houston and Vilma Berg, who have guided me through the administrative side of research. I very much appreciate your kindness and support over the years.
PREFACE
Given the potential to identify illness earlier and more accurately through better imaging, research continues into new imaging technologies. At the University of North Carolina (UNC) at Chapel Hill, which has been my undergraduate and now graduate school home, I have had the opportunity to participate in some of these advances. As an undergraduate student in biomedical engineering, I received a Carol Lucas Scholarship, providing me the opportunity to work in an engineering lab. My research experience began with Dr. Paul Dayton. The entire team from post-docs to graduate students included me in their projects. They taught me how to conduct basic research and analyze the results. I learned how to write scientific papers and present my findings as posters and talks, both on campus and at large scientific meetings. Through collaborations with other labs and interactions with physician-scientists, I also learned the excitement of
translating research to the clinic. My years with this group changed my life, cementing my desire to pursue a dual MD-PhD degree. It was also during this time that I developed a fascination with nanotechnology, 3D imaging, and the computer processing that creates the 3D images displayed to readers.
As an MSTP-supported MD-PhD candidate, I was honored to stay at UNC for graduate school for two key reasons. First, the UNC School of Medicine offered an innovative approach to medical training, which allowed for the integration of research into a strong clinical
and intellectual expertise of the scientists and clinicians brought together at UNC. During my first two medical school years, my interest turned to x-ray imaging, which continues to be the backbone of diagnostic medicine, and I joined the Applied Nanotechnology Laboratory for my PhD work in 2016.
By that time, over a decade of NIH-supported research under the direction of Drs. Otto Zhou and Jianping Lu had resulted in a revolutionary x-ray source using carbon nanotube (CNT) technology. The advantages of these fast and easily controllable x-ray sources for 3D imaging were clear, and the decision had been made to apply them to tomosynthesis, a form of limited-angle 3D imaging. Collaboration with industry allowed a rapid translation of CNT-enabled tomosynthesis to the clinic, and IRB-approved protocols were developed for human studies under the supervision of Dr. Yueh Lee, an MD/PhD-trained translational radiologist.
This has proven to be an ideal environment to train as a clinician-scientist with my interests, allowing me to do basic research on the technology itself and the computer code that processes the images, while also learning how to conduct human studies. My research has focused on evaluating new tomosynthesis imaging systems and developing image processing algorithms to improve their utility. These experiences in basic and clinical research provided the foundation for NIH-funding to complete my dissertation project with an NRSA F30 grant (1 F30 CA235892-01) entitled “Improved cancer screening with synthetic and stationary 3D
TABLE OF CONTENTS
LIST OF TABLES ... xv
LIST OF FIGURES ... xvi
LIST OF ABBREVIATIONS AND SYMBOLS ... xxii
CHAPTER 1: INTRODUCTION ... 1
1.1 Problem addressed in this work ... 1
1.2 Purpose of this work ... 2
1.3 Research questions asked in this work ... 2
1.4 Methodologies used to address the questions asked in this work ... 2
1.5 Rationale and significance of this work ... 3
1.6 Researcher’s role and assumptions during this work ... 5
1.7 Organization of this dissertation ... 5
CHAPTER 2: LITERATURE REVIEW ... 8
2.1 Introduction to Chapter 2: Literature Review ... 8
2.2 Breast cancer and breast imaging technologies ... 9
2.2.1 Breast cancer incidence and impact in the early 21st century ... 9
2.2.2 The value and limitations of breast cancer screening by mammography ... 9
2.2.4 The clinical value and technical limitations of conventional 3D
mammography ... 12
2.3 Carbon nanotube enabled stationary digital breast tomosynthesis (sDBT) ... 16
2.3.1 Making x-rays ... 16
2.3.2 Carbon nanotube-enabled x-ray source arrays and stationary digital tomosynthesis ... 21
2.4 Defining and measuring the quality of the digitized image ... 23
2.4.1 Digital radiography ... 23
2.4.2 Contrast and resolution ... 24
2.4.3 Scatter and noise ... 26
2.4.4 Feature visibility ... 28
2.5 Image quality problems inherent to tomosynthesis in general and sDBT in particular ... 29
2.5.1 Motion blur degrades resolution ... 29
2.5.2 Scatter limits contrast ... 30
2.5.3 Limited sampling introduces artifact ... 31
2.6 The image processing chain that generates sDBT images and the value of the synthetic mammogram ... 32
2.7 Summary for Chapter 2: Literature Review ... 38
CHAPTER 3: METHODOLOGY ... 39
3.1 Introduction to Chapter 3: Methodology ... 39
3.2 Rationale for the research approach ... 39
3.3 Research setting and context ... 40
3.4 Research samples and data sources ... 42
3.4.2 Lumpectomy specimens ... 45
3.4.3 Patient selection for human study ... 46
3.4.4 Reader selection ... 47
3.5 Data collection methods... 48
3.5.1 Acquiring images ... 48
3.5.2 Measuring scatter ... 57
3.5.3 Processing images ... 58
3.5.4 Displaying images ... 74
3.6 Data analysis methods ... 75
3.6.1 Measuring image quality and feature detectability ... 75
3.6.2 Assessing reader performance and preference ... 79
3.7 Trustworthiness of the study designs and findings ... 82
3.8 Limitations of the study designs... 83
3.8.1 Limitations imposed by technological differences in imaging systems ... 83
3.8.2 Limitations inherent to phantom-based experimentation ... 84
3.8.3 Limitations with image processing ... 84
3.8.4 Limitations imposed by reader experience ... 86
3.8.5 Addressing limitations and implications for future research... 86
3.9 Summary for Chapter 3: Methodology ... 87
CHAPTER 4: FINDINGS ... 89
4.2 The challenges of scatter and artifact with stationary tomosynthesis ... 89
4.2.1 Quantifying scatter in contrasted and non-contrasted sDBT images ... 89
4.2.2 The effect of scatter and noise correction through processing on sDBT image quality ... 94
4.2.3 Artifact reduction in reconstructed and synthetic sDBT images ... 96
4.3 The performance of sDBT relative to standard 2D and conventional 3D mammography ... 98
4.3.1 Visualizing microcalcifications in lumpectomy specimens ... 98
4.3.2 Experience with sDBT in human studies ... 106
4.4 Incorporating synthetic mammography into sDBT ... 111
4.4.1 Feature detectability in the synthetic mammogram as a function of intensity weighting during forward projection ... 111
4.4.2 Phantom-based testing of a forward projection approach incorporating feature enhancement ... 116
4.4.3 The effect of background equalization on the appearance of the synthetic mammogram ... 123
4.4.4 The clinical utility of sDBT-generated synthetic mammograms compared to standard mammography ... 124
4.5 Summary for Chapter 4: Findings ... 127
CHAPTER 5: ANALYSIS AND SYNTHESIS ... 128
5.1 Introduction to Chapter 5: Analysis and Synthesis ... 128
5.2 Discussion for Chapter 5: Analysis and Synthesis ... 129
5.2.1 Using resolution, scatter, and artifact to appreciate differences in DBT systems and directions of development ... 129
5.3 Summary for Chapter 5: Analysis and Synthesis ... 138
CHAPTER 6: CONCLUDING WITH A LOOK TO THE FUTURE ... 140
6.1 Exploring unique diagnostic applications of sDBT: dynamic, magnified, and multiplexed imaging ... 140
6.2 Exploring advanced image processing for sDBT: deep learning and radiomics ... 141
6.3 Applying the lessons learned ... 142
APPENDIX: DEVELOPING SYNTHETIC DENTAL RADIOGRAPHY ... 144
A.1 Recognizing the influential relationship between synthetic dental radiography and synthetic mammography ... 144
A.2 3D dental imaging and the potential clinical value of the synthetic dental radiograph ... 144
A.3 Tooth specimens used to develop image processing for sIOT ... 148
A.4 Acquiring sIOT images and reconstructing the 3D image stack ... 150
A.5 Understanding and correcting dense-feature artifact in sIOT images ... 151
A.5.1 Characterizing dense-feature artifact ... 151
A.5.2 Processing to minimize dense-feature artifact ... 153
A.5.3 Assessing the potential clinical benefit of dense-feature artifact reduction ... 154
A.6 Processing to generate multi-view synthetic dental radiographs ... 155
A.7 The utility of multi-view synthetic dental radiographs ... 157
A.7.1 Minimizing artifact ... 157
A.7.2 Seeing the interproximal space ... 158
A.7.3 Displaying caries adjacent to restorations ... 159
A.8 Conclusions: Extending the concept of multi-view synthetic dental
radiography ... 161
LIST OF TABLES
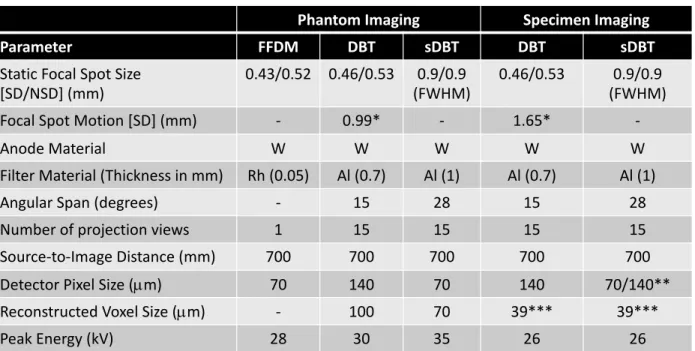
Table 3. 1. A comparison of the operating parameters of full field digital mammography, conventional digital breast tomosynthesis (DBT), and stationary digital breast tomosynthesis (sDBT), identifying similarities and differences that have a direct impact on the image quality measurements used in this dissertation work. ... 51
LIST OF FIGURES Chapter 2: Literature Review
Figure 2. 1. Schematic drawing of the geometry of a conventional digital tomosynthesis system. ... 13 Figure 2. 2. Schematic drawing comparing the system geometries of standard mammography, conventional digital breast tomosynthesis, and carbon nanotube-enabled stationary digital breast tomosynthesis (sDBT). ... 15 Figure 2. 3. Photographs of a Crookes tube, similar to the device used by Roentgen to
characterize the x-ray. ... 17 Figure 2. 4. A drawn depiction of the Coolidge tube as it appeared in the early 1900s. ... 18 Figure 2. 5. Photographs and a schematic drawing of a carbon nanotube (CNT) cathode, a single CNT-enabled x-ray source, and an x-ray tube containing a fixed array of these CNT-based sources... 20 Figure 2. 6. Representative examples of experimental carbon nanotube-based stationary digital tomosynthesis devices that are currently involved in human studies. ... 22 Figure 2. 7. A schematic drawing identifying the key physical parameters and geometric
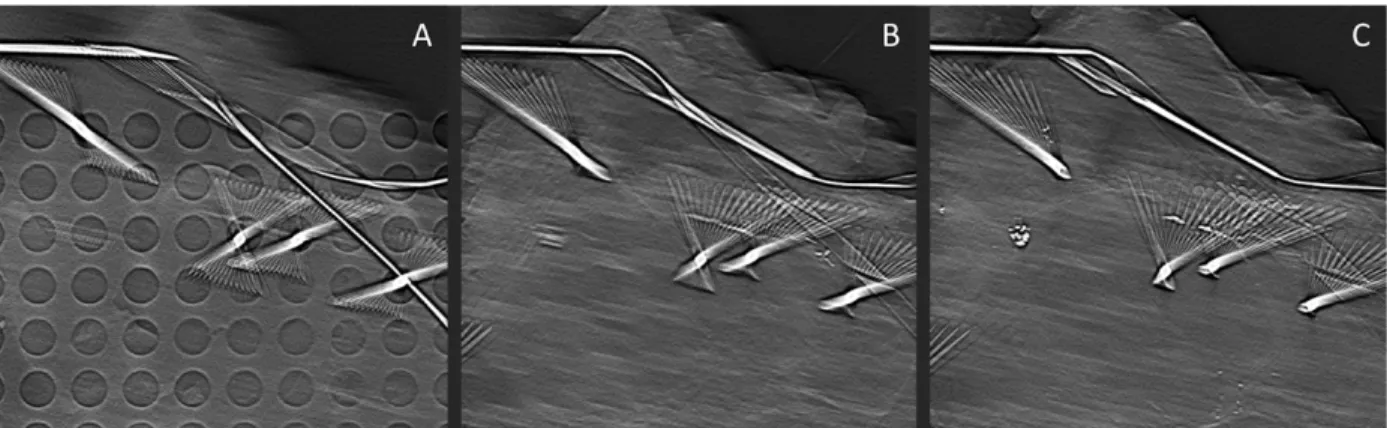
relationships that determine the resolution of an x-ray imaging system. ... 26 Figure 2. 8. Examples of the “slinky” appearance of metal artifact in stationary digital breast tomosynthesis (sDBT) images of a lumpectomy specimen containing metal needles and wires used to guide biopsy. ... 32 Figure 2. 9. Schematic drawing of the key processing steps and flow of information through an image processing chain to produce a synthetic mammogram for stationary digital breast
tomosynthesis (sDBT). ... 34
Chapter 3: Methodology
Figure 3. 1. Photographs of the three breast-mimicking phantoms used in this dissertation work. ... 44 Figure 3. 2. Photograph of the stationary digital breast tomosynthesis (sDBT) system used to image lumpectomy specimens along with an example projection image. ... 46 Figure 3. 3. Graphic display of resolution and noise in the three different breast imaging
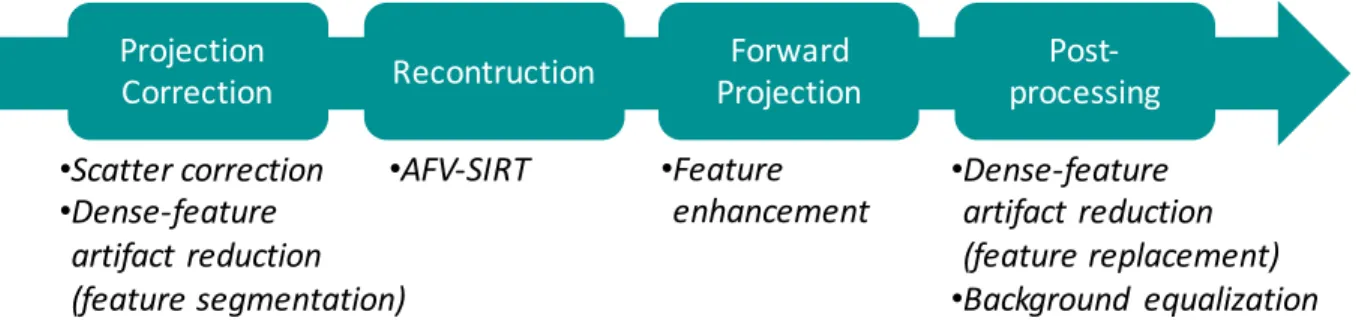
Figure 3. 4. Graphic display comparing doses of standard mammography and stationary digital breast tomosynthesis (sDBT) during human study. ... 54 Figure 3. 5. Representative images through the post-acquisition processing steps during a study of contrast-enhanced stationary digital breast tomosynthesis (sDBT). ... 56 Figure 3. 6. Overview of an image processing chain applicable to stationary digital breast
tomosynthesis (sDBT). ... 60 Figure 3. 7. Key image processing steps for dense-feature artifact reduction applied to stationary digital breast tomosynthesis (sDBT), including examples showing the evolution of the image as it progresses through the processing chain. ... 64 Figure 3. 8. Pictorial representation of the weighted approach to forward projection, which was used in the image processing chain to generate synthetic mammograms from the information contained in the projection images collected by stationary digital breast tomosynthesis (sDBT). ... 67 Figure 3. 9. Schematic diagram of the flow of information through the feature identification, weighting, and weighted-recombination steps used to generate synthetic mammograms for stationary digital breast tomosynthesis (sDBT). ... 68 Figure 3. 10. Pictorial representation of the use of Laplacian decomposition as a processing step during feature-identification. ... 69 Figure 3. 11. Schematic representation of the feature identification and weighting steps used to emphasize pathology in the synthetic mammograms generated for stationary digital breast
tomosynthesis (sDBT), including example images demonstrating the information being enhanced by the processing. ... 71 Figure 3. 12. Schematic representation of the final weighted recombination step used to generate pathology-enhanced synthetic mammograms for stationary digital breast tomosynthesis (sDBT), including examples of synthetic images of breast-mimicking phantoms. ... 72 Figure 3. 13. Schematic overview of the background-equalization algorithm applied to a
synthetic mammogram generated by stationary digital breast tomosynthesis (sDBT), including representative examples of the changing appearance of an actual breast image in response to these processing steps. ... 74 Figure 3. 14. Representative plots of the resolution, noise, and task functions used to calculate a detectability index (d’) for use with the stationary digital breast tomosynthesis (sDBT) system.77
Chapter 4: Findings
Figure 4. 2. The scatter-to-primary ratio (SPR) as a function of iodine concentration and breast thickness in projection images collected by stationary digital breast tomosynthesis (sDBT) directed at breast-mimicking phantoms that had been customized with wells containing iodine to simulate contrast-enhanced imaging... 91 Figure 4. 3. Scatter maps generated from the projection images collected by stationary digital breast tomosynthesis (sDBT) directed at breast-mimicking phantoms that had been customized with wells containing iodine to simulate contrast-enhanced imaging. ... 92 Figure 4. 4. The effect of applying different scatter-correction algorithms on the pixel intensity values in projection images collected by stationary digital breast tomosynthesis (sDBT) directed at breast-mimicking phantoms that had been customized with wells containing iodine to simulate contrast-enhanced imaging... 93 Figure 4. 5. The effect of applying different scatter correction algorithms on contrast and noise in stationary digital breast tomosynthesis (sDBT) images of breast-mimicking phantoms that had been customized with wells containing iodine to simulate contrast-enhanced imaging. ... 95 Figure 4. 6. The effect of applying different scatter correction algorithms on the detectability of contrasted sites in stationary digital breast tomosynthesis (sDBT) images of breast-mimicking phantoms that had been customized with wells containing iodine to simulate contrast-enhanced imaging. ... 96 Figure 4. 7. Example images demonstrating the effect of incorporating a metal artifact reduction (MAR) algorithm on the appearance of a reconstructed image slice generated by stationary digital breast tomosynthesis (sDBT). ... 97 Figure 4. 8. Example images demonstrating the amplification of dense feature artifact in
synthetic mammograms generated by stationary digital breast tomosynthesis (sDBT) as well as the value of artifact reduction through processing. ... 98 Figure 4. 9. The display of microcalcifications in images of lumpectomy specimens collected by magnified mammography, conventional digital breast tomosynthesis, and stationary digital breast tomosynthesis (sDBT). ... 100 Figure 4. 10. Comparison of the size of individual microcalcifications as displayed in the in-focus reconstructed image slice generated by stationary digital breast tomosynthesis (sDBT) and conventional DBT... 101 Figure 4. 11. Comparison of the depth resolution of stationary digital breast tomosynthesis (sDBT) and conventional DBT as reflected by the artifact spread function of individual
Figure 4. 13. Reader preferences when comparing the display of microcalcifications in the magnified mammography images of lumpectomy specimens and synthetic slab images generated by conventional digital breast tomosynthesis and stationary digital breast tomosynthesis (sDBT). ... 105 Figure 4. 14. A comparison of reader performance when interpreting standard mammograms and the reconstructed image stack generated by stationary digital breast tomosynthesis (sDBT) from patients with concerning breast lesions. ... 107 Figure 4. 15. Average reader performance as a function of breast density and compressed breast thickness when interpreting standard mammograms and the reconstructed image stack generated by stationary digital breast tomosynthesis (sDBT) from patients with concerning breast lesions. ... 108 Figure 4. 16. Reader confidence when interpreting standard mammograms and the reconstructed image stack generated by stationary digital breast tomosynthesis (sDBT) from patients with concerning breast lesions. ... 109 Figure 4. 17. Reader preference when interpreting diagnostically-important image features as displayed in the standard mammograms and the reconstructed image stack generated by
stationary digital breast tomosynthesis (sDBT) from patients with concerning breast lesions. . 110
Figure 4. 18. Example images comparing the standard mammogram and to an image slice from the reconstructed stationary digital breast tomosynthesis (sDBT) stack. ... 111 Figure 4. 19. Relationships between microcalcification visibility in synthetic images generated by stationary digital breast tomosynthesis (sDBT) as a function of the polynomial order used to weight the forward projection. ... 112 Figure 4. 20. Relationships between the visibility of masses in synthetic images generated by stationary digital breast tomosynthesis (sDBT) as a function of the polynomial order used to weight the forward projection. ... 113 Figure 4. 21. A comparison of pixel intensities in the actual mammogram and synthetic
mammograms generated from information collected by stationary digital breast tomosynthesis (sDBT). ... 114 Figure 4. 22. A comparison of microcalcification contrast in the actual mammogram and
synthetic mammograms generated from information collected by stationary digital breast
tomosynthesis (sDBT). ... 115 Figure 4. 23. Representative images of the American College of Radiology mammography accreditation phantom, allowing a comparison of the appearance of features in the mammogram and synthetic images generated by conventional digital breast tomosynthesis (DBT) and
(DBT) and stationary digital breast tomosynthesis (sDBT) of the American College of Radiology mammography accreditation phantom (ACR Phantom). ... 119 Figure 4. 25. The processed full field digital mammography (FFDM) image and synthetic images generated by conventional digital breast tomosynthesis (DBT), and stationary digital breast tomosynthesis (sDBT) of the CIRS Biopsy phantom stacked on top of a single slab of the CIRS Imaging phantom. ... 121 Figure 4. 26. The processed full field digital mammography (FFDM) image and synthetic images generated by conventional digital breast tomosynthesis (DBT), and stationary digital breast tomosynthesis (sDBT) of the CIRS Imaging phantom. ... 122 Figure 4. 27. The effect of applying background equalization algorithms to the synthetic
mammograms generated by stationary digital breast tomosynthesis (sDBT). ... 124 Figure 4. 28. A comparison of the appearance of the full field digital mammogram and synthetic images generated by stationary digital breast tomosynthesis (sDBT) of a patient with extremely dense breast tissue containing a maligancy. ... 125 Figure 4. 29. The processed full field digital mammogram and synthetic images generated by stationary digital breast tomosynthesis (sDBT) of a breast containing microcalcifications. ... 126
Appendix: Developing synthetic dental radiography
Figure A. 1. Pictures of the first-generation stationary intraoral tomosynthesis (sIOT) device, which has been installed in the clinic at The University of North Carolina at Chapel Hill School of Dentistry for human study. ... 149 Figure A. 2. Example image slices of a cadaveric mandible selected from the reconstructed 3D stack generated by stationary intraoral tomosynthesis (sIOT). ... 151 Figure A. 3. Characterizing artifact related to a metal restoration in the reconstructed image slices generated by stationary intraoral tomosynthesis (sIOT) as well as the effects of metal artifact reduction (MAR) through processing on image appearance. ... 152 Figure A. 4. Characterizing artifact related to a metal implant in the reconstructed image slices generated by stationary intraoral tomosynthesis (sIOT) as well as the effects of metal artifact reduction (MAR) through processing on image appearance. ... 153 Figure A. 5. Example slices from the reconstructed stack of an extracted tooth specimen
Figure A. 7. Example images of a vertical root fracture (VRF) in an obturated root specimen generated by stationary intraoral tomosynthesis (sIOT), demonstrating the changing appearance of the image as it moves through the processing chain. ... 157 Figure A. 8. Example image slices from reconstructed 3D stacks and synthetic radiographs generated by stationary intraoral tomosynthesis (sIOT). ... 158 Figure A. 9. Example images comparing the synthetic radiographs generated by stationary intraoral tomosynthesis (sIOT) to standard dental radiographs of tooth specimens with
LIST OF ABBREVIATIONS AND SYMBOLS
° Degrees
k Fleiss’ kappa
µm micrometer (micron)
2D Two-dimensional
3D Three-dimensional
4D Four-dimensional
ACR American College of Radiology AEC Automatic exposure control
AFV-SIRT Adapted fan volume modification of the simultaneous iterative reconstruction technique
AIP Average intensity projection
Al Aluminum
ANOVA Analysis of variance
AOP Automatic optimization of parameters ASF Artifact spread function
AUC Area under the curve
BIRADS Breast Imaging Reporting and Data System BKG Background
BRIC Biomedical Research Imaging Center
CA California
CC Craniocaudal
CE Contrast-enhanced
CI Confidence interval
CIRS Computerized Imaging Reference Systems, Inc.
cm centimeter
CMOS Complementary metal-oxide-semiconductor CNR Contrast-to-noise ratio
CNT Carbon nanotube
CT Computed tomography
d’ Detectability index DES Dual energy subtraction DQE Detective quantum efficiency DT Digital tomosynthesis
DBCT Dedicated breast computed tomography DBT Digital breast tomosynthesis
DCT Digital chest tomosynthesis
DICOM Digital Information and Communications in Medicine
ENH Enhanced
ECS Electronic control system FDA Food and Drug Administration
FE Field emission
FWHM Full-width at half-maximum GE General Electric
HE High energy
HIPAA Health Insurance Portability and Accountability Act IEC International Electrotechnical Commission
Interp Interpolation
IRB Institutional Review Board keV kiloelectron volts
kV kilovoltage
kVp Peak kilovoltage
K-edge Characteristic absorption
Kerma Kinetic energy released in matter
LE Low energy
MAR Metal artifact reduction
MA Massachusetts
mAs milliampere seconds MC Microcalcifications
mg milligram
mGy milligray
MIP Maximum-intensity projection
ml milliliter
MLO Mediolateral oblique
MQSA Mammography Quality Standards Act MR Magnetic resonance
mm millimeter
mSv millisievert
MSER maximally stable extremal regions MTF Modulation transfer function
NC North Carolina
NIH National Institutes of Health NNPS Normalized noise power spectrum NSD Non-scan direction
PET Positron emission tomography PMMA Polymethylmethacrylate PSD Primary sampling device
Rh Rhodium
ROC Receiver operating characteristic ROI Region-of-interest
RTT Real Time Tomography, LLC
SNR Signal-to-noise ratio SPR Scatter-to-primary ratio
TACT Tuned-aperture computed tomography TE Thermionic emission
TS Temporal subtraction
UNC University of North Carolina
US Ultrasound
USA United States of America VRF Vertical root fracture
W Tungsten
WI Wisconsin
CHAPTER 1: INTRODUCTION
1.1 Problem addressed in this work
Given its ability to identify pathology earlier and more accurately, three-dimensional (3D) imaging has revolutionized medicine. Digital breast tomosynthesis (DBT), now recognized clinically as 3D mammography, is a relatively recent example [Sechopoulos 2013a]. Since early detection is the key to surviving breast cancer [IARC Working Group 2016, Tabar 2015], effective screening and diagnostic imaging approaches are critical. As a result of studies demonstrating an improved diagnostic accuracy when standard two-dimensional (2D) and 3D mammography are combined, the use of DBT has been steadily increasing since its approval by the Food and Drug Administration (FDA) in 2011 [Gao 2017]. As with all commercially-available 3D x-ray devices, DBT works by moving a standard x-ray source through space to collect a series of projection views at oblique angles relative to the target [Sechopoulos 2013a]. The information in these projection views is then combined mathematically using computer algorithms to generate a 3D image [Sechopoulos 2013b]. However, the need to move the x-ray source limits the temporal and spatial resolution of the imaging device and thus the quality of the images presented to the reader [Zheng 2019]. Stationary DBT (sDBT) is an experimental
introduce unique challenges with scatter, noise, and artifact. This dissertation work focused on understanding and addressing these challenges with a goal of exploring sDBT as a tool to improve breast imaging.
1.2 Purpose of this work
Given its unique approach to collecting x-ray images, sDBT offers the possibility of generating images with a higher clinical value than the currently-available 3D mammography devices. It was therefore hypothesized that sDBT would provide a valuable breast imaging tool, leading to the stated purpose and title of this dissertation work - advancing the clinical potential of sDBT.
1.3 Research questions asked in this work
In order to accomplish its goal of advancing the clinical potential of sDBT, three broad Aims were set forth for this work. Aim 1 involved understanding the challenges of scatter, noise, and artifact related to the unique geometry and operating characteristics of the sDBT system. Aim 2 assessed the performance of sDBT relative to standard 2D and conventional 3D
mammography. Aim 3 sought to incorporate a synthetic mammography capability into the sDBT system, thereby completing the evolution of this experimental technology to a viable clinical tool. Throughout the project, a key question was constantly asked and studied: Could image processing approaches be developed to improve the diagnostic value of the images that the sDBT system was generating? In this way, the Aims proved to be complementary, as the findings from each influenced ongoing study of the others.
1.4 Methodologies used to address the questions asked in this work
designs. The methodologies ranged from highly-controlled basic research to human studies and included the imaging of breast-mimicking phantoms, lumpectomy specimens, and patients on IRB-approved study protocols (see Chapter 3: Methodology). In large part, this work involved determining the value of the information contained in images generated by sDBT, typically using standard 2D and 3D breast imaging technologies as references for comparison. Many different and previously-validated approaches were used to measure image quality and diagnostic value. These included (1) direct measures of feature properties in the image, such as contrast and signal intensity, (2) objective calculations of feature visibility using detectability indices, adapted to the unique questions raised by the novel sDBT approach to image acquisition, as well as (3)
subjective measures of reader preference. When feasible, the diagnostic accuracy of readers interpreting sDBT images was also determined.
1.5 Rationale and significance of this work
Early detection is the key to surviving breast cancer [IARC Working Group 2016, Tabar 2015]. As such, research continues to improve the imaging technologies used to screen for and evaluate breast lesions [Krupinski 2019]. CNT-enabled sDBT is an example of this advancing technology [Qian 2012]. Given the fact that pre-clinical testing has demonstrated the potential for a high spatial and temporal resolution [Calliste 2017], this work sought to explore the clinical potential of sDBT, with a goal of maximizing the value of the information presented to readers in sDBT images through improved image processing. It culminated in the incorporation of a
synthetic mammography capability into the sDBT system. As a result, this work is significant for
several reasons:
are critical for the ongoing clinical research of this novel technology, which has the potential to improve both the detection and diagnostic evaluation of breast cancer.
2. Stationary tomosynthesis is being tested across a broad range of clinical applications. In addition to breast imaging, other promising niches include dental [Inscoe 2018, Puett 2018c], musculoskeletal [Inscoe 2020b], chest [Hartman 2016, Lee 2018, Gunnell 2019], and head [Spronk 2020, Luo 2020] imaging. The work presented in this dissertation focuses on breast imaging. However, the issues of scatter, noise, and artifact were actually studied across this spectrum of imaging tasks, with each anatomic environment introducing unique challenges. For example, artifacts are prominent when tomosynthesis is used to image targets containing highly-attenuating features, perhaps best exemplified by dental imaging, given the presence of bone, teeth, and frequently metal. Similarly, scatter significantly degrades the quality of chest imaging. Experience with stationary tomosynthesis over this broad range of application has included both pre-clinical experimentation as well as preliminary patient testing (see 2.3.2 Carbon nanotube-enabled x-ray source arrays and stationary tomosynthesis). This experience has contributed to the overall understanding of the performance of this novel technology as well as the development of key image processing tools, which will prove useful as stationary tomosynthesis continues to be explored at the clinical level for many different imaging tasks. As an example, see
APPENDIX: Developing synthetic dental radiography. In other words, the findings from this work reflect a foundation of knowledge, applicable not only to breast imaging but also to stationary tomosynthesis in general.
development, in terms of both the technology itself as well as the image processing approaches that display its information to readers. The tendency for imaging technology and processing to evolve together, especially as it relates to the sDBT system, is discussed in detail in Chapter 5: Analysis and Synthesis.
1.6 Researcher’s role and assumptions during this work
The work presented in this dissertation is built on a foundation of basic research laid down over the past two decades in the Applied Nanotechnology Laboratory under the guidance of Drs. Otto Zhou and Jianping Lu. During this time, a large team of technicians, students, and post-doctoral fellows collaborating with industry, had (1) developed a CNT-enabled cathode capable of supporting x-ray production sufficient for human imaging [Calderon-Colon 2009], (2) conceived, designed, and then built stationary digital tomosynthesis devices around arrays of CNT-enabled x-ray sources [Qian 2009, Shan 2015], and (3) optimized the performance of these novel devices in pre-clinical testing [Tucker 2013]. Additionally, core image processing code customized to the unique geometry of stationary tomosynthesis was developed to generate the tomosynthesis images [Wu 2015]. It was at this point of transition from development to application that I joined the lab in 2016. My research has been determined by the assumptions and discoveries of those before me, as I have continued to study sDBT under the guidance of this team that invented and developed it.
1.7 Organization of this dissertation
advances in imaging technology, especially 3D mammography, to improve outcomes with this disease are reviewed. Next, the unique imaging approach of CNT-enabled sDBT is explained. This explanation highlights the potential advantages offered by this experimental technology over the currently-available 3D mammography devices while also identifying problematic issues that affect the quality of the sDBT images displayed to readers. Since the development of
processing to improve the diagnostic value of sDBT images was a major focus of this work, in-depth reviews of image quality and the image processing chain that generates the displayed sDBT images are provided. Given the scope of this dissertation, many different study designs were utilized (see 1.4 Methodologies used to address the questions asked in this work), ranging from benchtop experimentation to human trials. The details of this broad research approach are provided in Chapter 3: Methodology. Chapter 4: Findings organizes the results of this work in terms of its three broad Aims: (1) understand the challenges of scatter, noise, and artifact with sDBT, (2) assess the performance of sDBT relative to currently-available 2D and 3D
stationary tomosynthesis across a range of imaging tasks (see 1.5 Rationale and significance of
this work and 2.3.2 Carbon nanotube-enabled x-ray source arrays and stationary tomosynthesis). The work presented herein was heavily influenced by this broad experience, and as an example, a brief summary of stationary tomosynthesis applied to dental imaging is provided (see
CHAPTER 2: LITERATURE REVIEW
2.1 Introduction to Chapter 2: Literature Review
Chapter 2: Literature Review places the work of this dissertation in both its technical and clinical contexts, providing a conceptual framework to understand the motivations that have guided the research as well as the potential implications of the findings. It begins with a
discussion of the impact of breast cancer in the early 21st century and the potential for advances
in imaging technology to improve outcomes with this disease. Next, the currently-available breast imaging technologies are reviewed, with an emphasis on 3D mammography, which is the clinical designation for digital breast tomosynthesis (DBT). The technical differences between the novel imaging approach of carbon nanotube (CNT)-enabled stationary DBT (sDBT) and conventional, moving-source DBT options are detailed. These differences provide the basis to understand the potential advantages of sDBT as well as the challenges that remain in
implementing this unique technology at the clinical level. Many of these challenges can be addressed through improved image processing, and therefore, understanding the factors that decrease image quality as well as processing approaches to minimize them is important. Since image processing is a major focus throughout this work, the key processing steps required to generate sDBT images are reviewed. When linked together, these coding steps are referred to as the image processing chain, which in this work, eventually culminates in the generation of reconstructed 3D image stacks and 2D synthetic mammograms. Since improved synthetic mammography may be the key step by which 3D mammography replaces standard 2D
detail. In summary, this chapter presents the background knowledge upon which this
dissertation work was built, thereby providing a foundation for understanding the direction of the research as well as the value of the findings.
2.2 Breast cancer and breast imaging technologies
2.2.1 Breast cancer incidence and impact in the early 21st century
Breast cancer is by far the most common non-skin malignancy in women, accounting for more than the next two common cancer types (lung and colorectal) combined [Noone 2018]. On average, women in the United States have a greater than 10% lifetime risk of developing breast cancer [Noone 2018]. In 2019, over 250,000 Americans were diagnosed with invasive breast cancer, and more than 40,000 died from the disease [American Cancer Society 2019]. As with all malignancies, breast cancer is a general term that encompasses a variety of different neoplasia types across a wide spectrum of disease aggressiveness and prognosis, reflecting a complex mix of genetic, environmental, and socioeconomic factors [Jardines 2015]. Research continues to understand these influences and their impact on screening and diagnostic testing as well as treatment [IARC Working Group 2016]. Nevertheless, despite these many unknowns, there is at least a consensus that early detection through imaging is the key to improved outcomes for women with breast cancer [IARC Working Group 2016]. In part related to earlier detection through mammography, the 5-year survival rate for breast cancer has increased from about 69% in the period from 1975 - 1977 to about 88% between 2009 - 2015 [American Cancer Society 2019].
2.2.2 The value and limitations of breast cancer screening by mammography
compression were introduced, greatly improving the visualization of breast tissue [Gold 1990]. Dedicated mammography units staffed with radiologists specifically trained in the interpretation of the mammogram proliferated through the 1980s and 1990s, and at the turn of the century, digital mammography was introduced, with the landmark study confirming the value of digital mammography being published in 2005 [Pisano 2005]. Currently, digital mammography remains the breast screening tool of choice. The American College of Radiology (ACR) and Society of Breast Imaging recommend annual mammography for all women beginning at age 40 [Mainiero 2017]. This recommendation is based on data demonstrating a significant reduction in breast cancer mortality with mammographic screening [Otto 2011, Hellquist 2011, Tabar 2011]. In fact, early detection of breast cancer through mammography reduces breast cancer mortality by 40%, since women with screen-detected cancers benefit more from therapy than do women with cancers detected clinically [IARC Working Group 2016]. The standard screening protocol involves obtaining two views, cranial-caudal (CC) and mediolateral-oblique (MLO), delivering an effective radiation dose of 0.44 mSv on average [Hendrick 2010]. To put this dose in
commonly in the dense breast environment [Kerlikowske 2019]. In response to the relatively high recall rates and room for performance improvement associated with standard 2D
mammography, intense interest has been focused on 3D breast imaging for years [Vedantham 2015].
2.2.3 The advantages of 3D compared to 2D breast imaging
3D imaging has revolutionized medicine, allowing for an earlier and more accurate detection of disease throughout the body. Without question, 3D breast imaging approaches, including ultrasound (US), computed tomography (CT), magnetic resonance (MR), and positron emission tomography (PET) [Zhang 2018], have improved the characterization and localization of concerning breast lesions. However, these are diagnostic applications of imaging. The issues that define a viable screening tool are quite different, being centered around the practicality of widespread use. The American Cancer Society recommends 3D imaging by MR for women considered at high risk for breast cancer, identified by genetic testing or a concerning family history [Saslow 2007]. However, the expense, limited availability, and relatively low specificity preclude MR as a general screening tool [Taskin 2018]. Similarly, limited data and issues with image resolution currently constrain the screening value of breast CT [Lindfors 2010]. Until relatively recently, there has been a clinical need for a cost-effective, 3D breast-screening option. Now most commonly referred to as 3D mammography, DBT has been filling this need in the United States since its approval by the FDA in 2011. This approval followed studies
2.2.4 The clinical value and technical limitations of conventional 3D mammography
3D mammography has been rapidly adopted by breast radiologists following its approval by the FDA for patient care in 2011. In 2014, approximately 30% of breast imaging clinics offered DBT, growing to 65% by 2016 [Gao 2017]. This increased use is supported by studies showing an improved diagnostic accuracy when DBT is combined with standard 2D
mammography, including a higher cancer detection rate and a lower call-back rate for false-positive findings [Chong 2019]. Indeed, it is now consensus opinion that DBT provides a better tool than standard 2D mammography for visualizing soft tissue features of concern, such as architectural distortion, asymmetry, and especially breast masses [Chan 2017]. However,
microcalcification appearance and clustering are also important, with small, irregular, and tightly clustered microcalcifications being of most concern for cancer [Nalawade 2009], and questions remain regarding reader performance when assessing microcalcifications in DBT images [Horvat 2019]. As a result, breast screening typically involves two separate imaging studies, including standard 2D mammography as well as DBT. By 2016, DBT was used in more than one-third of the screening examinations when available, the majority of which also included standard 2D mammography [Gao 2017]. However, combining 2D and 3D mammography doubles the radiation dose and prolongs the uncomfortable time of breast compression [Ratanaprasatporn 2017]. Hence, research continues to improve the performance of DBT, with a goal of eliminating the need to obtain a standard 2D mammogram at the same time. Appreciating the directions of this research requires an understanding of how DBT works.
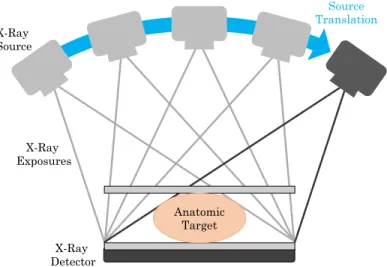
standard x-ray source through space to collect a series of projection views from different angles around the target (Figure 2.1). Computer programs combine the information in these projections mathematically to reconstruct the 3D image displayed to readers. Developed in the 1970s, computed tomography or the “CT scan” is the most widely-recognized and most commonly-ordered 3D x-ray study [Power 2016]. During a CT scan, the x-ray source and detector rotate around the target collecting hundreds to thousands of projections. Complicated and expensive machinery is required to accomplish CT, typically delivering relatively high radiation doses [Smith-Bindman 2009]. CT has been adapted for breast imaging, often referred to as Dedicated Breast CT (DBCT). However, DBCT is currently limited by its relatively low spatial resolution and incomplete coverage of the entire breast [Lindfors 2010].
Figure 2. 1. Schematic drawing of the geometry of a conventional digital tomosynthesis system. Note that a single standard x-ray source is translated through space to collect a series of
projection views.
Tomosynthesis refers to limited-angle tomography. In other words, fewer projections are collected over a relatively narrow angle span compared to CT. This significantly simplifies the technical demands of the equipment and reduces the radiation dose. First introduced
X-Ray Source
X-Ray Detector X-Ray Exposures
Anatomic Target
limitation of planar imaging, namely the superposition of overlying detail. The result was a series of images on film, referred to as projection views, that could be shifted and superimposed to bring into focus structural details present in the same anatomic plane, as first demonstrated practically by Garrison et. al. [Garrison 1969]. In other words, tomosynthesis is a technique which can capture some 3D information from a limited number of 2D images. The technology underwent a series of ingenious modifications, involving innovations in projection patterns and viewing devices to overlay the projection films [Dobbins 2003]. Interest in tomosynthesis waned through the 1980s, following the introduction of CT, but returned in the 1990s with the
incorporation of digital detectors, since the application of computer-based image processing and mathematical reconstruction eased the workload of the reader, improved the diagnostic accuracy of the images, and decreased the required projection number and thus radiation dose of the tomosynthesis scan [Dobbins 2003]. Digital tomosynthesis quickly found niches in which the cost and radiation dose of CT seemed excessive, but planar imaging was often inadequate. Examples included diagnostic evaluations for kidney stones [Liu 2018], chest imaging to look for lung nodules [Ferrari 2018], and breast cancer screening [Sechopoulos 2013a].
and information available from each projection within the constraints imposed by the need to move a single x-ray source through space to collect the projection views, maintain a low
radiation dose, and complete the study in a short time. Currently, there are seven manufacturers producing DBT devices worldwide, of which four have FDA-approved devices available for use in the United States [The Market Reports 2018, US FDA 2018]. Each design uses a different combination of source motion protocols, projection number and dose per projection, angle span, and source-detector positioning to maximize the diagnostic value of the displayed images
[Mackenzie 2017, Vedantham 2015]. In large part, the ongoing design changes seek to minimize the limitations in resolution (see 2.4.2 Contrast and resolution) imposed by the need to move the x-ray source [Zheng 2019].
It was this need for compromise in the design of moving-source DBT that provided the motivation to develop stationary DBT, which uses a distributed array of fixed x-ray sources made possible by CNT technology to collect the projection views without source motion (Figure 2.2).
3D breast anatomy, tomosynthesis can produce a 3D image. However, since conventional DBT systems (B) must move the x-ray source, the 3D image can be compromised by blur. In contrast, sDBT (C) uses a fixed and distributed array of carbon nanotube (CNT)-enabled x-ray sources, allowing for the production of a blur-free 3D image.
2.3 Carbon nanotube enabled stationary digital breast tomosynthesis (sDBT) 2.3.1 Making x-rays
2.3.1a The standard thermionic x-ray source
The medical community quickly recognized the potential of x-ray imaging to visualize pathology. Wilhelm Conrad Roentgen reported the penetrating properties of these rays that he discovered in November 1895 [Roentgen 1896]. Within months, devices capable of generating x-rays were being installed in medical facilities across Europe and North America [NDT 2014]. Imaging a wrist at Dartmouth College in Hanover, New Hampshire provided one of the first medical x-rays in America [Michaelides 2009], and the fact that x-ray imaging would change the course of medicine was demonstrated dramatically in Canada soon thereafter. Tolson Cunning was shot in the leg in December, 1895 in Montreal, and an initial surgery failed to locate the bullet [Thali 2002]. After learning about a demonstration of x-ray imaging by Professor John Cox at McGill University, Cunning’s surgeon, Dr. R. C. Kirkpatrick, turned to Cox for help. A 45-minute exposure to x-rays showed the bullet to be lodged between the tibia and fibula, guiding a successful second surgery [Thali 2002]. Along with the introduction of anesthesia and antibiotics, x-ray imaging was a defining moment of modern medicine. In recognition of this fact, the Nobel Prize for Physics was commissioned in 1901, with Roentgen being its first recipient [Nobel Media 2020].
two electrodes generates a current of electrons that produce a greenish fluorescence and x-rays (Figure 2.3) on interaction with the glass [Behling 2015].
Figure 2. 3. Photographs of a Crookes tube, similar to the device used by Roentgen to
characterize the x-ray. The Crookes tube (A) consists of a negatively-charged cathode (metal disk at left) and a positively-charged anode (at the base) encased in glass tube. Applying a voltage between the electrodes results in electron emission from the cathode, resulting in a greenish fluorescence as the electrons interact with the glass (B). Note the shadowed cross, demonstrating that the electron flux travels from the cathode. These pictures have been shared in the public domain by D-Kuru via Wikimedia Commons.
Patented in 1913, the “Coolidge tube” represented a major advance in x-ray source design (Figure 2.4) [Nascimento 2014]. In this tube, a tungsten filament was used as the source of electrons, and Coolidge’s discovery that heating the metal cathode greatly increased the number of available electrons has remained the basis of virtually all diagnostic and therapeutic x-ray devices used clinically since then. Indeed, advances in hardware have greatly improved the
A
safety of x-ray machines. However, the process of generating x-rays for biomedical imaging has changed very little over the past century.
Figure 2. 4. A drawn depiction of the Coolidge tube as it appeared in the early 1900s. Although the basic arrangement is similar to the Crookes tube (Figure 2.3), the use of a heated tungsten cathode dramatically increased the electron flux and thus x-ray production. This approach of heating a cathode to “boil off” electrons, known as thermionic emission, has remained the basis of medical x-ray devices for the past century. This drawing has been shared under the Creative Commons Attribution 4.0 International license.
when they interact with the anode. Most is released as heat, but approximately 0.03% of the primary electron energy contributes to the diagnostic x-ray beam [Behling 2015]. The energy spectrum of these x-rays is adjusted using metal filters to remove the low energy photons incapable of penetrating the target, since these photons can deposit in tissue, carrying risk, without providing any imaging value. Additionally, the x-ray beam is collimated or shaped to the target, to minimize exposure to surrounding tissues.
The long experience with TE has produced reliable x-ray sources for a tremendous variety of both diagnostic and therapeutic devices. However, given the technological difficulties in coordinating multiple TE sources, as a result of their high operating temperature and power consumption, standard x-ray tubes impose limitations when repetitive imaging must be obtained quickly, as with 3D imaging [Zhou 2010].
2.3.1b Carbon nanotube cathodes and field emission
[Puett 2018a]. Step by step, the techniques to achieve appropriate CNT lengths, density, and distribution and a stable CNT attachment over an area of several square millimeters were
developed [Calderon-Colon 2009]. Currently, this fabrication process is producing CNT cathode arrays on a commercial scale (Figure 2.5).
Figure 2. 5. Photographs and a schematic drawing of a carbon nanotube (CNT) cathode, a single CNT-enabled x-ray source, and an x-ray tube containing a fixed array of these CNT-based sources. The aluminum x-ray window, access ports, and ion pumps can be seen in this
photograph of a sealed tube (a). The tube contains an array of 31 fixed and separate x-ray sources (b), each of which uses field-emission to release electrons from a CNT-based cathode. Figure adapted from [Puett 2018a].
Multi-walled CNTs measuring 3-8 nanometers in outer diameter are grown via a thermal carbon vapor deposition process. Vacuum annealing followed by mechanical removal of the top surface layer yields a vertically-aligned CNT field that is surprisingly uniform in CNT density and length [Calderon-Colon 2009].
tube currents needed for human imaging. Approximately 60% of the available electrons pass through the gate and are accelerated by the anode voltage, which can vary from around 30 kV for mammography to 140 kV for chest imaging. CNTs are quite sensitive to arcing events or
“shorts” between electrodes. These currents are carried by ions produced from the heated tube components or environmental contaminants. To minimize the arcing risk, the source tube containing CNT cathodes is sealed and maintained in a strict vacuum of <10-8 torr. Sealed tubes
containing CNT-based cathodes have proven to be quite durable x-ray sources, demonstrating a stable gate voltage to maintain the tube current over an estimated 2.5 years of clinical use [Sprenger 2011].
2.3.2 Carbon nanotube-enabled x-ray source arrays and stationary digital tomosynthesis
The CNT-enabled x-ray source is ideal for the repetitive imaging steps needed to accomplish 3D imaging. It is fast and operates at room temperature, eliminating the need for much of the supporting equipment required with standard x-ray tubes. Additionally, since simple voltage manipulation is all that is needed to control x-ray production, the function of multiple individual sources can be easily coordinated. As such, fixed arrays of sources can be built with tremendous flexibility in their distribution, thereby offering a solution to the limitations imposed by the need to move thermionic x-ray sources through space to collect projection views.
Recognizing the advantages of a fixed, distributed CNT-enabled source array for tomosynthesis led to the concept of stationary digital tomosynthesis, and collaboration with industry allowed the construction of sDT devices customized to different imaging tasks (Figure 2.6) [Puett 2018a]. Two sDBT devices were available for study during this dissertation, including the
second-generation sDBT device for laboratory experimentation [Calliste 2017]. The sDBT devices differ primarily in their achievable dose rates, peak energies, and angular spans [Calliste 2017].
Figure 2. 6. Representative examples of experimental carbon nanotube-based stationary digital tomosynthesis devices that are currently involved in human studies. The stationary digital breast tomosynthesis (sDBT), stationary intraoral tomosynthesis (sIOT), and stationary digital chest tomosynthesis (sDCT) systems utilize different geometries and supporting equipment,
customized to the imaging task. Example images from human study are displayed next to each device. Figure adapted from [Puett 2018a].
In addition to the two sDBT devices, a seven-source linear tube with an angle span of 12°
has been developed for dental imaging [Inscoe 2018]. This imaging system was designated stationary intraoral tomosynthesis (sIOT), with “intraoral” referring to the location of the
detector in the mouth (Figure 2.6). Experience with sIOT had a direct impact on the work carried out with sDBT, which in turn heavily influenced the development of customized image
processing approaches for sIOT (see APPENDIX: Developing synthetic dental radiography). More specifically, work with sIOT was integral to the development of dense-feature artifact reduction techniques as well as recognition of the potential value of displaying multi-view images (see 3.5.3 Processing images).
The application of stationary tomosynthesis to chest imaging introduced unique challenges, especially with scatter. Pre-clinical testing using chest-mimicking phantoms, pig lungs, and cadaveric human lungs as well as early IRB-approved and HIPAA-compliant trials on
stationary Digital Chest Tomosynthesis (sDCT) stationary Intraoral
Tomosynthesis (sIOT) stationary Digital Breast
patients with cystic fibrosis [Hartman 2016, Lee 2018, Gunnell 2019], lung nodules (Clinical Study Identifier: NCT02075320) [Hartman 2016], and cardiac calcifications (Clinical Study Identifier: NCT03169062) have been carried out using a repurposed tube of CNT-enabled x-ray sources incorporated into a standard chest imaging configuration. These initial studies with stationary digital chest tomosynthesis (sDCT) have laid the foundation for an NIH-supported
study (grant: 1R21CA216780) to study scatter during sDCT imaging [Inscoe 2020a]. Musculoskeletal imaging to improve the detection of fractures is also a promising area for stationary tomosynthesis, and early experience with this approach is now available [Inscoe
2020b]. The most recently developed CNT-enabled system for head imaging contains multiple linear arrays of x-ray sources that are arranged to cover the angular span necessary for complete “CT” imaging [Spronk 2020, Luo 2020]. Although still considered experimental, CNT-enabled devices have demonstrated a reliable performance across this broad range of clinical
applications. In fact, the sDBT systems utilized for this dissertation work and the sDCT device have been operational for more than 5 years in pre-clinical testing and now human studies [Tucker 2013, Lee 2019, Shan 2015, Inscoe 2020a]. Additionally, the FDA has recently approved the first CNT-enabled device for human imaging. This single-source portable x-ray machine is now operational in hospitals [Pesce 2017].
2.4 Defining and measuring the quality of the digitized image
2.4.1 Digital radiography
Without question, digitization has revolutionized medical imaging, allowing for the easy storage and transfer of image data, and importantly, the opportunity for post-acquisition
have been dramatic and are quite directly responsible for the renewed viability of tomosynthesis. At a general level, digital detectors convert the energy from an x-ray photon into an electric signal that is passed to a computer. For breast imaging detectors, pixels typically have a footprint of just 70-100 µm, permitting the resolution needed to characterize microcalcifications. As such, the average flat-panel detector measuring around 25 cm per side will contain upwards of 10 million pixels.
Many measures are used to characterize detector performance. However, the detective quantum efficiency (DQE) provides a useful metric, as it quantifies how well the detector collects and then passes on the information from incoming photon signals. In a broad sense, DQE compares the signal-to-noise ratio (SNR) of the incoming signal to the readout signal. More specifically, it measures the detector’s influence on image contrast, noise, and resolution, taking account of the strength of the incoming signal (x-ray photon density). The detector pixel size is also an important determinant of system performance, as it defines a theoretical limit of spatial resolution. As noted above, pixel sizes in the range of 70-100 µm are used for breast imaging, since characterizing microcalcifications requires this level of resolution. Finally, the readout rate or time required to transfer the pixel-by-pixel information to the computer is important, especially for imaging modalities such as sDBT. Given the potential for fast scan times, the detector readout rate may prove to be a rate limiting step for image acquisition during sDBT, since each projection view must be read out sequentially.
2.4.2 Contrast and resolution
broad sense, a high-quality image presents information in a way that maximizes the chance that a trained reader will make an accurate diagnosis. Interpreting the anatomic and pathologic detail displayed in an image involves recognizing patterns. The clarity or visibility of the pattern is a direct result of the resolution and contrast of the image. Resolution and contrast define image characteristics that allow a region-of-interest, such as an anatomic detail, to be distinguished from its background. Contrast defines the intensity of a feature relative to its immediate surroundings, while resolution defines the ability to distinguish two independent features as separate. As such, resolution refers to the “distinctness” of the edge that separates a feature from its surroundings and is often described as the “crispness” or “sharpness” of an image. Resolution and contrast are quantifiable and can therefore be used to compare the quality of one image to another.
Contrast results from the relative absorption of x-ray photons as they interact with components of the anatomic target. As such, contrast is dependent on the energy spectrum of the x-ray beam as well as the physical properties of the target itself. The extent of photon absorption is defined mathematically by the attenuation coefficients of the target components. Optimizing contrast during image acquisition primarily involves selecting appropriate tube settings (mAs and kVp). The goal is to minimize or at least correct for those factors that limit contrast,
primarily scatter and noise. As discussed below, tomosynthesis presents unique challenges with regard to these issues (see 2.5 Image quality problems inherent to tomosynthesis in general and sDBT in particular).
feature-of-interest being imaged, and the detector pixel. Figure 2.7 demonstrates these geometric relationships.
Figure 2. 7. A schematic drawing identifying the key physical parameters and geometric relationships that determine the resolution of an x-ray imaging system. For a stationary source, resolution is primary determined by the sizes and locations of the anode focal spot, the detector pixels, and the anatomic target. However, blur can be introduced in the detector or by movement of the x-ray source or target during the scan, which can degrade resolution.
From an image acquisition standpoint, achieving good resolution involves selecting an appropriate equipment design (focal spot size, separation distances, and detector properties) for the given task, while minimizing factors that compromise resolution, such as motion-related blur. 2.4.3 Scatter and noise
Scatter and noise degrade image quality and are problematic for all x-ray imaging systems. However, unique challenges arise with scatter and noise during digital tomosynthesis [Wu 2009] (see 2.5 Image quality problems inherent to tomosynthesis in general and sDBT in particular). Diagnostic imaging typically utilizes x-ray photons in the energy range of 20 to 150 kVp. In this range, the two predominant interactions between the photon and the atoms of the target are the photoelectric effect and scatter [Bushberg 1998]. The photoelectric effect refers to
Anode Focal Spot
the disappearance of the x-ray photon as its energy is absorbed by a target atom. Its energy is imparted to the electron cloud, displacing an electron and leaving the atom in an ionized state. Non-absorbed, or primary, x-ray photons pass through the target and are collected by the detector. Image contrast results from the relative differences in photon absorption across the target. However, x-ray photons can also deflect off target atoms. Most commonly, this
interaction is inelastic, meaning that the x-ray photon loses some of its energy and travels off in a different direction. This interaction is known as Compton scattering, named after Arthur
Compton, who described it in the early 1920s [Bushberg 1998]. Since the deflected photons follow an unexpected path to the detector, they result in image patterns that do not correspond to the actual structure of the target. The chance that a photon will be scattered depends on its energy, the density of the target, and the distance that the photon travels through the target [Marchiori 2004].
X-ray machines are electronic devices, and given the stochastic behavior of electrons and photons, their operation is associated with noise. Noise is best considered as random fluctuations in a signal, and it is present in both the x-ray emission and digital detector. X-ray noise is known as “quantum,” reflecting the inherently probabilistic nature of photon generation and
operation in order to balance noise and total dose. Important factors include the tube current and anode voltage, projection view number and span, the distribution of dose among sources, and timing of source exposures. Intuitively, collecting as many projection views as possible or perhaps concentrating the dose in the most central projection views may be expected to improve image quality. However, because of detector noise, this is typically not the case. For example, sDBT performance testing prior to its clinical implementation included assessments of the
signal-to-noise ratio (SNR) in many system configurations and demonstrated that the use of 15 of the available 31 sources with dose divided equally across the entire span was optimum for image quality [Tucker 2013].
2.4.4 Feature visibility
There is no perfect x-ray image, as processing the information for display involves tradeoffs between contrast and resolution. Noise limits contrast, and as such, removing the noise signal is preferable. However, adjusting image information is known as filtering, and all filtering comes at a price. For example, noise is a high-frequency image component, but so are edges. As such, suppressing noise can lower resolution. It is therefore best to consider image quality in a more global sense. A high-quality image is one that provides the most-useful clinical
information. In other words, a high-quality image presents information in a way that maximizes the chance that a trained reader will make an accurate diagnosis. This is a task-specific
definition. For example, the optimum balance of contrast and resolution to display a breast mass in a mammogram may be quite different from the balance that best displays a microcalcification. As such, defining image quality at the clinical level involves measuring the visibility of specific features. The visibility or conspicuity of an image feature can be quantified through the