DESIGNS AND ANALYSIS OF TWO-PHASE STUDIES, WITH APPLICATIONS TO GENETIC ASSOCIATION STUDIES
Ran Tao
A dissertation submitted to the faculty at the University of North Carolina at Chapel Hill in partial fulllment of the requirements for the degree of Doctor of Philosophy in the
Department of Biostatistics in the Gillings School of Global Public Health.
Chapel Hill 2016
Approved by: Danyu Lin Donglin Zeng Kari E. North Yun Li
c O 2016 Ran Tao
ABSTRACT
Ran Tao: Designs and Analysis of Two-Phase Studies, with Applications to Genetic Association Studies
(Under the direction of Danyu Lin and Donglin Zeng)
The two-phase design is a cost-eective sampling strategy when investigators are inter-ested in evaluating the eects of covariates on an outcome but certain covariates are too expensive to be measured on all study subjects. Under such a design, the outcome of inter-est and the covariates that are inexpensive to measure are observed for all subjects during the rst phase, and the rst-phase information is used to select subjects for measurements of expensive covariates during the second phase. This design greatly reduces the cost asso-ciated with the collection of expensive covariate data and thus has been widely used in large epidemiological studies.
In two-phase studies, if the second-phase selection depends on multiple outcomes, then one should consider all of them simultaneously in a multivariate regression model in order to obtain valid inference. We develop an ecient likelihood-based approach to making inference under multivariate outcome-dependent sampling. We implement a computationally ecient expectation-maximization algorithm and establish the theoretical properties of the resulting maximum likelihood estimators. We demonstrate the superiority of the proposed methods over standard linear regression through extensive simulation studies. We provide applications to two large-scale sequencing studies.
ACKNOWLEDGMENTS
I would like to express my deepest gratitude to my advisers Drs. Danyu Lin and Donglin Zeng. They gave me great guidance, support, and encouragement throughout my graduate studies. I have learned a great deal from their unique perspective on research, their sharp insight into statistical problems, and their passions. All of these will inspire me to strive for excellence in my future career.
I would like to give sincere thanks to my committee members: Drs. Kari E. North, Yun Li, and Quefeng Li. I appreciate them for reading the manuscript and oering insightful comments and suggestions, which have led to signicant improvements of the dissertation.
I am deeply grateful to my graduate research assistant supervisors Drs. Danyu Lin and Kari E. North. They have oered me great opportunities to participate in several large-scale genetic studies, through which I developed my collaborative and interdisciplinary research skills. In addition, their generous nancial supports have helped me through my entire graduate study.
TABLE OF CONTENTS
LIST OF TABLES ... viii
LIST OF FIGURES ... xi
CHAPTER 1: INTRODUCTION ... 1
CHAPTER 2: LITERATURE REVIEW ... 3
2.1 Introduction ... 3
2.2 Methods for Analyzing Two-Phase Studies with a Single Outcome ... 4
2.2.1 Methods Using Second-Phase Subjects Only ... 4
2.2.2 Methods Using All Study Subjects ... 7
2.3 Methods for Analyzing Multivariate Outcome-Dependent Sampling Studies ... 13
2.4 Design Eciency of Two-Phase Studies ... 14
CHAPTER 3: ANALYSIS OF SEQUENCE DATA UNDER MULTIVARIATE TRAIT-DEPENDENT SAMPLING ... 16
3.1 Introduction ... 16
3.2 Methods ... 19
3.3 Simulation Studies ... 22
3.4 CHARGE-TSS ARIC Data ... 31
3.5 NHLBI ESP EA Data ... 35
3.6 Discussion ... 49
3.7 Theoretical Details... 55
3.7.2 Estimation ... 57
3.7.3 Asymptotic Properties ... 60
3.7.4 Association Tests ... 63
CHAPTER 4: EFFICIENT SEMIPARAMETRIC INFERENCE UNDER TWO-PHASE, OUTCOME-DEPENDENT SAMPLING ... 65
4.1 Introduction ... 65
4.2 Methods ... 68
4.2.1 Sieve Maximum Likelihood Estimation ... 68
4.2.2 EM Algorithm ... 71
4.2.3 Asymptotic Properties ... 73
4.3 Simulation Studies ... 75
4.4 NHLBI ESP ... 79
4.4.1 BP Study... 79
4.4.2 LDL Study ... 82
4.5 Discussion ... 84
4.6 Proofs of Theorems ... 88
CHAPTER 5: OPTIMAL TWO-PHASE DESIGNS AND FUTURE RESEARCH ... 100
5.1 Optimal Two-Phase Designs ... 100
5.1.1 Introduction... 100
5.1.2 Methods ... 101
5.1.3 Simulation Studies... 105
5.2 Future Extensions ... 107
5.2.1 Ecient Inference Under General Two-Phase Sampling ... 107
5.2.2 Optimal Two-Phase Designs ... 107
LIST OF TABLES
3.1 Simulation Results for Estimating the Genetic Eects on Trait 1 (Null Eect) and Trait 2 (Positive Eect)
in Case 1, Five Traits with the Same Eect ... 24 3.2 Percentage of Bias and RMSE for Estimating the
Ge-netic Eects on Trait 2 (Positive Eect) in Case 1, and Traits 2 (Positive Eect) and 3 (Negative Eect)
in Case 2 Under the One-Tail Design ... 25 3.3 Simulation Results for Estimating the Genetic Eects
on Trait 1 (Null Eect), Trait 2 (Positive Eect), and Trait 3 (Negative Eect) in Case 2, Six Traits with
Opposite Eects ... 26 3.4 Simulation Results for the IPW Method Under the
One-Tail Design ... 27 3.5 Simulation Results for Estimating the Genetic Eects
on Trait 1 (Null Eect) and Trait 2 (Positive Eect)
in Case 1 Under the Two-Tail Design ... 28 3.6 Simulation Results for Estimating the Genetic Eects
on Trait 1 (Null Eect), Trait 2 (Positive Eect), and Trait 3 (Negative Eect) in Case 2 Under the
Two-Tail Design ... 29 3.7 Simulation Results for Estimating the Genetic Eects
on Trait 1 (Null Eect) and Trait 2 (Positive Eect)
in Case 1 When the Traits Follow MultivariateT Distributions ... 30 3.8 Simulation Results for Comparing the Multivariate
and Univariate Approaches ... 31 3.9 Summary of the ARIC Data in the CHARGE-TSS ... 33 3.10 Pairwise Correlations of the 11 Traits Used for
Sam-pling in the CHARGE-TSS ARIC Data ... 35 3.11 Top 10 SNPs in the Single-Variant Analysis of the
3.12 Top Five Targeted Regions for the T1, T5, MB, and SKAT Tests in the Analysis of the BMI Data Using
the MLE Method in the CHARGE-TSS ARIC Sample ... 37 3.13 Top Five Targeted Regions for the T1, T5, MB, and
SKAT Tests of the Global Null Hypothesis in the
CHARGE-TSS ARIC Sample... 38 3.14 Sample Size Summary of the NHLBI ESP EA Data ... 39 3.15 Top 10 SNPs in the Single-Variant Analysis of the
LDL Data in the NHLBI ESP EA Sample... 41 3.16 Top 10 Genes for the T1 Tests in the Analysis of the
LDL Data Using the MLE Method in the NHLBI ESP
EA Sample ... 49 3.17 Top 10 Genes for the T5 Tests in the Analysis of the
LDL Data Using the MLE Method in the NHLBI ESP
EA Sample ... 50 3.18 Top 10 Genes for the MB Tests in the Analysis of
the LDL Data Using the MLE Method in the NHLBI
ESP EA Sample ... 50 3.19 Top 10 Genes for the SKAT Tests in the Analysis of
the LDL Data Using the MLE Method in the NHLBI
ESP EA Sample ... 51 3.20 Top 10 Genes for the T1 Tests of the Global Null
Hypothesis in the NHLBI ESP EA Sample ... 51 3.21 Top 10 Genes for the T5 Tests of the Global Null
Hypothesis in the NHLBI ESP EA Sample ... 52 3.22 Top 10 Genes for the SKAT Tests of the Global Null
Hypothesis in the NHLBI ESP EA Sample ... 52 3.23 Estimation off(Z),f(Z, G), andf(G|Z)in the
Anal-ysis of the Second Most Signicant SNP of the LDL
data in the NHLBI ESP EA Sample ... 55 4.24 Simulation Results Under the Model Y = 0.5X +
0.5Z + 0.5W + With the Second-Phase Sample
4.25 Simulation Results Under the Model Y = 0.5X + 0.5Z + 0.5W + 0.4XW + With the Second-Phase
Sample Selection Depending Only onY ... 77 4.26 Simulation Results When the Second-Phase Sample
Selection Depends on BothY and Z... 78 4.27 Top 10 SNPs in the Analysis of the BP Study in the
NHLBI ESP ... 83 5.28 Eciency Comparisons Between the ODS, RDS, and
LIST OF FIGURES
3.1 Plot of the p-values for the MLE versus LS methods in the analysis of the BMI data in the CHARGE-TSS
ARIC sample. SNPs with MAFs greater than 5% are included. ... 34 3.2 Quantile-quantile plots for the single-variant analysis
of the LDL data using the MLE and LS methods in the TDS study only and in all four studies included in the NHLBI ESP EA sample. The values of the genomic control λ, dened as the ratio between the observed median of the test statistics and the median of the χ2
1 distribution, are also shown. ... 40
3.3 Forest plots based on the MLE and LS methods for the third, sixth, and ninth most signicant SNPs in the analysis of the LDL data in the NHLBI ESP EA sample. Est, SE, and CI stand for the genetic eect
estimate, standard error, and condence interval, respectively. ... 42 3.4 Plot of the p-values for the multivariate versus
uni-variate methods in the analysis of the LDL data in the TDS study in the NHLBI ESP EA sample. SNPs
with MACs ≥5are included. ... 43 3.5 Quantile-quantile plots for the T1 tests based on the
MLE and LS methods in the analysis of the LDL data in the TDS study only and in all four studies included in the NHLBI ESP EA sample. The values of the
genomic control λ are also shown. ... 44 3.6 Quantile-quantile plots for the T5 tests based on the
MLE and LS methods in the analysis of the LDL data in the TDS study only and in all four studies included in the NHLBI ESP EA sample. The values of the
genomic control λ are also shown. ... 45 3.7 Quantile-quantile plots for the MB tests based on the
MLE and LS methods in the analysis of the LDL data in the TDS study only and in all four studies included in the NHLBI ESP EA sample. The values of the
3.8 Quantile-quantile plots for the SKAT tests based on the MLE and LS methods in the analysis of the LDL data in the TDS study only and in all four studies
included in the NHLBI ESP EA sample... 47 3.9 Quantile-quantile plots for the T1, T5, and SKAT
tests of the global null hypothesis in the NHLBI ESP EA sample. The values of the genomic control λ are
also shown for the T1 and T5 tests. ... 48 4.10 Quantile-quantile plots for the analysis of the BP study
in the NHLBI ESP using the SMLE method with
dif-ferent numbers of sieve regions... 81 4.11 Quantile-quantile plots for the analysis of the BP study
in the NHLBI ESP using the SMLE and MLE0
meth-ods. ... 82 4.12 Quantile-quantile plots for the analysis of the LDL
study in the NHLBI ESP using the SMLE method
with dierent numbers of sieve regions. ... 84 4.13 Quantile-quantile plots for the analysis of the LDL
study in the NHLBI ESP using the SMLE and MLE0
CHAPTER 1: INTRODUCTION
In epidemiological studies, the outcomes of interest (e.g, anthropometry measurements, lipids levels, or disease status) and demographical and environmental variables (e.g., age, gender, and smoking status) are typically available for all subjects. However, the covariates of main interest often involve genotyping, biomarker assay, or medical imaging and thus are prohibitively expensive to measure for all subjects, especially in a large study. If disease status or another discrete outcome is of primary interest, then the case-control design with an equal number of cases and controls is the most ecient one (Scott and Wild 1997). If a continuous outcome such as height is of primary interest, then a cost-eective strategy is the extreme-tail sampling design, whereby one selectively measures the expensive covariates only for subjects with extreme values of the primary outcome measure (Lin et al. 2013). In either case, the eciency of the design can be improved by stratifying on the inexpensive covariates.
The case-control and extreme-tail sampling designs can be viewed as special cases of the two-phase, outcome-dependent sampling design, which was rst introduced by White (1982). In the rst phase of such a design, the outcomes of interest and inexpensive covari-ates are observed for all study subjects; the information collected during the rst phase is then used to determine which subjects to include for measurements on expensive covariates during the second phase. This design greatly reduces the cost and other practical burdens associated with the collection of expensive covariate data and thus has been widely used in large epidemiological studies.
Institute (NHLBI) Exome Sequencing Project (ESP), where 4494 subjects from seven cohorts were selected for whole-exome sequencing (Lin et al. 2013). Among these subjects, 659, 806, and 657 were selected because of extremely high or low values of body mass index (BMI), blood pressure (BP) adjusted for age, gender, race, BMI, and anti-hypertensive medication, and low-density lipoprotein (LDL) adjusted for age, gender, race, and lipid medication, respectively.
CHAPTER 2: LITERATURE REVIEW
2.1 Introduction
Let Y denote the outcome of interest, X denote the vector of expensive covariates that is measured on a fraction of subjects in the study, Z denote the vector of inexpensive co-variates that is potentially correlated with X, and W denote the vector of inexpensive covariates that is known to be independent of X given Z. The data (Y,X,Z,W) are as-sumed to be generated from the joint distributionPθ(Y|X,Z,W)P(X|Z)P(Z,W), where
Pθ(Y|X,Z,W) is a parametric regression model indexed by parameter θ, P(X|Z) is the
conditional distribution ofX givenZ, andP(Z,W) is the joint distribution of Z and W. Under the two-phase design, (Y,Z,W) is measured for all n subjects in the rst phase, and X is measured for a sub-sample of size n2 in the second phase. Let R indicate, by the
values 1 versus 0, whether the subject is selected for the measurement of X in the second phase or not. The key assumption for any two-phase design is that the distribution of R depends on (Y,X,Z,W)only through the rst-phase data (Y,Z,W). Under this assump-tion, the data on X are missing at random, such that the sampling indicators (R1, . . . , Rn)
can be omitted from the likelihood function when estimating θ. Thus, the observed-data likelihood takes the form
n
Y
i=1
Pθ(Yi|Xi,Zi,Wi)P(Xi|Zi)
Ri log
ˆ
Pθ(Yi|x,Zi,Wi)P(x|Zi)dx
1−Ri
. (2.1)
depending on whether they used the rst-phase information for subjects not selected during the second-phase or not. Then, we review existing methods for multiple outcomes. Finally, we review existing literature on design eciencies of two-phase studies.
2.2 Methods for Analyzing Two-Phase Studies with a Single Outcome
2.2.1 Methods Using Second-Phase Subjects Only
If the rst-phase information is not available for subjects not selected during the second phase, then the resulting likelihood is
Y
i:Ri=1
P(Yi,Xi|Zi,Wi, Ri = 1)
= Y
i:Ri=1
Pθ(Yi|Xi,Zi,Wi)P(Xi|Zi)P(Ri = 1|Yi,Zi,Wi)
P(Ri = 1|Zi,Wi)
, (2.2)
where P(R = 1|Z,W) = ´ Pθ(y|x,Z,W)P(x|Z)P(R = 1|y,Z,W)dxdy. We can also
write down a conditional likelihood that does not involve P(x|Z):
Y
i:Ri=1
P(Yi|Xi,Zi,Wi, Ri = 1) =
Y
i:Ri=1
Pθ(Yi|Xi,Zi,Wi)P(Ri = 1|Yi,Zi,Wi)
P(Ri = 1|Xi,Zi,Wi)
, (2.3)
where P(R = 1|X,Z,W) = ´ Pθ(y|X,Z,W)P(R = 1|y,Z,W)dy. Note that when both
the outcome and inexpensive covariates are discrete, one can show that expression (2.3) is the semiparametric prole likelihood of θ obtained from expression (2.2) by using the maximization process employed in Wild (1991) and Scott and Wild (1997).
Estimators Based on the Prospective Likelihood
1|Yi,Zi,Wi) andP(Ri = 1|Zi,Wi) cancel out in the numerator and denominator of
expres-sion (2.3), and it is ecient to base inferences about θ on the prospective likelihood
Y
i:Ri=1
Pθ(Yi|Xi,Zi,Wi). (2.4)
If there are no inexpensive covariates (Z,W) and the second-phase sampling depends on a binary outcome, Anderson (1972) and Prentice and Pyke (1979) showed that standard logistic regression based on the prospective likelihood (2.4) gives valid inferences for all re-gression coecients except for the intercept. In fact, Prentice and Pyke (1979) showed that the prospective likelihood (2.4) is the prole likelihood of θ based on the conditional likeli-hood (2.2) with the marginal distribution of X maximized out nonparametrically. Unfortu-nately, this feature does not carry over to arbitrary regression models in general two-phase, outcome-dependent sampling studies. If the second-phase sampling depends on the outcome of interest, then estimators based on expressions (2.4) are generally biased.
Maximum Semiparametric Empirical Likelihood Estimator
When the outcome is continuous but the second-phase selection depends on a small number of strata, Zhou et al. (2002) proposed a maximum semiparametric empirical likeli-hood estimator based on maximizing expression (2.2). Suppose that the domain of Y can be partitioned into K mutually exclusive and exhaustive strata by the known constants −∞ = a0 < a1 < · < aK−1 < aK =∞. A simple random sample of size nk is drawn from
the kth stratum (k = 1, . . . , K) during the second phase. Assuming further that there are no inexpensive covariates, the conditional likelihood (2.2) can be rewritten as
K
Y
k=1 nk Y
j=1
Pθ(Ykj|Xkj)P(Xkj)
F(ak)−F(ak−1)
=
K
Y
nk
Y Pθ(Ykj|Xkj)
F(a |X )−F(a |X )
K
Y
nk Y
P(Xkj)
F(ak|Xkj)−F(ak−1|Xkj)
where (Ykj,Xkj) is the data for the jth subject in the kth stratum (k = 1, . . . , K, j =
1, . . . , nk), F(u) = P(Y ≤ u), and F(u|X) = P(Y ≤ u|X). To estimate θ, Zhou et al.
(2002) rst proled the likelihood function (2.5) by xing θ and obtaining the empirical likelihood function of P(X) over all distributions whose support contain the observed X values. They then maximized the resulting prole likelihood function with respect to θ.
Weighted Estimators
If every study subject have a positive probability of being selected during the second phase, then the Horvitz-Thompson approach (Horvitz and Thompson 1952) commonly used in survey sampling can be adopted (Hsieh et al. 1985, Scott and Wild 1986, Kalbeisch and Lawless 1988, Zhao and Lipsitz 1992, Whittemore 1997). If all variables had been fully ob-served for allnsubjects, then the log-likelihood function would bePn
i=1logPθ(Yi|Xi,Zi,Wi).
An estimate of this quantity is obtained if we use the completely observed units only and weight their contributions inversely according to their probability of selection, i.e.,
n
X
i=1
Ri
πi
logPθ(Yi|Xi,Zi,Wi), (2.6)
where π=P(R = 1|Y,Z,W). The Horvitz-Thompson estimator ofθ is based on maximiz-ing expression (2.6). It provides unbiased estimation of the overall association in all study subjects even when the regression model is misspecied. However, the Horvitz-Thompson estimator is inecient, especially when the inclusion probabilities are highly variable, which is usually the case for an ecient two-phase design.
Eciency can be improved by modifying the sampling weights. When the regression model is linear, Magee (1998) proposed to weight each subject selected during the second phase by{πaα(X,Z,W)}−1instead ofπ−1, whereaα(X,Z,W)belongs to a parameterized
for θ. Therefore, one can chose the optimal α that minimizes a scalar variance criterion such as the determinant or the trace of the asymptotic variance estimator. The choice of the function aα(X,Z,W) is up to the analyst but the obvious idea is to choose a function
that is believed to be approximately inversely proportional to the residual variance under the sample model.
Pfeermann and Sverchkov (1999) proposed another modication. They showed that
E(Y|X,Z,W) = E(π
−1Y|X,Z,W, R= 1)
E(π−1|X,Z,W, R= 1) ,
and proposed to use the weightπ−1/E(π−1|X,Z,W, R = 1). This weight accounts only for the aspect of the second-phase selection process that is not determined by the covariates in the regression model. Because of the reduced variation of the weights, the resulting estimator tends to be more powerful than the Horvitz-Thompson estimator.
2.2.2 Methods Using All Study Subjects Pseudo-Likelihood Estimators
If the rst-phase information is available for all study subjects, then it can be utilized to improve eciency. When the second-phase sampling is completely random or depends on the inexpensive covariates(Z,W)only, Pepe and Fleming (1991) and Carroll and Wand (1991) proposed to estimate θ by maximizing the likelihood
n
Y
i=1
Pθ(Yi|Xi,Zi,Wi)
Riˆ
Pθ(Yi|x,Zi,Wi)P(x|Zi)dx
1−Ri
, (2.7)
where P(x|Z) is estimated nonparametrically using the second-phase sample alone. If Z is discrete, then Pepe and Fleming (1991) estimated P(x|Z)by
b
P(x|Z) =Pb(x|Z, R= 1) = ( n
X
RiI(Xi =x,Zi =Z)
) , ( n X
RiI(Zi =Z)
)
IfZ contains continuous components, then Carroll and Wand (1991) estimatedP(x|Z)with kernel smoothing techniques. That is,
b
P(x|Z) = Pb(x|Z, R= 1) = Pn
i=1RiI(Xi =x)K(kZ−Zik/h)
Pn
i=1RiK(kZ−Zik/h)
, (2.9)
where K(·) is a symmetric density function and h is the bandwidth. In addition, for scaler Z, they obtained a representation for an optimal bandwidth through a detailed analysis of the mean-squared error of the parameter estimate.
Mean Score Estimator
When both the outcome and inexpensive covariates are discrete, Reilly and Pepe (1995) proposed a mean score estimator (MSE). It is based on solving the estimating equation
n
X
i=1
Rilθ(Yi|Xi,Zi,Wi) + n
X
i=1
(1−Ri)E{lθ(Yi|X,Zi,Wi)|Yi,Zi,Wi}= 0, (2.10)
where lθ(Y|X,Z,W) = ∂logPθ(Y|X,Z,W)/∂θ. Reilly and Pepe (1995) proposed
es-timating E{lθ(Y|X,Z,W)|Y,Z,W} for a subject not selected during the second phase
by ´ lθ(Y|x,Z,W)dPb(x|Y,Z), where Pb(x|Y,Z) is the empirical distribution of X given (Y,Z) in the second-phase sample. This purely empirical mean score approach is valid because P(X|Y,Z) =P(X|Y,Z, R= 1).
Maximum Likelihood Estimators Assuming Discrete First-Phase Information When both the outcome and inexpensive covariates are discrete, Scott and Wild (1997) proposed estimating θ by maximizing the full likelihood (2.1). This maximum likelihood estimator (MLE) is the most ecient among all valid estimators. Breslow and Holubkov (1997) considered the special case of logistic regression.
a small number of strata and then use the stratum membership to select subjects in the second phase. Specically, suppose that the range of (Y,Z,W) is partitioned intoK strata S1, . . . ,SK. The observed-data likelihood is
K
Y
j=1
Y
i∈Dj
Pθ(Yi|Xi,Zi,Wi)g(Xi,Zi,Wi)
Qj(θ, G)nj−n2j, (2.11)
where Qj(θ, G) = Pr{(Y,X,Z,W) ∈ Sj}, Dj = {i: (Y,X,Z,W) ∈ Sj, Ri = 1}, n2j =
|Dj|, nj is the total number of subjects in stratum Sj, j = 1, . . . , K, and G(·) and g(·)
are the distribution and density functions corresponding to (X,Z,W), respectively. From expression (2.11), we see that for subjects not selected in the second phase, only the stratum membership is used in the inference. Breslow et al. (2003) established the asymptotic prop-erties of the corresponding MLE. Note that the discretization of rst-phase data for subjects not selected during the second-phase entails a substantial loss of information and may even bias parameter estimation.
Pseudo-Score Estimators
To improve eciency, Chatterjee et al. (2003) proposed a pseudo-score estimator (PSE). It allows the outcome of interest to be continuous but require the inexpensive covariates to be discrete. This estimator ofθ is based on solving the estimating equation
n
X
i=1
Rilθ(Yi|Xi,Zi,Wi)
+
n
X
i=1
(1−Ri)
´
lθ(Yi|x,´ Zi,Wi)Pθ(Yi|x,Zi,Wi)P(x|Zi)dx
Pθ(Yi|x,Zi,Wi)P(x|Zi)dx
= 0, (2.12)
P(x|Z) 6= P(x|Z, R = 1), and one cannot use expression (2.8), as in Pepe and Fleming (1991), to estimate P(x|Z) anymore. From Bayes's theorem, if P(x|Z, R = 1) >0 almost surely, then
P(x|Z) = P(x|Z, R= 1)P(R = 1|Z,W)
P(R= 1|X =x,Z,W) , (2.13) where P(R = 1|X = x,Z,W) = ´ P(R = 1|y,Z,W)Pθ(y|X,Z,W)dy. Chatterjee et al.
(2003) proposed to estimate P(x|Z) by using expression (2.13), where P(x|Z, R = 1) is estimated by expression (2.8) and P(R = 1|Z,W) is ignored because it cancels out in the numerator and denominator of the second term in the left-hand side of expression (2.12).
In order to accommodate continuous covariates, Chatterjee and Chen (2007) considered the kernel smoothing approach similar to that considered by Carroll and Wand (1991). There are, however, some complications if the second-phase sampling depends onZ. Specically, if Z is partitioned into a xed number of strata, such that subjects are sampled with dierent selection probabilities across dierent strata during the second phase, then the discontinuity of the selection probabilities would cause the conditional expectation functionE(U|Z, R = 1) for a random variableU to have jumps between strata, even thoughE(U|Z)could be contin-uous and smooth in the whole range of Z. To account for these discontinuities, Chatterjee and Chen (2007) proposed to apply kernel smoothing within each partition ofZ separately. However, if the second-phase sampling depends on the partitions of the residuals calculated from the regression model relating Y to Z and W, then the corresponding partition of Z is hard to determine. In addition, it is dicult to calculate P(R = 1|X =x,Z,W) in this case. Consequently, the PSE method of Chatterjee and Chen (2007) is only applicable when the second-phase sampling depends on only discrete covariates.
Maximum Estimated Likelihood Estimator
Similar to the PSE method of Chatterjee et al. (2003), it allows the outcome of interest to be continuous but requires the inexpensive covariates to be discrete and the second-phase selection to depend on a small number of strata. The MELE of θ is based on maximizing expression (2.7), where P(x|Z)is estimated by
b
P(x|Z =zj) = K
X
k=1
b
Pk(x|Z =zj)
Nk(zj)
N(zj)
. (2.14)
Here
b
Pk(x|Z =zj) =
P
i∈SkRiI(Xi =xi,Zi =zj) P
i∈SkRiI(Zi =zj)
, k= 1, . . . , K, (2.15)
and Nk(zj) and N(zj) are the numbers of observations in the population and in the kth
stratum, respectively, that satisfy Z = zj. Simulation studies in Weaver and Zhou (2005)
showed that the MELE is consistently slightly less ecient than the PSE. However, they claimed that the MELE has computational advantages over the PSE.
Maximum Likelihood Estimator Assuming No Inexpensive Covariates
Both the PSE and MELE methods are statistically inecient. Song et al. (2009) and Lin et al. (2013) considered ecient estimation for two-phase studies without inexpensive covariates. In this case, the observed-data likelihood (2.1) reduces to
n
Y
i=1
Pθ(Yi|Xi)P(Xi)
Ri log
ˆ
Pθ(Yi|x)P(x)dx
1−Ri
. (2.16)
Song et al. (2009) and Lin et al. (2013) maximized expression (2.16) using the nonparametric maximum likelihood estimation, whereP(X)is estimated by the discrete probabilities at the observed values ofX. We denote this MLE approach by MLE0. If the inexpensive covariates
W, then the MLE0 method can be adopted by redening the expensive covariates as
(XT,ZT,WT)T and disregarding Z and W for subjects not selected in the second phase. This data reduction approach may entail a substantial loss of information. If the second-phase selection does depend onZ andW, then expression (2.16) no longer correctly reects the sampling mechanism, and the MLE0 method is generally biased.
Semiparametric Ecient Estimator
When every study subject have a positive probability of being selected during the second phase, Robins et al. (1995) derived the ecient score function Seff for general two-phase
studies with inexpensive covariates. Dene O ≡ (Y,Z,W), which is the rst-phase infor-mation. They showed that Seff =U(φop), where, for any function φ(o) taking values in Rd,
d is the dimension of θ,
U(φ) = U(1)+U(2)(φ),
U(1) =Rlθ(Y|X,Z,W)−RE{lθ(Y|X,Z,W)|X,Z, R = 1},
U(2)(φ) =−π−1RE{(1−π)φ(Y,Z,W)|X,Z,W}+ (1−R)φ(O),
and φop(O) is the unique solution to the functional equation
φ(O) =E{lθ(Y|X,Z,W)|O} −E
E{π(O)lθ(Y|X,Z,W)|X,Z,W}
E{π(O)|X,Z,W}
O
−E
E{(1−π(O))φ(O)|X,Z,W} E{π(O)|X,Z,W}
O
.
b
θ(φ,α)b solving
0 =n1/2U(θ, φ,¯ α) =b n−1/2
n
X
i=1
Ui(θ, φ,α),b
where αb satises
n
X
i=1
Sα,i(α) = 0,b
Sα(α) = ∂[Rlogπ(O;α) + (1−R) log{1−π(O;α)}]/∂α.
They showed that under certain regularity conditions, the estimator θ(φ,b α)b is consistent and asymptoticly normal. In addition, if φ = φop, then θ(φb op,α)b is asymptoticly ecient. However, because φop(O) depends on the unknown joint distribution of the data, θ(φb op,
b α)
cannot be used as a estimator. When both the outcome and the inexpensive covariates are discrete, Robins et al. (1995) proposed an adaptive semiparametric ecient estimator
b
θ(bφop,α)b by replacing the unknown φop(O) with a consistent estimator φbop(O). When the outcome of interest is continuous, however, this estimator is dicult to implement because it involves numerical solution of an innite dimensional integral equation.
2.3 Methods for Analyzing Multivariate Outcome-Dependent Sampling Studies
Weighted Estimator
communication, April 19, 2012). Eciency is a major concern in genetic association studies since many genetic eects are small and the correction for multiple comparisons is extremely severe for tens of thousands of variants. In addition, the Horvitz-Thompson approach is not applicable to the design where not every subject has positive probability of being selected during the second phase.
Univariate Analysis Plus Meta-Analysis
Analysis methods for two-phase designs with a single outcome, such as that of Lin et al. (2013), may be applied to the multivariate outcome-dependent sampling design. As men-tioned in Section 2.2.2, Lin et al. (2013) proposed a likelihood-based approach for the uni-variate outcome-dependent sampling design. They derived ecient estimators for both the primary trait, which is used for sampling, and the secondary trait, which is not used for sampling. Suppose that we wish to make inference on the rst trait under a multivariate TDS design withK traits. We can analyze the rst trait as the primary trait by treating the individuals with extreme values of the rst trait as sequenced individuals and all others as nonsequenced individuals. We can also analyze the rst trait as a secondary trait with each of the remaining (K −1) traits as the primary trait. We can then combine the summary statistics of the K analyses. This meta-analysis is not valid because it does not account for the correlations of the K statistics caused by overlapping individuals. To avoid overlaps of sequenced individuals, we let each individual be considered sequenced in only one analysis. This strategy, however, will introduce bias into the univariate analysis because the selection for one trait depends on other traits.
2.4 Design Eciency of Two-Phase Studies
Specically, suppose that the regression model isY =α+βX+, where∼N(0, σ2). It can
be shown that the conditional MLE is consistent and asymptotically equivalent to the full MLE. The information for the conditional MLE is approximately the conditional variance of the score function
X(Y −α−βG)
σ2 −E
X(Y −α−βG) σ2
Y ∈ C
(2.17)
given Y ∈ C, where C is the sampling set. After tedious calculation, this information can be expressed as
Var(Y|Y ∈ C)Var(G|Y ∈ C)/σ4+O(β). (2.18)
CHAPTER 3: ANALYSIS OF SEQUENCE DATA UNDER MULTIVARIATE TRAIT-DEPENDENT SAMPLING
3.1 Introduction
The past few years have seen progressive advances in high-throughput sequencing tech-nologies that allow the sequencing of genomic regions for association studies. However, the cost of performing high-throughput sequencing on a large number of individuals is still high and will likely remain so in the near future. If a quantitative trait is of primary interest, then a cost-eective strategy is to sequence individuals with the extreme trait values. This trait-dependent sampling (TDS) strategy can substantially increase statistical power when compared to a random sample of the same size (Allison 1997, Page and Amos 1999, Slatkin 1999, Chen et al. 2005, Huang and Lin 2007, Lin et al. 2013).
2014).
The NHLBI ESP European American (EA) sample consists of 2538 individuals who were selected for sequencing from six cohorts: ARIC, CHS, FHS, Coronary Artery Risk Development in Young Adults (CARDIA) study (Friedman et al. 1988), Multi-Ethnic Study of Atherosclerosis (MESA) (Bild et al. 2002), and Women's Health Initiative (WHI) (The Women's Health Initiative Study Group 1998). The project contains several studies, each of which was focused on a particular trait and some of which selected individuals with extreme values of quantitative traits, including low-density lipoprotein (LDL) and blood pressure (BP). The CHARGE-TSS involves three cohorts, ARIC, CHS and FHS, in which ∼200 individuals with extreme values from each of 14 traits, as well as a random sample of∼2000 individuals, were selected for sequencing at a total of 77 genomic loci that had been identied by genome-wide association studies (GWAS) to be associated with one or more traits (Lin et al. 2013).
Standard linear regression analysis based on least squares (LS) estimation only uses the sequenced individuals and treats them as if they were randomly selected from the whole cohorts. Thus, the multivariate TDS design is ignored with this approach. If the genetic variant of interest is independent of all the traits used in the sampling, then the LS method has correct type I error. If the genetic variant aects certain traits used in the sampling, however, then the LS method yields biased estimates of the genetic eects. The type I error for testing the genetic eect on one trait may also be inated if other traits that are used in sampling are aected by the genetic variant.
In the CHARGE-TSS, the selection of individuals with the extreme values of the pulmonary function was based on both the forced expiratory volume in the rst second (FEV1) and
the ratio of FEV1 to forced vital capacity (FEV1/FVC) (Lin et al. 2013). The univariate
approach is not applicable to this case because it does not allow the selection of an individual to depend on multiple traits. Another limitation of the univariate approach is that it cannot perform simultaneous inference on multiple traits.
3.2 Methods
Let Y ≡(Y1, . . . , YK)T be a K ×1 vector of quantitative traits, G be a d×1 vector of
genetic variables, andZ be a p×1vector of covariates (including the unit component). We relate Y to G and Z through the multivariate linear model:
Y =βG+γZ+, (3.19)
where β is a K ×d matrix of regression parameters for the genetic eects, γ is a K ×p matrix of regression parameters for the covariate eects, andis aK-variate normal random vector with mean 0 and covariance matrix Σ. In single-variant analysis, d = 1, and G is a scalar that codes the number of minor alleles the individual carries at the variant site under the additive model or indicates whether the individual carries any minor allele (or two minor alleles) at that site under the dominant (or recessive) model. In gene-level analysis for rare variants, G is a (weighted) sum of the numbers of mutations across multiple variant sites within a gene or the vector of genotypes for individual variants.
nonsequenced individuals, especially when multiple cohorts are involved, we require Z to be available only for the n sequenced individuals.
We arrange the records such that the rst n individuals are the sequenced ones and the remaining (N −n) are the nonsequenced ones. Then the data consist of (Yiobs,Zi,Gi) for
i= 1, . . . , nandYobs
i fori=n+ 1, . . . , N, whereYiobs is the observed part ofYi. We include
all the individuals with at least one nonmissing trait the largest possible sample in the analysis. We assume that the observations on Y are missing at random. We require Z to be completely observed for all sequenced individuals, which is the case in both the CHARGE-TSS and NHLBI ESP.
We representβ,γ, andΣbyθ. We show in Section 3.6 that the observed-data likelihood takes the form
n
Y
i=1
fθ(Yiobs|Zi,Gi)f(Zi,Gi)
N
Y
i=n+1
ˆ
z,g
fθ(Yiobs|z,g)dF(z,g), (3.20)
where fθ(·|z,g) is the joint density of Yobs conditional on (Z,G) = (z,g), f(·,·) is the
joint density of (Z,G), and F(·,·) is the distribution function of f(·,·). Note that we do not assume a specic form for f(·,·) in (3.20). Thus, f(·,·) is innite-dimensional when Z contains continuous covariates. We estimate f(·,·) by the discrete probabilities at the observed distinct values of (Zi,Gi), i= 1, . . . , n, denoted by(z1,g1), . . . ,(zm,gm), m ≤n,
and maximize the above function over other parameters. Denote the point mass at (zj,gj)
as qj, j = 1, . . . , m. The objective function to be maximized is equivalent to
n
X
i=1
"
logfθ(Yiobs|Zi,Gi) + log m
X
j=1
I{(Zi,Gi) = (zj,gj)}qj
#
+
N
X
i=n+1
log
m
X
j=1
fθ(Yiobs|zj,gj)qj, (3.21)
We present in Section 3.7.2 a novel EM algorithm for maximizing (3.21) that is compu-tationally ecient and numerically stable. In addition, we prove in Section 3.7.3 that the resulting maximum likelihood estimators (MLEs) are consistent, asymptotically normal, and asymptotically ecient. Thus, the corresponding association tests have correct type I error and are the most powerful of all valid tests.
Inferences about the genetic eects on the traits of interest are exible under our likeli-hood framework, as detailed in Section 3.7.4. For single-variant analysis, G is a scalar, and βreduces to a K×1vector. We can use the Wald, score, or likelihood ratio statistics to test any subset ofβ. The Wald tests are the most ecient computationally because we only need to t the model once no matter how many and what kind of hypotheses we are interested in; to perform the score or likelihood ratio tests, we need to obtain the restricted MLEs under each null hypothesis. For variants with moderate minor allele frequencies (MAFs), the three types of tests give similar results.
To perform a burden test for rare variants, we dene Gas the total number of mutations among variants whose MAFs are below a pre-specied threshold, such as 1% or 5%, with the corresponding tests denoted by T1 and T5, respectively; alternatively, we dene G as a weighted sum of the mutation counts, using weights such as those dened by Madsen and Browning (2009) to reect each variant's MAF, with the corresponding test denoted by MB. For detecting variants with opposite eects on the traits, we extend the sequence kernel association test (SKAT) (Wu et al. 2011) to the multivariate TDS setting. We can test the null hypothesis that there is no genetic eect on a particular trait or the global null hypothesis that there is no genetic eect on any trait. All our gene-level tests are based on the score statistics, which are statistically more accurate and numerically more stable than the Wald statistics for rare variants (Lin and Tang 2011).
the secondary trait, which is not used for sampling. Suppose that we wish to make inference on the rst trait under a multivariate TDS design with K traits. We can analyze the rst trait as the primary trait by treating the individuals with extreme values of the rst trait as sequenced individuals and all others as nonsequenced individuals. We can also analyze the rst trait as a secondary trait with each of the remaining (K−1)traits as the primary trait. We can then combine the summary statistics of the K analyses. This meta-analysis is not valid because it does not account for the correlations of the K statistics caused by overlapping individuals. To avoid overlaps of sequenced individuals, we let each individual be considered sequenced in only one analysis. This strategy, however, will introduce bias into the univariate analysis because the selection for one trait depends on other traits. We label these two methods as (a) and (b), respectively.
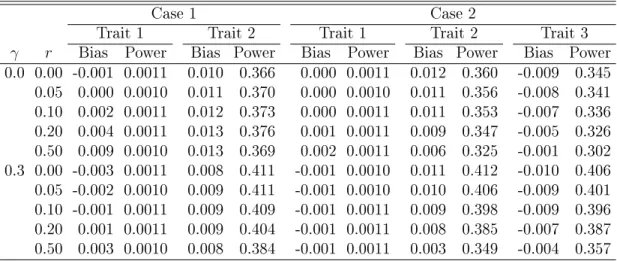
For the design that contains a random sample, such as the one-tail design adopted by the CHARGE-TSS, each individual in the cohort has a positive probability of being selected. Then the inverse probability weighting (IPW) method commonly used in survey sampling can be adopted. The IPW method avoids the joint modeling of the traits and thus can handle quantitative, binary, and censored traits simultaneously. It yields unbiased eect estimation and correct type I error. Such weighting methods, however, are substantially less ecient than the LS method (T. Lumley, personal communication, April 19, 2012). Eciency is a major concern in association studies since many genetic eects are small and the correction for multiple comparisons is extremely severe for tens of thousands of variants. In addition, IPW is not applicable to the design that does not contain a random sample.
3.3 Simulation Studies
extreme trait values than the latter. Thus, we designed our simulation studies to mimic the ARIC data in the CHARGE-TSS.
We generated 11 traits from the multivariate linear model given in (3.19) in whichGis the number of minor alleles for a SNP with MAF of 0.1,Z is a normally distributed confounder (representing a PC for ancestry or some other genetically related variable) with mean G and unit variance, and the error terms are multivariate normal with mean 0, variances 1, and correlations r under compound symmetry. (The Pearson correlation between G and Z is ∼0.17.) We generated a cohort of 9000 individuals and selected individuals for sequencing as follows: we rst selected a random sample of 1000 individuals; we then selected 100 individuals with the largest values of Y1 from the remaining 8000 individuals; and we
continued to select 100 individuals with the largest values of Y2 from the remaining 7900
individuals, and so on, until we reached a sequenced sample of 2100 individuals. We set β1 = 0and considered two cases of non-zero eects for the other10traits: Case 1. ve traits
with the same eect, i.e., β2 = · · · = β6 = 0.2, β7 = · · · = β11 = 0; and Case 2. six traits
with opposite eects, i.e., β2 = β4 = β6 = 0.2, β3 = β5 = β7 = −0.2, β8 = · · · = β11 = 0.
The value of 0.2 forβ corresponds toR2 of0.7%and4.0%underγ =0 and 0.3, respectively; the value of −0.2 corresponds to R2 of 0.7% and 0.2% under γ = 0 and 0.3, respectively. We assessed the bias, type I error, and power of the MLE and LS methods. The nominal signicance level α was set to0.001. All results are based on 100,000 replicates.
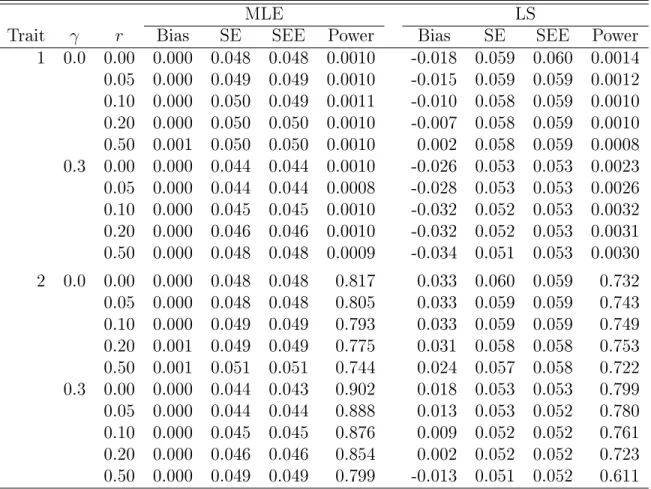
Table 3.1 shows the results for trait 1 (null eect) and trait 2 (positive eect) in Case 1. The MLE method provides unbiased estimation of genetic eects and correct type I error. The LS method is approximately unbiased forβ1 when the confounder has no eect and the
traits are strongly correlated, and it has a negative bias for β1 when there is confounding or
the traits are weakly correlated or independent. When the confounder has no eect, the LS method substantially overestimates β2. The bias is larger when the correlations are lower.
are weakly correlated or independent, the LS method yields highly inated type I error, whether or not the confounder has an eect. The type I error is also inated when the traits are strongly correlated and the confounder has an eect. The MLE method is more powerful than the LS method because its standardized test statistic tends to be larger. The largest power dierence is0.188underγ = 0.3and r= 0.5. The MLE method always yields smaller root mean squared error (RMSE) than the LS method (see Table 3.2).
Table 3.1: Simulation Results for Estimating the Genetic Eects on Trait 1 (Null Eect) and Trait 2 (Positive Eect) in Case 1, Five Traits with the Same Eect
MLE LS
Trait γ r Bias SE SEE Power Bias SE SEE Power
1 0.0 0.00 0.000 0.048 0.048 0.0010 -0.018 0.059 0.060 0.0014 0.05 0.000 0.049 0.049 0.0010 -0.015 0.059 0.059 0.0012 0.10 0.000 0.050 0.049 0.0011 -0.010 0.058 0.059 0.0010 0.20 0.000 0.050 0.050 0.0010 -0.007 0.058 0.059 0.0010 0.50 0.001 0.050 0.050 0.0010 0.002 0.058 0.059 0.0008 0.3 0.00 0.000 0.044 0.044 0.0010 -0.026 0.053 0.053 0.0023 0.05 0.000 0.044 0.044 0.0008 -0.028 0.053 0.053 0.0026 0.10 0.000 0.045 0.045 0.0010 -0.032 0.052 0.053 0.0032 0.20 0.000 0.046 0.046 0.0010 -0.032 0.052 0.053 0.0031 0.50 0.000 0.048 0.048 0.0009 -0.034 0.051 0.053 0.0030 2 0.0 0.00 0.000 0.048 0.048 0.817 0.033 0.060 0.059 0.732 0.05 0.000 0.048 0.048 0.805 0.033 0.059 0.059 0.743 0.10 0.000 0.049 0.049 0.793 0.033 0.059 0.059 0.749 0.20 0.001 0.049 0.049 0.775 0.031 0.058 0.058 0.753 0.50 0.001 0.051 0.051 0.744 0.024 0.057 0.058 0.722 0.3 0.00 0.000 0.044 0.043 0.902 0.018 0.053 0.053 0.799 0.05 0.000 0.044 0.044 0.888 0.013 0.053 0.052 0.780 0.10 0.000 0.045 0.045 0.876 0.009 0.052 0.052 0.761 0.20 0.000 0.046 0.046 0.854 0.002 0.052 0.052 0.723 0.50 0.000 0.049 0.049 0.799 -0.013 0.051 0.052 0.611 NOTE: SE and SEE stand for standard error and standard error estimate, respec-tively.
Table 3.2: Percentage of Bias and RMSE for Estimating the Genetic Eects on Trait 2 (Positive Eect) in Case 1, and Traits 2 (Positive Eect) and 3 (Negative Eect) in Case 2 Under the One-Tail Design
Case 1: trait 2 Case 2: trait 2 Case 2: trait 3
γ r Bias RMSE Bias RMSE Bias RMSE Bias RMSE Bias RMSE Bias RMSE
0.0 0.00 0.2% 0.067 16.5% 0.091 0.2% 0.069 26.0% 0.102 0.2% 0.071 22.2% 0.097 0.05 0.2% 0.068 16.5% 0.090 0.2% 0.069 24.2% 0.099 0.1% 0.072 20.5% 0.095 0.10 0.2% 0.069 16.3% 0.089 0.2% 0.070 22.4% 0.097 0.1% 0.072 18.8% 0.093 0.20 0.3% 0.070 15.5% 0.088 0.3% 0.071 19.0% 0.093 0.0% 0.072 15.5% 0.089
0.50 0.3% 0.072 12.1% 0.085 0.3% 0.071 10.2% 0.086 0.0% 0.071 7.3% 0.085
0.3 0.00 0.1% 0.061 8.9% 0.077 0.1% 0.063 18.5% 0.085 0.1% 0.064 23.3% 0.089
0.05 0.1% 0.063 6.7% 0.076 0.1% 0.064 15.4% 0.082 0.1% 0.065 23.3% 0.089
0.10 0.1% 0.063 4.7% 0.075 0.2% 0.064 12.6% 0.080 0.1% 0.065 23.3% 0.089
0.20 0.2% 0.065 1.0% 0.073 0.2% 0.066 7.4% 0.077 0.1% 0.067 22.8% 0.088
0.50 0.2% 0.069 6.6% 0.074 0.2% 0.069 4.1% 0.075 0.0% 0.068 19.7% 0.084
NOTE: RMSE stands for root mean squared error.
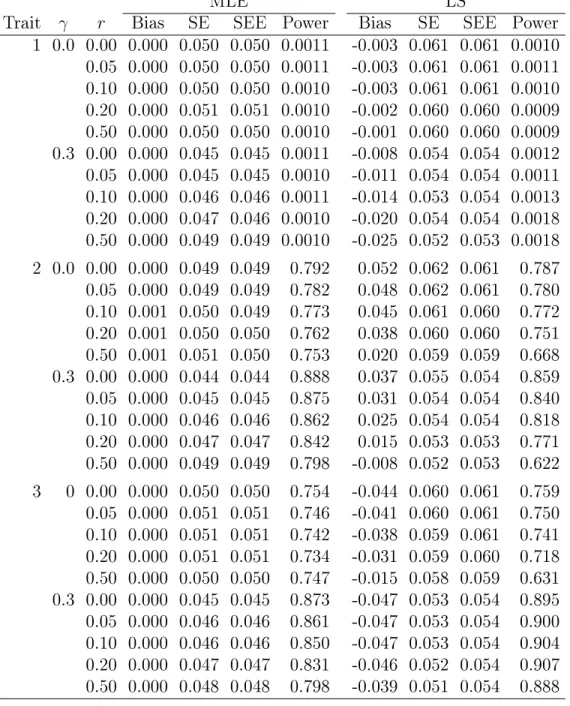
genetic eects and correct type I error. The LS method tends to overestimate the eect on trait 2 and underestimate the eect on trait 3, and the bias can be as high as 26%, which is higher than in Case 1. The LS method also has inated type I error (as high as 80%) when there is confounding. When the confounder has no eect, the LS method generally has correct type I error, although it is not as powerful as the MLE method; the power dierences are larger when the correlations are higher, which is opposite to what we nd in Case 1. The MLE method always yields smaller root mean squared error (RMSE) than the LS method (see Table 3.2). For both Case 1 and Case 2, we conducted other simulations with larger genetic eects and lower MAFs or with 10% random missingness in all traits. The results are similar to those of Tables 3.1 and 3.3 and thus not shown.
Table 3.3: Simulation Results for Estimating the Genetic Eects on Trait 1 (Null Eect), Trait 2 (Positive Eect), and Trait 3 (Negative Eect) in Case 2, Six Traits with Opposite Eects
MLE LS
Trait γ r Bias SE SEE Power Bias SE SEE Power 1 0.0 0.00 0.000 0.050 0.050 0.0011 -0.003 0.061 0.061 0.0010 0.05 0.000 0.050 0.050 0.0011 -0.003 0.061 0.061 0.0011 0.10 0.000 0.050 0.050 0.0010 -0.003 0.061 0.061 0.0010 0.20 0.000 0.051 0.051 0.0010 -0.002 0.060 0.060 0.0009 0.50 0.000 0.050 0.050 0.0010 -0.001 0.060 0.060 0.0009 0.3 0.00 0.000 0.045 0.045 0.0011 -0.008 0.054 0.054 0.0012 0.05 0.000 0.045 0.045 0.0010 -0.011 0.054 0.054 0.0011 0.10 0.000 0.046 0.046 0.0011 -0.014 0.053 0.054 0.0013 0.20 0.000 0.047 0.046 0.0010 -0.020 0.054 0.054 0.0018 0.50 0.000 0.049 0.049 0.0010 -0.025 0.052 0.053 0.0018 2 0.0 0.00 0.000 0.049 0.049 0.792 0.052 0.062 0.061 0.787 0.05 0.000 0.049 0.049 0.782 0.048 0.062 0.061 0.780 0.10 0.001 0.050 0.049 0.773 0.045 0.061 0.060 0.772 0.20 0.001 0.050 0.050 0.762 0.038 0.060 0.060 0.751 0.50 0.001 0.051 0.050 0.753 0.020 0.059 0.059 0.668 0.3 0.00 0.000 0.044 0.044 0.888 0.037 0.055 0.054 0.859 0.05 0.000 0.045 0.045 0.875 0.031 0.054 0.054 0.840 0.10 0.000 0.046 0.046 0.862 0.025 0.054 0.054 0.818 0.20 0.000 0.047 0.047 0.842 0.015 0.053 0.053 0.771 0.50 0.000 0.049 0.049 0.798 -0.008 0.052 0.053 0.622 3 0 0.00 0.000 0.050 0.050 0.754 -0.044 0.060 0.061 0.759 0.05 0.000 0.051 0.051 0.746 -0.041 0.060 0.061 0.750 0.10 0.000 0.051 0.051 0.742 -0.038 0.059 0.061 0.741 0.20 0.000 0.051 0.051 0.734 -0.031 0.059 0.060 0.718 0.50 0.000 0.050 0.050 0.747 -0.015 0.058 0.059 0.631 0.3 0.00 0.000 0.045 0.045 0.873 -0.047 0.053 0.054 0.895 0.05 0.000 0.046 0.046 0.861 -0.047 0.053 0.054 0.900 0.10 0.000 0.046 0.046 0.850 -0.047 0.053 0.054 0.904 0.20 0.000 0.047 0.047 0.831 -0.046 0.052 0.054 0.907 0.50 0.000 0.048 0.048 0.798 -0.039 0.051 0.054 0.888 NOTE: SE and SEE stand for standard error and standard error esti-mate, respectively.
Table 3.4: Simulation Results for the IPW Method Under the One-Tail Design
Case 1 Case 2
Trait 1 Trait 2 Trait 1 Trait 2 Trait 3
γ r Bias Power Bias Power Bias Power Bias Power Bias Power
0.0 0.00 -0.001 0.0011 0.010 0.366 0.000 0.0011 0.012 0.360 -0.009 0.345
0.05 0.000 0.0010 0.011 0.370 0.000 0.0010 0.011 0.356 -0.008 0.341
0.10 0.002 0.0011 0.012 0.373 0.000 0.0011 0.011 0.353 -0.007 0.336
0.20 0.004 0.0011 0.013 0.376 0.001 0.0011 0.009 0.347 -0.005 0.326
0.50 0.009 0.0010 0.013 0.369 0.002 0.0011 0.006 0.325 -0.001 0.302
0.3 0.00 -0.003 0.0011 0.008 0.411 -0.001 0.0010 0.011 0.412 -0.010 0.406 0.05 -0.002 0.0010 0.009 0.411 -0.001 0.0010 0.010 0.406 -0.009 0.401 0.10 -0.001 0.0011 0.009 0.409 -0.001 0.0011 0.009 0.398 -0.009 0.396 0.20 0.001 0.0011 0.009 0.404 -0.001 0.0011 0.008 0.385 -0.007 0.387 0.50 0.003 0.0010 0.008 0.384 -0.001 0.0011 0.003 0.349 -0.004 0.357
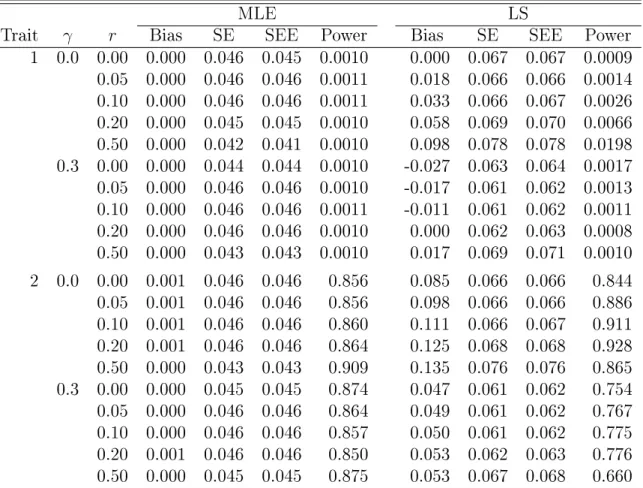
We also conducted simulation studies under the two-tail design. Specically, we generated the cohort in the same manner as in the previous simulation studies but sequentially selected 95 individuals from the upper and lower tails of each trait distribution to reach a sequenced" sample of 2090 individuals. The results that are analogous to those shown in Tables 3.1 and 3.3 are summarized in Tables 3.5 and 3.6. The MLE method continues to perform well. Because the two-tail sampling is more extreme than the one-tail sampling used in the previous simulation studies, the LS method tends to yield more bias. The loss of power by the LS method compared to the MLE method tends to be more severe under the two-tail design than under the one-tail design (with maximal dierences of 0.583 vs. 0.188). In addition, the MLE method is generally more powerful under the two-tail design than under the one-tail design (with the power dierence being as high as 0.184).
Table 3.5: Simulation Results for Estimating the Genetic Eects on Trait 1 (Null Eect) and Trait 2 (Positive Eect) in Case 1 Under the Two-Tail Design
MLE LS
Trait γ r Bias SE SEE Power Bias SE SEE Power
Table 3.6: Simulation Results for Estimating the Genetic Eects on Trait 1 (Null Eect), Trait 2 (Positive Eect), and Trait 3 (Negative Eect) in Case 2 Under the Two-Tail Design
MLE LS
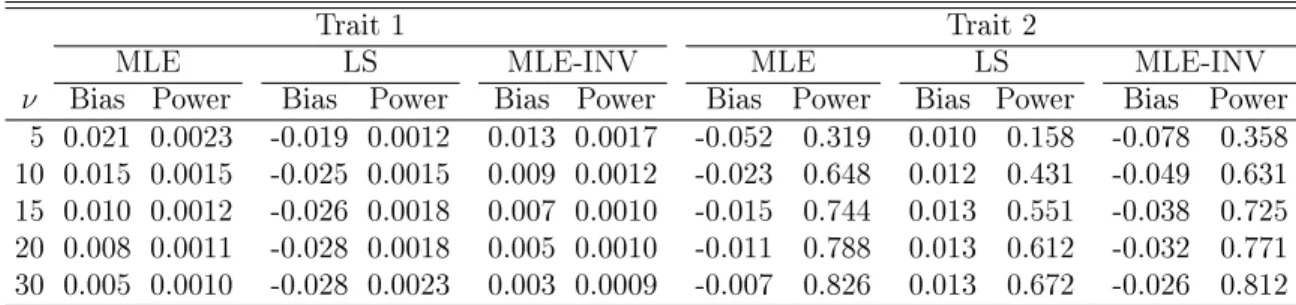
Table 3.7: Simulation Results for Estimating the Genetic Eects on Trait 1 (Null Eect) and Trait 2 (Positive Eect) in Case 1 When the Traits Follow MultivariateT Distributions
Trait 1 Trait 2
MLE LS MLE-INV MLE LS MLE-INV
ν Bias Power Bias Power Bias Power Bias Power Bias Power Bias Power
5 0.021 0.0023 -0.019 0.0012 0.013 0.0017 -0.052 0.319 0.010 0.158 -0.078 0.358 10 0.015 0.0015 -0.025 0.0015 0.009 0.0012 -0.023 0.648 0.012 0.431 -0.049 0.631 15 0.010 0.0012 -0.026 0.0018 0.007 0.0010 -0.015 0.744 0.013 0.551 -0.038 0.725 20 0.008 0.0011 -0.028 0.0018 0.005 0.0010 -0.011 0.788 0.013 0.612 -0.032 0.771 30 0.005 0.0010 -0.028 0.0023 0.003 0.0009 -0.007 0.826 0.013 0.672 -0.026 0.812
designs are much more ecient than simple random sampling.
To assess the robustness to the normality assumption, we simulated data in the setup of Case 1 under the one-tail design but let follow a multivariate t distribution tν(0,Σ),
where Σis the scale matrix, and ν is the degrees of freedom. We set γ = 0.3 and r = 0.05. We added a variation of the MLE method that applies the inverse normal transformation to the trait values, which is referred to as MLE-INV. The results are summarized in Table 3.7. The MLE method has appreciable bias and inated type I error for trait 1 (null eect) when ν is small but performs reasonably well when ν is moderate or large. The MLE-INV method has better control of the type I error than the MLE method when ν is small. The LS method is biased and its performance worsens as ν increases.
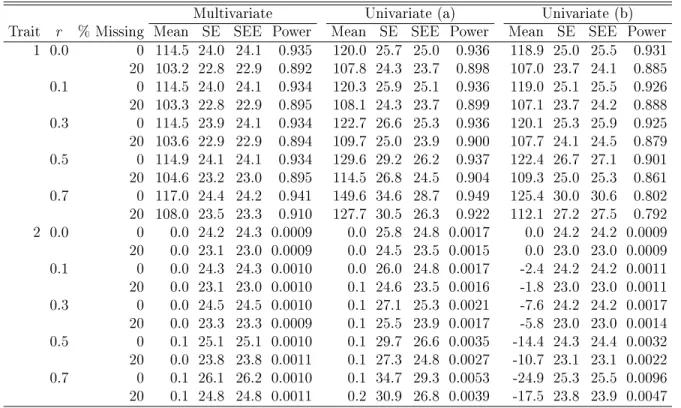
Table 3.8: Simulation Results for Comparing the Multivariate and Univariate Approaches
Multivariate Univariate (a) Univariate (b)
Trait r % Missing Mean SE SEE Power Mean SE SEE Power Mean SE SEE Power
1 0.0 0 114.5 24.0 24.1 0.935 120.0 25.7 25.0 0.936 118.9 25.0 25.5 0.931
20 103.2 22.8 22.9 0.892 107.8 24.3 23.7 0.898 107.0 23.7 24.1 0.885
0.1 0 114.5 24.0 24.1 0.934 120.3 25.9 25.1 0.936 119.0 25.1 25.5 0.926
20 103.3 22.8 22.9 0.895 108.1 24.3 23.7 0.899 107.1 23.7 24.2 0.888
0.3 0 114.5 23.9 24.1 0.934 122.7 26.6 25.3 0.936 120.1 25.3 25.9 0.925
20 103.6 22.9 22.9 0.894 109.7 25.0 23.9 0.900 107.7 24.1 24.5 0.879
0.5 0 114.9 24.1 24.1 0.934 129.6 29.2 26.2 0.937 122.4 26.7 27.1 0.901
20 104.6 23.2 23.0 0.895 114.5 26.8 24.5 0.904 109.3 25.0 25.3 0.861
0.7 0 117.0 24.4 24.2 0.941 149.6 34.6 28.7 0.949 125.4 30.0 30.6 0.802
20 108.0 23.5 23.3 0.910 127.7 30.5 26.3 0.922 112.1 27.2 27.5 0.792
2 0.0 0 0.0 24.2 24.3 0.0009 0.0 25.8 24.8 0.0017 0.0 24.2 24.2 0.0009
20 0.0 23.1 23.0 0.0009 0.0 24.5 23.5 0.0015 0.0 23.0 23.0 0.0009
0.1 0 0.0 24.3 24.3 0.0010 0.0 26.0 24.8 0.0017 -2.4 24.2 24.2 0.0011
20 0.0 23.1 23.0 0.0010 0.1 24.6 23.5 0.0016 -1.8 23.0 23.0 0.0011
0.3 0 0.0 24.5 24.5 0.0010 0.1 27.1 25.3 0.0021 -7.6 24.2 24.2 0.0017
20 0.0 23.3 23.3 0.0009 0.1 25.5 23.9 0.0017 -5.8 23.0 23.0 0.0014
0.5 0 0.1 25.1 25.1 0.0010 0.1 29.7 26.6 0.0035 -14.4 24.3 24.4 0.0032
20 0.0 23.8 23.8 0.0011 0.1 27.3 24.8 0.0027 -10.7 23.1 23.1 0.0022
0.7 0 0.1 26.1 26.2 0.0010 0.1 34.7 29.3 0.0053 -24.9 25.3 25.5 0.0096
20 0.1 24.8 24.8 0.0011 0.2 30.9 26.8 0.0039 -17.5 23.8 23.9 0.0047
NOTE: SE and SEE stand for the standard error and standard error estimate of the score statistic.
in method (b). The ination increases as the correlation between the two traits becomes stronger. There is power loss in (b) as compared to the multivariate approach, which is caused by the larger variances of the test statistics. The power dierence is larger when the correlation is higher and is not aected much by the level of missingness.
3.4 CHARGE-TSS ARIC Data
SNPs and 2003 individuals. Details for the design, sample selection criteria, genotype QC, and annotation can be found in Lin et al. (2013).
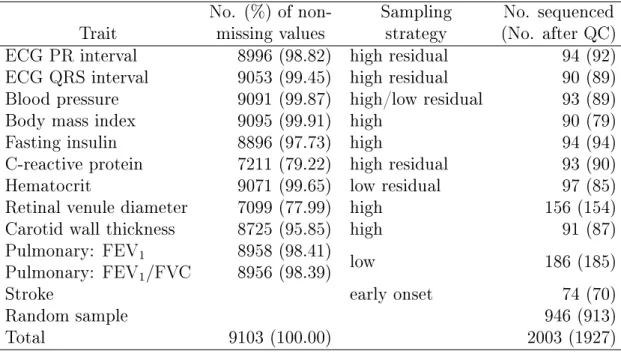
We removed individuals without PCs (calculated from GWAS data) and obtained 9103 individuals, among whom 1927 were sequenced. Table 3.9 shows the number of individuals with nonmissing trait values in the cohort, the specic sampling strategy, and the achieved number of extreme cases for sequencing, as well as that number after QC for each of the 11 traits. (Note that the numbers of extreme cases for all traits may add up to be greater than n since some individuals may have extreme values for multiple traits.) Of the 11 traits used for sampling, stroke is an age-at-onset trait that cannot be incorporated into our model. We treated the60individuals who were selected solely due to stroke as nonsequenced individuals. As noted before, the pulmonary function trait comprised two traits FEV1 and FEV1/FVC
such that the total number of traits entering into the analysis remained at 11. C-reactive protein (CRP) and retinal venule diameter have about20% missingness in the whole cohort, while all the other traits have less than 5% missingness.
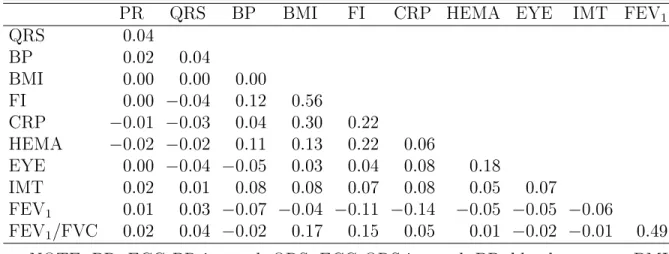
In the CHARGE-TSS, the selections for certain traits were based on the residuals of the original values adjusted for various covariates. For those traits, we used the residuals in the analysis. Most of the traits are positively correlated, and there is no pairwise correlation less than−0.15. The correlations are0.56between fast insulin and body mass index (BMI), 0.49 between the two pulmonary function traits, 0.30between BMI and CRP, and 0.22 between fast insulin and hematocrit, as well as between fast insulin and CRP. All the other positive correlations are well below 0.2, and many of them are essentially 0 (see Table 3.10). We included age, gender, study centers, and the top ve PCs as covariates.
Table 3.9: Summary of the ARIC Data in the CHARGE-TSS
No. (%) of non- Sampling No. sequenced Trait missing values strategy (No. after QC) ECG PR interval 8996 (98.82) high residual 94 (92) ECG QRS interval 9053 (99.45) high residual 90 (89) Blood pressure 9091 (99.87) high/low residual 93 (89)
Body mass index 9095 (99.91) high 90 (79)
Fasting insulin 8896 (97.73) high 94 (94)
C-reactive protein 7211 (79.22) high residual 93 (90)
Hematocrit 9071 (99.65) low residual 97 (85)
Retinal venule diameter 7099 (77.99) high 156 (154)
Carotid wall thickness 8725 (95.85) high 91 (87)
Pulmonary: FEV1 8958 (98.41) low 186 (185)
Pulmonary: FEV1/FVC 8956 (98.39)
Stroke early onset 74 (70)
Random sample 946 (913)
Total 9103 (100.00) 2003 (1927)
NOTE: For the sampling strategy, high" (low") means sampling from the upper (lower) tail of the trait distribution; residual" indicates that the sampling is based on the residuals of the original values adjusted for covariates.
eect estimates for SNPs with negative eects. This is similar to what we nd in most scenarios under Case 2 in the simulation studies. As shown in Figure 3.1 of the Supplemental Material, the p-values for the MLE and LS methods are similar.
0
1
2
3
4
0
1
2
3
4
−log
10(p-values) for the LS method
−
log
10
(p
-v
alues) f
or the MLE method
Table 3.10: Pairwise Correlations of the 11 Traits Used for Sampling in the CHARGE-TSS ARIC Data
PR QRS BP BMI FI CRP HEMA EYE IMT FEV1
QRS 0.04
BP 0.02 0.04
BMI 0.00 0.00 0.00
FI 0.00 −0.04 0.12 0.56
CRP −0.01 −0.03 0.04 0.30 0.22
HEMA −0.02 −0.02 0.11 0.13 0.22 0.06
EYE 0.00 −0.04 −0.05 0.03 0.04 0.08 0.18
IMT 0.02 0.01 0.08 0.08 0.07 0.08 0.05 0.07
FEV1 0.01 0.03 −0.07 −0.04 −0.11 −0.14 −0.05 −0.05 −0.06
FEV1/FVC 0.02 0.04 −0.02 0.17 0.15 0.05 0.01 −0.02 −0.01 0.49
NOTE: PR: ECG PR interval; QRS: ECG QRS interval; BP: blood pressure; BMI: body mass index; FI: fast insulin; CRP: C-reactive protein; HEMA: hematocrit; EYE: retinal venule diameter; IMT: carotid wall thickness; FEV1: forced expiratory
volume in 1 second; FVC: forced vital capacity.
samples.
3.5 NHLBI ESP EA Data
The NHLBI ESP EA data consist of the six cohorts mentioned previously and include four types of study designs. The rst study is a TDS study consisting of 872 individuals who were selected from the upper and lower tails of the LDL and BP distributions. The second study is a random sample of 721 individuals with measurements on a common set of phenotypes; this study is referred to as the deeply phenotyped reference (DPR). The third study is a case-control study of early myocardial infarction (MI) consisting of 220 cases and 390 controls. The fourth study is a case-only study of stroke consisting of 335 individuals with ischemic stroke. Exome sequencing was performed on the selected individuals at the University of Washington and the Broad Institute. We implemented the genotype QC steps described by Lin et al. (2013) and obtained 1,281,645 variants.
Table 3.11: Top 10 SNPs in the Single-Variant Analysis of the BMI Data in the CHARGE-TSS ARIC Sample
MLE LS
Variant ID Gene MAF Est SE p-value Est SE p-value
chr02:000649384 TMEM18 2.87E-01 1.12E-01 3.21E-02 4.89E-04 1.34E-01 4.04E-02 9.07E-04 chr02:000669959 TMEM18 2.98E-01 −1.06E-01 3.19E-02 8.79E-04 −1.34E-01 4.11E-02 1.09E-03
chr12:000547464 NINJ2 6.43E-02 −1.96E-01 5.92E-02 8.98E-04 −2.47E-01 7.41E-02 8.38E-04
chr01:068340029 WLS 4.94E-01 −9.41E-02 2.86E-02 9.93E-04 −1.17E-01 3.65E-02 1.36E-03
chr02:000648937 TMEM18 2.95E-01 1.01E-01 3.23E-02 1.72E-03 1.19E-01 4.07E-02 3.31E-03 chr02:000648595 TMEM18 3.00E-01 9.75E-02 3.19E-02 2.27E-03 1.15E-01 4.04E-02 4.43E-03 chr02:000645222 TMEM18 1.12E-01 −1.44E-01 4.74E-02 2.47E-03 −1.71E-01 5.96E-02 4.09E-03
chr02:000649218 TMEM18 2.60E-01 1.01E-01 3.36E-02 2.59E-03 1.23E-01 4.24E-02 3.76E-03 chr02:000647954 TMEM18 2.95E-01 9.83E-02 3.27E-02 2.61E-03 1.15E-01 4.10E-02 4.97E-03 chr02:000648157 TMEM18 2.99E-01 9.34E-02 3.20E-02 3.53E-03 1.10E-01 4.04E-02 6.35E-03 NOTE: Variant ID is in chromosome:position format, where the positions are based on the reference human genome (NCBI Genome Build 36, 2006). Est and SE stand for the genetic eect estimate and standard error, respectively.
not eligible for either the LDL or BP selection. In the FHS, which contains related individu-als, we removed one individual from each pair of rst- or second-degree relatives. The actual sample selections for LDL and BP were based on the residuals rather than the original val-ues. We used the LDL residuals (log-transformed LDL values adjusted for age, age-squared, gender, and lipid medication) and BP residuals (mean of the residuals for diastolic and systolic BPs adjusted for age, gender, BMI, and anti-hypertensive medication) as the trait values in the analysis. We considered LDL as the trait of interest and removed individuals with missing LDL values in the DPR, MI, and stroke studies. Note that individuals with missing LDL or BP values (but not both) were still included in the analysis of the TDS study. Table 3.14 summarizes the sample sizes of the four studies in each cohort after QC.
Table 3.12: Top Five Targeted Regions for the T1, T5, MB, and SKAT Tests in the Analysis of the BMI Data Using the MLE Method in the CHARGE-TSS ARIC Sample
Test Region MAC MLE p-value LS p-value
Table 3.13: Top Five Targeted Regions for the T1, T5, MB, and SKAT Tests of the Global Null Hypothesis in the CHARGE-TSS ARIC Sample
Test Region MAC p-value
Table 3.14: Sample Size Summary of the NHLBI ESP EA Data
With nonmissing LDL
LDL BP DPR MI Stroke Nonsequenced
ARIC 172 93 84 136 6 9553
CARDIA 14 66 32 0 0 1530
CHS 15 3 77 43 1 1186
FHS 12 52 34 147 15 2245
MESA 60 19 159 0 7 1310
WHI 46 8 286 156 49 5115
Total 319 241 672 482 78 20939
meta-analysis of the four studies using software MASS (Tang and Lin 2013).
We restricted the single-variant analysis to SNPs with MACs ≥ 5 and ended up with 109,607 SNPs. We chose the additive model and used score statistics to ensure numerical accuracy for SNPs with low MACs. Figure 3.2 shows the quantile-quantile plots using the MLE and LS methods in the TDS study only and in all four studies. Although the trends in the quantile-quantile plots of the TDS study appear to be similar between the MLE and LS methods, the MLE method clearly produces more signicant results than the LS method in the meta-analysis. Table 3.15 lists the top 10 SNPs for the MLE method in the meta-analysis. For the MLE method, the top SNP (chr19:45397229) in the meta-analysis is also the top SNP in the TDS study, with the p-value in the meta-analysis being much more signicant (2.08×10⁻¹⁰ vs. 2.64×10⁻⁷). For the LS method, although the top SNP remains the same, its p-value in the meta-analysis is less signicant than that in the TDS study (1.17×10⁻⁶ vs. 4.29×10⁻⁷).
Figure 3.2: Quantile-quantile plots for the single-variant analysis of the LDL data using the MLE and LS methods in the TDS study only and in all four studies included in the NHLBI ESP EA sample. The values of the genomic control λ, dened as the ratio between the observed median of the test statistics and the median of the χ2
1 distribution, are also shown.
Table 3.15: Top 10 SNPs in the Single-Variant Analysis of the LDL Data in the NHLBI ESP EA Sample
MLE LS
Variant ID Gene MAC All studies TDS study All studies TDS study chr19:045397229 TOMM40 132 2.08E-10 2.64E-07 1.17E-06 4.29E-07 chr01:109814880 CELSR2 538 6.48E-08 8.57E-05 3.51E-06 9.42E-05 chr12:101685691 UTP20 546 2.06E-07 2.45E-04 6.08E-06 2.10E-04 chr12:101685852 UTP20 548 4.85E-07 5.25E-04 7.53E-06 4.61E-04 chr12:101693534 UTP20 614 9.28E-07 1.62E-03 3.35E-06 1.44E-03 chr12:101776996 UTP20 554 1.09E-06 6.76E-04 1.85E-05 6.15E-04 chr19:002039746 MKNK2 9 2.66E-06 1.91E-06 1.20E-02 9.17E-06 chr07:121513561 PTPRZ1 492 1.57E-05 3.89E-03 5.87E-05 3.84E-03 chr01:186089112 HMCN1 916 1.73E-05 1.08E-04 4.28E-03 1.14E-04 chr12:101705477 UTP20 560 1.83E-05 3.67E-03 1.05E-04 3.55E-03 NOTE: Variant ID is in chromosome:position format, where the positions are based on the human reference sequence (UCSC Genome Browser, hg19).
estimates from the four studies yields less signicant results than the MLE meta-analysis. We also performed single-variant analysis in the TDS study using the univariate approach of Lin et al. (2013). Figure 3.4 compares the p-values for the multivariate and univariate methods. The two methods yield similar results for most SNPs. This is because the correla-tion between LDL and BP among individuals in the TDS study is only 0.01. Note that the multivariate approach produces a more signicantp-value for the top SNP (chr19:45397229) than the univariate approach does (2.64×10⁻⁷ vs. 1.24×10⁻⁵).
Table 3.16: Top 10 Genes for the T1 Tests in the Analysis of the LDL Data Using the MLE Method in the NHLBI ESP EA Sample
MLE LS
Gene MAC ALL studies TDS study ALL studies TDS study
LDLR 70 6.90E-07 2.12E-05 1.38E-04 2.39E-05
AZIN1 42 7.71E-05 1.96E-04 1.43E-02 2.12E-04
ACTL6A 54 1.52E-04 4.31E-03 1.74E-03 7.03E-03
PPP1R15A 59 2.20E-04 2.55E-03 4.53E-03 3.64E-03
ZFP91 14 2.46E-04 5.10E-04 5.06E-03 7.96E-04
MAGEB10 15 4.64E-04 2.30E-01 3.76E-05 2.28E-01
JAKMIP2 15 4.94E-04 5.07E-02 1.67E-03 6.11E-02
C14orf21 39 7.22E-04 4.64E-03 1.16E-02 5.69E-03
NCOA3 43 9.19E-04 2.29E-03 3.24E-02 3.01E-03
PHC2 28 1.06E-03 1.00E-01 1.37E-03 1.25E-01
3.6 Discussion
Multivariate TDS is a useful and cost-eective design when investigators are interested in multiple quantitative traits but cannot aord to sequence all cohort members. The CHARGE-TSS and NHLBI ESP are two recent examples of this design. It is not hard to envision that many large-scale whole-exome and whole-genome sequencing projects will adopt similar multivariate TDS designs. As demonstrated in the simulation studies and in the two real examples, standard linear regression without regard to the sampling design can result in estimation bias, type I error ination, and power loss, and the existing methods for univariate TDS have important limitations.
In this paper, we propose for the rst time a valid and ecient likelihood-based approach to making inferences under multivariate TDS, paying special attention to gene-level tests for rare variants. The methodology is very general and can be applied to both genetic and non-genetic studies. The proposed EM algorithm is stable and the software is available on our website.
Table 3.17: Top 10 Genes for the T5 Tests in the Analysis of the LDL Data Using the MLE Method in the NHLBI ESP EA Sample
MLE LS
Gene MAC ALL studies TDS study ALL studies TDS study
LDLR 70 6.90E-07 2.12E-05 1.38E-04 2.39E-05
AZIN1 42 7.71E-05 1.96E-04 1.43E-02 2.12E-04
ACTL6A 54 1.52E-04 4.31E-03 1.74E-03 7.03E-03
PPP1R15A 59 2.20E-04 2.55E-03 4.53E-03 3.64E-03
MAGEB10 17 4.05E-04 6.24E-01 2.22E-05 6.06E-01
IGSF1 117 4.21E-04 2.13E-02 3.18E-04 2.20E-02
JAKMIP2 15 4.94E-04 5.07E-02 1.67E-03 6.11E-02
C14orf21 41 5.42E-04 4.64E-03 8.33E-03 5.69E-03
TCF20 95 7.41E-04 5.62E-03 1.37E-02 5.90E-03
MACC1 143 7.54E-04 5.03E-03 1.07E-02 4.76E-03
Table 3.18: Top 10 Genes for the MB Tests in the Analysis of the LDL Data Using the MLE Method in the NHLBI ESP EA Sample
MLE LS
Gene MAC ALL studies TDS study ALL studies TDS studies
LDLR 70 1.19E-07 4.44E-06 1.59E-05 6.44E-06
SERPINB6 13 1.86E-04 4.43E-02 5.40E-04 7.81E-02
OSBPL11 11 2.41E-04 8.56E-04 1.45E-02 2.18E-03
ZFP91 123 2.51E-04 5.26E-04 6.39E-03 8.25E-04
EFEMP2 23 3.08E-04 8.67E-02 1.95E-04 8.92E-02
NLRC5 390 5.23E-04 1.11E-02 4.06E-03 1.52E-02
COBLL1 216 7.05E-04 1.88E-02 4.12E-03 2.72E-02
DSCC1 31 7.13E-04 8.94E-02 3.20E-04 1.08E-01
JAKMIP2 15 7.64E-04 5.07E-02 2.05E-03 6.11E-02