Published online 31 May 2016 in Wiley Online Library (wileyonlinelibrary.com)DOI:10.1002/path.4729
EGFR inhibitors identified as a potential treatment for chordoma
in a focused compound screen
Susanne Scheipl,1,2 Michelle Barnard,1,3,4 Lucia Cottone,1 Mette Jorgensen,1 David H Drewry,5,6 William J
Zuercher,5,6 Fabrice Turlais,3 Hongtao Ye,7 Ana P Leite,1 James A Smith,3 Andreas Leithner,2 Peter Möller,8
Silke Brüderlein,8 Naomi Guppy,9 Fernanda Amary,7 Roberto Tirabosco,7Sandra J Strauss,1 Nischalan Pillay1,7
and Adrienne M Flanagan1,7,9*
1 University College London Cancer Institute, London, UK
2 Department of Orthopaedics and Orthopaedic Surgery, Medical University of Graz, Austria 3 Cancer Research Technology Discovery Laboratories, Cambridge, UK
4 CRUK–MedImmune Alliance Laboratory, Cambridge, UK 5 GlaxoSmithKline, Research Triangle Park, NC, USA
6 SGC–UNC, UNC Eshelman School of Pharmacy, University of North Carolina at Chapel Hill, NC, USA 7 Department of Histopathology, Royal National Orthopaedic Hospital, Stanmore, UK
8 Institute of Pathology, Ulm University, Germany
9 University College London Advanced Diagnostics, London, UK
*Correspondence to: AM Flanagan, UCL Cancer Institute, 72 Huntley Street, London WC1E 6BT, UK. E-mail: [email protected]
Abstract
Chordoma is a rare malignant bone tumour with a poor prognosis and limited therapeutic options. We undertook a focused compound screen (FCS) against 1097 compounds on three well-characterized chordoma cell lines; 154 compounds were selected from the single concentration screen (1𝛍M), based on their growth-inhibitory effect. Their half-maximal effective concentration (EC50) values were determined in chordoma cells and normal fibroblasts. Twenty-seven of these compounds displayed chordoma selective cell kill and 21/27 (78%) were found to be EGFR/ERBB family inhibitors. EGFR inhibitors in clinical development were then studied on an extended cell line panel of seven chordoma cell lines, four of which were sensitive to EGFR inhibition. Sapitinib (AstraZeneca) emerged as the lead compound, followed by gefitinib (AstraZeneca) and erlotinib (Roche/Genentech). The compounds were shown to induce apoptosis in the sensitive cell lines and suppressed phospho-EGFR and its downstream pathways in a dose-dependent manner. Analysis of substituent patterns suggested that EGFR-inhibitors with small aniline substituents in the 4-position of the quinazoline ring were more effective than inhibitors with large substituents in that position. Sapitinib showed significantly reduced tumour growth in two xenograft mouse models (U-CH1 xenograft and a patient-derived xenograft, SF8894). One of the resistant cell lines (U-CH2) was shown to express high levels of phospho-MET, a known bypass signalling pathway to EGFR. Neither amplifications (EGFR, ERBB2, MET ) nor mutations in EGFR, ERBB2, ERBB4, PIK3CA, BRAF , NRAS, KRAS, PTEN, MET or other cancer gene hotspots were detected in the cell lines. Our findings are consistent with the reported (p-)EGFR expression in the majority of clinical samples, and provide evidence for exploring the efficacy of EGFR inhibitors in the treatment of patients with chordoma and studying possible resistance mechanisms to these compoundsin vitro and in vivo.
© 2016 The Authors.The Journal of Pathologypublished by John Wiley & Sons Ltd on behalf of Pathological Society of Great Britain and Ireland.
Keywords:chordoma; drug screen; EGFR; ERBB family; AZD8931; resistance
Received 19 November 2015; Revised 11 March 2016; Accepted 10 April 2016
Conflicts of interest: David H Drewry and William J Zuercher are former employees of GlaxoSmithKline; the other authors declare no conflicts of interest
Introduction
Chordoma is a rare primary malignant bone tumour showing notochordal differentiation and develops for the most part in the bones of the base of the skull, the vertebral bodies and the sacro-coccygeal region [1–3]. There are occasional reports of extra-axial and soft tissue lesions [1,4]. The median survival for patients with chordoma is 7 years [2,3]. Advances in radiation
technology with either particles or photons have allowed delivery of higher doses of radiation [2,3] and can be beneficial for local disease control. However, 30–40% of chordomas metastasise and there are no approved agents for the treatment of patients with inoperable and metastatic chordoma [3]. Cytotoxic chemotherapy is not active in this tumour type [3,5]. Imatinib, an inhibitor of platelet-derived growth factor receptor (PDGFR), has demonstrated limited activity in a phase II study
and when used in a compassionate programme [6,7]. However, there are encouraging results, in the form of anecdotal reports, on the response of chordoma to epidermal growth factor receptor (EGFR) [8–13] and vascular endothelial growth factor (VEGF) inhibitors [5,12–14], although data from prospective randomized clinical trials are lacking [5,14].
Chordoma is characterised by the expression of the transcription factor T (brachyury) [15] and there is a body of evidence supporting its critical role in this dis-ease [16]. Specifically, study of theTregulatory network revealed that epidermal growth factor (EGF), transform-ing growth factor-α(TGFα) and fibroblast growth factor 1 (FGF1) ligands, amongst others, are direct products of T-mediated transcription [17]. These findings are sup-ported by strong immuno-expression of the phosphory-lated proteins in chordoma [18–21].
Genotype-directed therapy represents a major strat-egy for planning new cancer treatments, and this has demonstrated success by improving outcome in close to 70% of patients with non-small cell lung cancer har-bouringEFGR mutations, albeit for 1–2 years before developing resistance [22]. However, despite chordomas being immunoreactive for the activated form of EGFR (p-EGFR), they do not harbour EGFR mutations and only infrequently other currently potentially tractable targets, such asPIK3CAmutations [18,23–25]. In view of the unmet need for effective treatment of patients with chordoma, we undertook a large-scale compound screen on three chordoma cell lines and validated the key tar-get in an extended panel of seven cell lines, with the aim of finding therapies and understanding the mecha-nism by which this disease develops. Such approaches are reported to be more successful than target-based approaches in identifying drug candidates with clini-cally relevant mechanisms of action [26–28].
Materials and methods
Cells and cell lines used in the screen
Seven human chordoma cell lines, U-CH1, U-CH2, U-CH7, U-CH10, MUG-Chor1, JHC7 and UM-Chor1, were studied (see supplementary material) and qual-ity controlled by short-tandem-repeat (STR) analysis (DNA Diagnostic Centre, London, UK) (see supplemen-tary material, Table S1) and regularMycoplasma test-ing [29–33]. In the absence of the availability of noto-chordal tissue, a transient embryonic structure consid-ered to represent the origin of chordoma [15], human dermal fibroblasts (ATCC®PCS-201-012™) were used as a non-neoplastic control cell population. NCI-N87 (ATCC®CRL-5822™), a gastric cancer cell line which strongly expresses EGFR and ERBB2 in the absence of downstream mutations [34,35], served as a posi-tive control to EGFR inhibitors. Cells were cultured according to ATCC guidelines (see supplementary mate-rial). All chordoma lines included derive from sacral tumours other than UM-Chor1 which derives from a
clival neoplasm (http://www.chordomafoundation.org/) [29–33]. Cell pellets from the chordoma cell lines were formalin-fixed and paraffin-embedded and 3μm sections cut for immunohistochemistry and FISH [18]. Ethi-cal approval was obtained from the Cambridgeshire 2 Research Ethics Service (reference 09/H0308/165) and the UCL Biobank for Health and Disease Ethics Com-mittee.
Protein kinase inhibitors and compound libraries
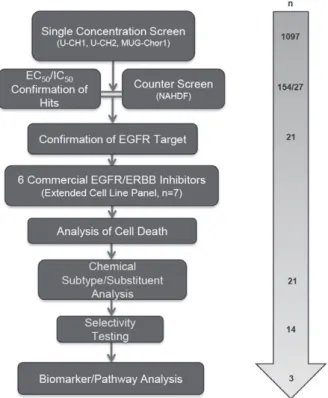
In collaboration with Cancer Research Technology Ldt UK (CRT), 1097 compounds were selected for the compound screen (see supplementary material, Table S2). GlaxoSmithKline (GSK) provided 886 small molecule kinase inhibitors comprising 365 (’PKIS’) and 521 (’PKIS2’) compounds on which there are published data (see supplementary material, Table S2) [36,37]. Also screened were 160 Calbiochem kinase inhibitors (Merck KGaA, Darmstadt, Germany) provided by CRT, an Anticancer Library (n=43) (Sel-leckchem, Houston, TX, USA), and eight compounds reported to be inhibitors of aldo-keto reductase family 1 member B10 (AKR1B10; Selleckchem) [38]. Six commercially available epidermal growth factor recep-tor/erythroblastic leukaemia viral oncogene homologue (EGFR/ERBB) family inhibitors, either FDA-approved or currently in clinical trials [39–42], were purchased [Selleckchem: erlotinib (OSI-774), gefitinib (ZD1839), sapitinib (AZD8931), afatinib (BIBW 2992), pozi-otinib (NOV120101; HM781-36B)] and lapatinib (Tykerb®; GSK).Focused compound screen (Figure 1)
Compounds were tested on three chordoma cell lines (U-CH1, U-CH2 and MUG-Chor1) using a non-randomised plate layout in a 96-well plate format (80 compounds/plate) at a single concentration of 1μM (n=3 minimum). Cells were seeded in medium (90μl/well) using a Multidrop Combi (MDC; Thermo Fisher Scientific, Loughborough, UK) and cultured for 24 h before the compounds were added. The com-pounds were diluted from 10 mM stocks using an ECHO 550 (Labcyte, CA, USA) to create 10× com-pound plates and added (10μl/well) using a Biomek FX (Beckman Coulter, Brea, CA, USA). Cell survival was assessed following 96 h of compound treatment using the water-soluble tetrazolium salt (WST1) assay (Roche Diagnostics, Burgess Hill, UK) according to the manufacturer’s recommendations.
Hit selection
Figure 1.An overview of the screening cascade
PKIS2). From this, the standard deviations (SDs) were calculated for each cell line. Based on the spread of data, a threshold of 2×SD (PKIS) and 1.5×SD (other libraries) was applied for each line.
Hit confirmation
The ‘hits’ of the single concentration screen and their potencies were generated using the half-maximal effec-tive concentration (EC50) in a 10-point dose–response format, with the highest concentration at 30μM. Max-imum percentage inhibition (MI) was recorded at the highest concentration of each compound. Each com-pound was tested in three independent experiments with two replicates/experiment. Staurosporine (SRPN; Sigma-Aldrich, St. Louis, MO, USA) was used as a positive control, with EC50 values monitored to ensure reproducibility between each run. An arbitrary thresh-old of EC50<5μMin chordoma cell lines and>10μM in dermal fibroblasts was applied to select compounds which selectively killed chordoma cells. Selectivity was defined as the fold difference between a compound’s EC50in fibroblasts and chordoma cells.
Hit validation
Analysis of cell deathThe Caspase-Glo® 3/7 Assay (Promega, Southampton, UK) and the CellTiter-Glo® Luminescent Cell Viabil-ity Assay (Promega) were used on separate assay plates to monitor cell viability and to determine induction of apoptosis. Profiling was conducted from the highest concentration (20μM) in a dose-dependent manner with
a 1:3 serial dilution (minimum two independent experi-ments/compound). Data analyses were performed using XLfit v. 5.0 (IDBS, Guildford, UK).
Biochemical selectivity analysis
Eleven GSK compounds in addition to sapitinib, erlotinib and gefitinib (Selleckchem) were sent for biochemical IC50determination against EGFR, ERBB2 and ERBB4 (Reaction Biology Corp., Malvern, PA, USA) (see supplementary material, Table S3).
Protein extraction and western blot (WB) analysis
Details of these methods are described in Supplementary materials and methods and primary and secondary anti-bodies are listed in Table S4 (see supplementary material for both).ELISA
Lysates were prepared and experiments performed using Human Total EGFR (cat. no. DYC1854) and Human Phospho-EGFR (cat. no. DYC1095B) ELISA kits (R&D Systems, Abingdon, UK).
Combination study of sapitinib with the MET
inhibitor crizotinib
The MET inhibitor crizotinib (Xalkori®, Pfizer, NY, USA) was tested in combination with sapitinib using a non-randomized plate layout in a 384-well format. Details of this experiment are described in Supple-mentary materials and methods (see suppleSupple-mentary material).
Immunohistochemistry
Immunohistochemistry was performed on the Leica Bond-III detection platform, using the Bond Polymer Refine Detection system (Leica). Expression was evalu-ated as reported previously (see supplementary material) [18].
FISH analysis of EGFR, ERBB2 and MET
FISH was performed using commercial probes for
EGFR/CEP7, HER-2/CEP17 (Abbott Molecular,
Des Plaines, IL, USA) and MET/CEN7 (Zytovision, Bremerhaven, Bremen, Germany) and reported using the Colorado criteria (see supplementary material) [18].
Analysis for mutations in cancer gene hotspots
of chordoma cell lines
The hotspots in 22 cancer-related genes were analysed for mutations using the Ion AmpliSeq™ Colon and Lung Cancer Research Panel v. 2 (Thermo Scientific) (see supplementary material).
In vivo studies
Sapitinib (AstraZeneca, Cambridge, UK) was tested at South Texas Accelerated Research Therapeutics (START) on two chordoma mouse models: one model was a cell line-derived xenograft (U-CH1) [32], the other a patient-derived xenograft (SF8894) [43] (see supplementary material).
Results
A focused compound screen showed that
EGFR/ERBB family inhibitors targeted chordoma
cells selectively
Of the 1097 compounds screened at a single concen-tration in three human chordoma cell lines (U-CH1, U-CH2 and MUG-Chor1; see supplementary mate-rial, Table S2), 154 met our hit selection criteria (see supplementary material, Table S2), which represented 14% (154/1097) of all compounds (see supplementary material, Table S5). Of these, 27 compounds selec-tively targeted chordoma cells but not human dermal fibroblasts (Table 1), and 21 of these 27 compounds (78%) represented EGFR/ERBB family inhibitors (Table 1, Figure 2), of which five also represented BRAF inhibitors. The results were reproducible using two different batches of compounds across all cell lines (data not shown). These 21 EGFR/ERBB inhibitors exerted the highest potency and maximum effects on U-CH1, whereas negligible activity was observed on U-CH2 (Table 1).
Key targets for the remaining 6/27 non-EGFR/ERBB compounds (Table 1) included activin receptor-like kinase 5 (ALK5), phosphatidylinositol-3-kinase (PI3K), BRAF, as well as protein kinase-Bα(AKT1) [44–47]. One compound, pazopanib (Votrient®; GSK), an angio-genesis inhibitor, has been FDA-approved for renal cell carcinoma and soft-tissue sarcomas [48,49]. Another compound has an unknown target. When these targets were examined for potential enrichment in signalling pathways [50], VEGFR1/2 signalling was identified as the pathway covering most of the non-EGFR target genes (see supplementary material, Table S6).
Chemical substituents correlated with EGFR/ERBB
inhibitor activity in chordoma cell lines
Twenty-one EGFR/ERBB inhibitors were selected by GSK for structural analysis on the basis of their phe-notypic (viability) potencies (Table 2). A number of these compounds are currently under clinical develop-ment. These compounds were found to represent two chemotypes, pyrimidines and two subtypes of quina-zolines. The quinazolines were characterised by either large substituents off the aniline group in the 4-position of the quinazoline ring (hereafter referred to as ’quinazo-lines large’), or small substituents on the aniline ring in this position (’quinazolines small’). ’Quinazoline small’ compounds, including erlotinib, sapitinib and gefitinib,
exerted activity on U-CH1, U-CH7 and MUG-Chor1 and showed a trend to greater potency than ’quinazo-line large’ compounds (Table 2). Neither subtype was active on U-CH2. Biochemical assessment of the IC50 on a selection of these compounds (n=14) on EGFR, ERBB2 and ERBB4 (ERBB3 was not tested) showed that both the size of the substituent group on the aniline ring and the structure of the tail portion of the molecule, which extends towards the solvent front of the kinase, had an impact on the potencies of the three targets (see supplementary material, Table S3).
Commercially available EGFR/ERBB family inhibitors
exerted good potency and high selectivity
in chordoma cell lines
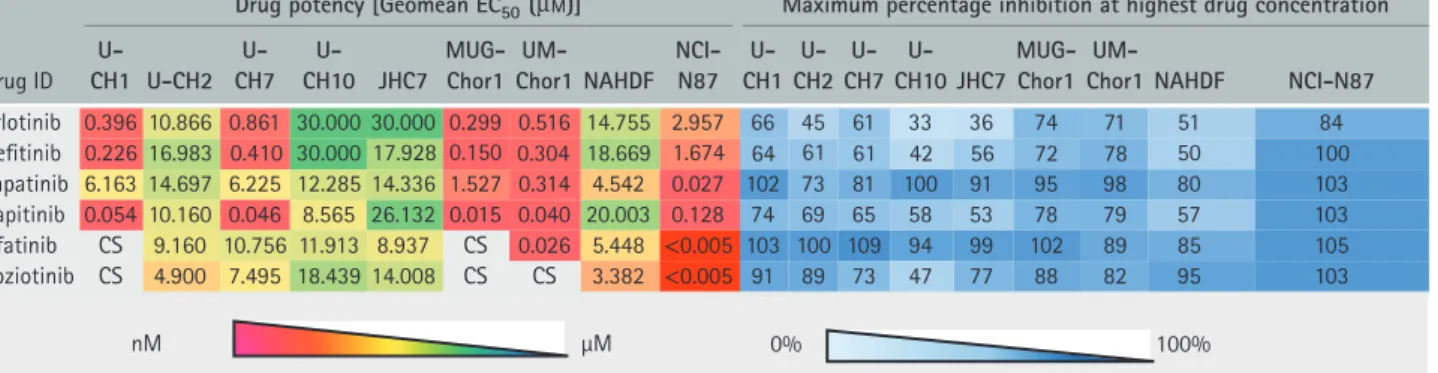
We next tested a set of six commercially available EGFR/ERBB inhibitors consisting of four reversible (erlotinib, sapitinib, gefitinib and lapatinib) and two irreversible (afatinib and poziotinib) compounds in an extended panel of seven chordoma cell lines, including the three previously tested ones (Table 3). Controls included human dermal fibroblasts (ATCC® PCS-201-012™) and the gastric cancer cell line NCI-N87 (Table 3). Four of the chordoma cell lines, U-CH1, U-CH7, UM-Chor1 and MUG-Chor1, responded to EGFR inhibition with EC50 concentra-tions<1μM, whereas U-CH2, U-CH10 and JHC7 were largely resistant (Table 3). Three of four reversible agents, erlotinib, gefitinib and sapitinib, were highly potent, exerting an effect in the nanomolar range in the four ‘responsive’ cell lines. In contrast, lapatinib was potent on UM-Chor1 (EC50 320 nMand 98% MI), showed only moderate activity (EC50≥1μM≤3μM) on MUG-Chor1 and no activity on the other cell lines (EC50≥3μM) (Table 3). Of the two irreversible EGFR/ERBB inhibitors, afatinib and poziotinib, the former displayed a significant kill effect on UM-Chor1 (EC50 of 26 nM and 89% MI) and a cytostatic profile on U-CH1 and MUG-Chor1. Poziotinib displayed a cytostatic profile on U-CH1, MUG-Chor1 and UM-Chor1: U-CH7 was resistant to both (Table 3). Sapitinib, a ’quinazoline small’ compound, showed the most exciting results, with EC50 concentrations in the nanomolar range in the four ‘responsive’ lines compa-rable to those observed in non-small cell lung cancer (NSCLC) and head and neck cancer cell lines defined as being sensitive to EGFR [51]. In these other cancer models, responses to the drug were also observed in related mouse xenograft models. The other active com-pounds were two FDA-approved ’quinazoline small’ compounds, gefitinib and erlotinib (Table 3).
EGFR/ERBB family inhibitors suppressed p-EGFR
and downstream effectors in chordoma cell lines
and induced apoptosis in sensitive cell lines
Ta ble 1 . C hordoma-selective hit compounds ( n = 27) Dr ug potency [Geo m e a nE C50 ( µ M )] Co m po u n d selectivity co m p a re d to fibrobl a sts M a xi mum percent ag e inhibition a th i g hest d r ug concentr a tion Co mp o u n d ID Libr a ry T a r g et NAHDF U-CH1 U-CH2 MUG-Chor1 U-CH7 U-CH1 U-CH2 M UG-Chor1 U -CH7 NAHDF U -CH1 U-CH2 M UG-Chor1 U-CH7 T N 4 6 2 5 6 7 0 1 T N 8 4 2 1 C N S T N 3 8 0. 0 7 1 8. 8 1 ) S S( Q N P 4 4 7. 0 2 RF G E m e hc oi bl a C 8 7 4 1 G A 0 5 2 6 7 2 6 8 7 7 5 0 1 9 4 3 2 1 0 4 6 1 2. 0 0 1 0. 0 0 0 0. 0 2 6 6 5. 0 4 9 7. 2 2 RF G E m e hc oi bl a C 6 5 d n u o p m o C CRT0 1 0 3 07 9 C a lbioche m EGFR/ERBB2/4 12.9 1 2 0.179 16.695 0.0 24 0.775 7 2 1 548 1 7 9 6 7 9 3 86 4 6
1 94
5 5 5 3 0 8 9 2 11 1 6 9 2 2 3 4 1 0 7 2. 0 1 0 1. 0 3 6 6. 9 1 9 0 2. 0 0 0 0. 0 3 RF G E m e hc oi bl a C 0 8 7 4 7 1 D P 17 0 7 3 4 5 7 11 0 9 1 0 2 2 8 7 2 3 3 . 0 9 4 1. 0 8 4 2. 3 1 4 8 3 . 0 0 0 0. 0 3 RF G E m e hc oi bl a C 5 6 2 4 7 1 D P GDC-094 1 Antic a ncer PI3K p110 α 3 .987 2.676 3 .6 3 0 3 .57 3 NT 1 1 1 N T 8 5 9 3 79 71 NT GW46 11 04A GSK PKIS1 EGFR/ERBB2 17.082 2.0 2 33 0.000 2.057 1 .9 12 8 1 8 9 85 80 3 25 8 5 1 GW4 1 056 3 A G SK PKIS1 VEGFR2 22.0 2 8 1.906 19. 3 92 4.406 N T 1 2 1 5 N T 6 8 8 0 6 7 4 7 N T GW282449A G SK PKIS1 EGFR/ERBB2 29.295 0.800 20.88 3 1.796 1 . 3 60 3 7 1 16 22 55 65 3 44 55 8 GW576609A G SK PKIS1 EGFR/ERBB2 12.099 4.060 2 3 .0 3 8B i p h a sic N T 3 1 S NC NT 85 77 3 84 9 N T GW58 33 7 3 A G SK PKIS1 EGFR/ERBB2 1 0.958 1. 3 9 1 17.9 3 1 3 0.000 0.476 8 1 1 2 3 62 71 44 3 24 4 GW6 160 3 0X GSK PKIS1 EGFR/ERBB2 19.400 0.5 3 8 3 0.000 1.624 0.454 3 61 1 2 4 3 5 3 69 27 3 95 5 GW680 1 9 1 X G SK PKIS1 EGFR/ERBB2 3 0.000 1.259 17.8 33 0. 3 69 3 .1 4 9 2 4 2 81 10 41 8 6 61 4 5 61 17 1 4 0 4 4 9 6 9 5 4 0 9 1 C N S 17 3 . 0 8 8 1. 0 0 0 0. 0 2 ci s a h p i B 17 8. 6 1 RF G E 2 SI K P K S G A 9 2 3 0 3 2I G GSK1 3 07 8 1 0A GSK PKIS2 AKT1 , ROCK1, PKC α 1 3 .652 16.442 1.847 5.68 3 NT 1 7 2 N T 1 00 6 1 64 3 0N T GSK16604 3 7A GSK PKIS2 BRAF , Src1, LCK, LYN, B TK, ALK5, ERBB4, ActR2 3 .0 24 15.40 7 1.00 1 18.44 3 NT 1 3 1N T 7 8 4 5 5 8 5 6 N
T 85
0 5 3 4 8 7 8 4 11 7 1 1 11 5 3 3 . 0 7 1 2. 0 9 8 0. 3 7 3 3 . 0 2 0 7. 3 F A R B ,s B B R E 2 SI K P K S G A 17 2 8 9 1 K S G GSK299495A GSK PKIS2 Src, ERBBs, BRAF 20.000 1.485 3 .895 6.5 3 8N T 1 3 5 3 NT 3 87 9 4 9 3 8N T GSK 3 26 180A G SK PKIS2 ERBBs, BRAF 20.000 0.89 1 0.4 3 1 2.956 1.20 1 22 46 7 1 7 3 57 4 4 4 4 8 6 9 GSK 3 57952A GSK PKIS2 Src, ERBBs, BRAF 20.000 1.987 6.19 1 20.000 N T 1 0 3 1N T 1 7 6 1 4 0 3 1N T GSK 3 6 1 06 1A GSK PKIS2 BRAF , ERBB4 22.1 3 4 1 .5 12 22.894 11.257 N T 1 5 1 2 N T 1 7 5 6 2 8 33
NT 74
6 4 17 1 8 9 9 4 5 1 1 2 7 9 1. 2 2 9 5. 0 4 8 4. 3 1 4 4 7. 4 7 6 7. 8 RF G E/ 2 B B R E 2 SI K P K S G A 6 17 9 6 5 W G GW582764A G SK PKIS2 ERBB2/EGFR 2 1.096 1 .7 17 22.894 22.1 3 4N T 1 2 1 1 N T 7 8 5 4 2 0 2 5 N T GW58 33 40C G SK PKIS2 ERBB2/ EGFR 15.1 3 0 1.060 1 3 .08 3 20.000 7.09 3 14 1 1 2 5 5 6 6 4 0 3 4 3 9 GW8767 3 1X GSK PKIS2 ALK5, ROCK1 8.88 1 1 0.922 0.577 12.76 3 NT 1 1 5 N T N T 8 3 94 74 3 9N T T N 2 4 4 2 5 5 9 T N 3 1 1 T N 9 6 3 . 6 0 0 0. 0 2 0 7 1. 9 1 0 0 0. 0 2 n w o nk n U 2 SI K P K S G 4 8 17 9-F K S GW582764A G SK PKIS2 ERBB2/EGFR 2 1.096 1 .7 17 22.894 22.1 3 4N T 1 2 1 1 N T 7 8 5 4 2 0 2 5 N T nM μM 0% 100% Hit compounds ( n = 27) exerting a chordoma-selective kill effect compared to fibroblasts. E
C50
was extrapolated in cases o f low percentage inhibition w here no plateau w as observed, indicating inactivity o f these drugs (Geomean E
C50
≥ 30 μ M ). NAHDF , normal adult human dermal fibroblasts; N T, not tested; PNQ (SS), potency not q uantified due to a small activity span; B iphasic, potency not q uant ified due to b iphasic curve profile; S NC, selectivity not calculated. K ey targets for n on-EGFR hit compounds a re stated in italic letters.
Figure 2.Hit compounds display varying effects on p-EGFR and EGFR levels. Of 21 EGFR/ERBB hit compounds that selectively targeted chordoma cells, the impact of 13, comprising a selection of hit compounds across the libraries and chemical structures tested (listed in Tables 1, 2), was studied by western blot on three chordoma cell lines (U-CH1, U-CH2, MUG-Chor1). Cells were serum-starved overnight before being treated with EGFR inhibitors (250 nM) for 4 h and then being exposed to EGF (50 ng/ml) for 15min.
Table 2. Chemical substituent trend analysis of selected EGFR/ERBB inhibitors (n=21)
nM μM
Drugpotency [Geomean EC50(µM)]
CompoundID Library Target Chemical substituent NAHDF U-CH1 U-CH2 MUG-Chor1 U-CH7
GSK198271A GSK PKIS2 ERBB family, BRAF Pyrimidine 3.702 0.337 3.089 0.217 0.335
1 0 2 . 1 6 5 9 . 2 1 3 4 . 0 1 9 8 . 0 0 0 0 . 0 2 F A R B , y l i m a f B B R E 2 S I K P K S G A 0 8 1 6 2 3 K S G
Lapatinib Anticancer EGFR Quinazoline large 4.542 6.163 14.697 1.527 6.225
0 6 3 . 1 6 9 7 . 1 3 8 8 . 0 2 0 0 8 . 0 5 9 2 . 9 2 2 B B R E / R F G E 1 S I K P K S G A 9 4 4 2 8 2 W G 6 7 4 . 0 0 0 0 . 0 3 1 3 9 . 7 1 1 9 3 . 1 8 5 9 . 0 1 2 B B R E / R F G E 1 S I K P K S G A 3 7 3 3 8 5 W G 4 5 4 . 0 4 2 6 . 1 0 0 0 . 0 3 8 3 5 . 0 0 0 4 . 9 1 2 B B R E / R F G E 1 S I K P K S G X 0 3 0 6 1 6 W G 7 9 1 . 2 2 9 5 . 0 4 8 4 . 3 1 4 4 7 . 4 7 6 7 . 8 R F G E / 2 B B R E 2 S I K P K S G A 6 1 7 9 6 5 W G T N 4 3 1 . 2 2 4 9 8 . 2 2 7 1 7 . 1 6 9 0 . 1 2 R F G E / 2 B B R E 2 S I K P K S G A 4 6 7 2 8 5 W G 3 9 0 . 7 0 0 0 . 0 2 3 8 0 . 3 1 0 6 0 . 1 0 3 1 . 5 1 R F G E / 2 B B R E 2 S I K P K S G C 0 4 3 3 8 5 W G
Compound56 Calbiochem EGFR Quinazoline small 22.794 0.566 20.000 0.010 0.216
5 7 7 . 0 4 2 0 . 0 5 9 6 . 6 1 9 7 1 . 0 2 1 9 . 2 1 4 B B R E / 2 B B R E / R F G E m e h c o i b l a C 9 7 0 3 0 1 0 T R C 0 7 2 . 0 1 0 1 . 0 3 6 6 . 9 1 9 0 2 . 0 0 0 0 . 0 3 R F G E m e h c o i b l a C 0 8 7 4 7 1 D P 2 3 3 . 0 9 4 1 . 0 8 4 2 . 3 1 4 8 3 . 0 0 0 0 . 0 3 R F G E m e h c o i b l a C 5 6 2 4 7 1 D P 8 4 2 . 0 S C 2 0 3 . 9 5 2 1 . 0 6 8 1 . 5 2 B B R E / R F G E m e h c k c e l l e S b i n i t r e n a C 1 6 8 . 0 9 9 2 . 0 6 6 8 . 0 1 6 9 3 . 0 5 5 7 . 4 1
18.669 0.226 16.983 0.150 0.410
R F G E m e h c k c e l l e S b i n i t o l r E
Gefitinib Selleckchem EGFR
2 1 9 . 1 7 5 0 . 2 0 0 0 . 0 3 3 2 0 . 2 2 8 0 . 7 1 2 B B R E / R F G E 1 S I K P K S G A 4 0 1 1 6 4 W G 9 4 1 . 3 9 6 3 . 0 3 3 8 . 7 1 9 5 2 . 1 0 0 0 . 0 3 2 B B R E / R F G E 1 S I K P K S G X 1 9 1 0 8 6 W G 1 7 3 . 0 8 8 1 . 0 0 0 0 . 0 2 S C 1 7 8 . 6 1 R F G E 2 S I K P K S G A 9 2 3 0 3 2 I G 6 4 0 . 0 5 1 0 . 0 0 6 1 . 0 1 4 5 0 . 0 3 0 0 . 0 2 2 B B R E / R F G E m e h c k c e l l e S ) 1 3 9 8 D Z A ( b i n i t i p a S 6 5 7 . 0 1 S C 0 6 1 . 9 S C 8 4 4 . 5 2 B B R E / R F G E m e h c k c e l l e S b i n i t a f A
Quinazoline large: large substituent on the aniline ring in the 4-position of the quinazoline ring system.
Quinazoline small, small substituent on the aniline ring in the 4-position of the quinazoline ring system; NAHDF, normal adult human dermal fibroblasts; CS, cytostatic, no potency calculated; NT, not tested.
EC50was extrapolated in cases of low percentage inhibition where no plateau was observed, indicating inactivity of these drugs (Geomean EC50≥30μM).
Table 3. Phenotypic activity of commercially available EGFR/ERBB inhibitors (n=6)
nM μM 0% 100%
Drugpotency [Geomean EC50(µM)] Maximumpercentage inhibitionat highestdrugconcentration
DrugID
U-CH1 U-CH2
U-CH7
U-CH10 JHC7
MUG-Chor1
UM-Chor1 NAHDF
NCI-N87
U-CH1
U-CH2
U-CH7
U-CH10 JHC7
MUG-Chor1
UM-Chor1 NAHDF NCI-N87 Erlotini
Gefitinib
b 0.396
0.226 16.983 0.410 30.000 17.928 0.150 0.304 18.669 1.674 64 61 61 42 56 72 78 50 100
10.866 0.861 30.000 30.000 0.299 0.516 14.755 2.957 66 45 61 33 36 74 71 51 84
Lapatinib 6.163 14.697 6.225 12.285 14.336 1.527 0.314 4.542 0.027 102 73 81 100 91 95 98 80 103
Sapitinib 0.054 10.160 0.046 8.565 26.132 0.015 0.040 20.003 0.128 74 69 65 58 53 78 79 57 103
Afatinib CS 9.160 10.756 11.913 8.937 CS 0.026 5.448 <0.005 103 100 109 94 99 102 89 85 105
Poziotinib CS 4.900 7.495 18.439 14.008 CS CS 3.382 <0.005 91 89 73 47 77 88 82 95 103
EC50was extrapolated in cases of low percentage inhibition where no plateau was observed, indicating inactivity of these drugs [Geomean EC50≥30 (μM)].
NAHDF, normal adult human dermal fibroblasts; CS, cytostatic, no potency calculated.
p-EGFR at two different phosphorylation sites (Tyr1068 and Tyr1173) in all cell lines, confirming that the drugs hit their key target. Similar results were shown in EGF spiked/serum-starved (Figure 3; see also supplementary material, Figure S2) and non-spiked/non-starved experiments (see supplemen-tary material, Figures S3, S4). Key effectors of EGFR signalling, including p-AKT (PI3K–AKT–mTOR)
and p-ERK1/2 (Ras–Raf–MAPK–ERK1/2) were
also dose-dependently suppressed in response to these treatments. We did not observe significant effects on p-STAT3 (see supplementary material, Figures S3, S4). Inhibition of p-EGFR and downstream targets occurred at lower doses with sapitinib than with the other EGFR inhibitors tested. The endogenous/baseline status for all of the markers investigated is shown in Figure S5 (see supplementary material).
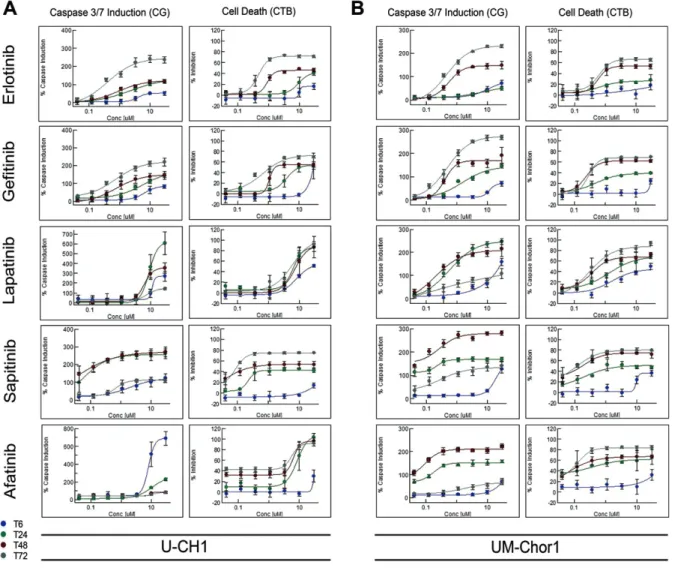
The EGFR/ERBB inhibitors induced apoptosis in a dose-dependent manner. This resulted in a decrease in cell viability from 24 h onwards (Figure 4; see also supplementary material, Figure S6). Where a cytostatic profile was generated in response to EGFR inhibitors, such as with lapatinib in the U-CH1 cell line, minimal caspase 3/7 activity (∼30%) was observed in support of these phenotypic data (Figure 4; see also supplementary material, Figure S6).
Sapitinib significantly reduced tumour growth
in chordoma mouse models
Our most promising compound, sapitinib, significantly reduced tumour growth in two chordoma xenograft models (Figure 3C, D).
Study of resistance mechanisms in U-CH2, JHC7
and U-CH10
Next we sought reasons why our best compounds were not effective in the unresponsive chordoma cell lines. We addressed the issue of EGFR tyrosine kinase inhibitor resistance by investigating known mecha-nisms of resistance from work in other cancer types. Next-generation sequencing failed to detect mutations covering the hotspots in 22 tumour-related genes, which included EGFR, ERBB2 and ERBB4 and their
downstream effectors (KRAS, BRAF, PIK3CA, AKT1, PTEN, NRAS and MAPK). Thus, we were not able to detect obvious genetic explanations for sensitivity and/or resistance in our cell line panel.
Activation of ERBB2 and MET can result in bypass resistance pathways. Together withEGFR, no amplifi-cations inERBB2andMETwere identified by FISH in the cell lines (see supplementary material, Table S7). Moreover, no mutations were identified inMET. Fur-thermore, MET amplification, assessed by FISH, was only seen in two (non-clival) of 114 clinical chordomas, 66 of which were located along the spinal axis and 48 in the clivus. However, western blots and immunohis-tochemistry for p-MET revealed strong expression in U-CH2 (Figures 5A, 6B). To test whether this con-tributed to the resistance observed, we treated U-CH2 with sapitinib in combination with the MET-inhibitor crizotinib and observed a significant synergistic effect (Figures 5B, 6A).
The loss and decreased protein expression ofPTEN, a tumour suppressor gene, has also been linked to EGFR tyrosine kinase inhibitor (TKI) resistance [52,53]. All cell lines apart from U-CH1 showed variable immunoreactivity with a PTEN antibody, strong in U-CH2 and U-CH7, moderate in MUG-Chor1, JHC7 and U-CH10 and weak in UM-Chor1. These data were confirmed by western blots for PTEN (Figure 6C and 6E). Resistance has also been associated with loss of E-Cadherin expression: it has been proposed that this results in epithelial–mesenchymal transition (EMT) and a related increase in motility [52,54]. Immuno-histochemistry for E-Cadherin showed weak and only focal expression in U-CH7 and MUG-Chor1 and was negative in the remaining five cell lines (Figure 6D). The Hippo downstream effector Yes-associated pro-tein (YAP) [55,56] has also been reported to confer resistance to EGFR inhibitors [57–59]. Even though YAP was highly expressed in the resistant cell line U-CH10, strong expression levels were also observed in MUG-Chor1, a cell line responsive to EGFR TKIs (see supplementary material, Figure S5). Hence, PTEN, E-Cadherin, and YAP protein expression in the cell lines appear not to show an obvious correlation with the presence and/or absence of resistance to EGFR inhibitors.
Figure 3.Western blot (A) and ELISA (B) analysis confirm suppression of the biomarker p-EGFR upon treatment with EGFR TKIs in U-CH1 and UM-Chor1. Cells were serum-starved overnight before they were treated with a range of concentrations of the EGFR inhibitors for 4 h and then EGF-spiked (50 ng/ml) for 15min. Endogenous controls (non-serum-starved, non-EGF-spiked), untreated controls (serum-starved, non-EGF-spiked) and vehicle controls (serum-starved, treated with 2.5% DMSO, EGF-spiked) were included. Phospho-EGFR was measured by western blot and ELISA. Western blot results for U-CH2, U-CH7, JCH7 and MUG-Chor1 are displayed in supplementary material, Figure S2. (C, D) Sapitinib induces a significant growth reduction in the patient-derived xenograft SF8894 (C) and in the U-CH1 xenograft (D);*p≤0.05,
Figure 4.Apoptotic induction in U-CH1 (A) and UM-Chor1 (B). The Caspase-Glo®3/7 Assay and the CellTiter-Glo®Luminescent Cell Viability Assay were used on separate assay plates to monitor cell viability and to determine induction of apoptosis upon treatment with erlotinib, gefitinib, sapitinib, afatinib and lapatinib. Read-outs were performed at four time points (6, 24, 48 and 72 h). Two independent experiments were conducted for each compound (n=3 for sapitinib and erlotinib). The results for U-CH7 and MUG-Chor1 are shown in supplementary material, Figure S6
Discussion
In the light of the absence of recurrent genetic alterations in chordoma, we chose a phenotypic screening approach to identify the mechanism(s) by which this disease is driven and/or targets that could potentially be translated into clinical practice [28]. We screened three chordoma cell lines (U-CH1, U-CH2 and MUG-Chor1) against 1097 compounds, 1046 of which were small molecule kinase inhibitors. Twenty-seven compounds remained of interest fol-lowing exclusion of compounds that failed to mediate a chordoma-selective cell kill effect. The majority (21/27) of these compounds targeted the EGFR/ERBB family. Gene enrichment analysis for non-EGFR hit compounds revealed that VEGFR1/2 signalling covers most of their target genes, which is in line with isolated case reports showing activity of VEGF inhibitors in patients with chordoma [12,13]. However, since most of the non-EGFR hits were multikinase inhibitors and their targets ill-defined, and/or the compounds not
phenotypically as potent as the EGFR/ERBB inhibitors, we focused on EGFR inhibitors in this study. As the majority of these 21 EGFR inhibitors remain under development, we tested six other EGFR inhibitors [erlotinib (Roche/Genentech); gefitinib (AstraZeneca); sapitinib (AstraZeneca); lapatinib (GSK); afatinib (Boehringer Ingelheim, Germany); and poziotinib (Spectrum Pharmaceuticals, Irvine, CA, USA)] that were either FDA-approved or have been in clinical trials [39,40,42,60]. Of the seven chordoma cell lines tested, we demonstrated that four (U-CH1, U-CH7, MUG-Chor1 and UM-Chor1) were sensitive and three (U-CH2, U-CH10 and JHC7) were resistant to EGFR inhibition. The limitations of allin vitroscreens apply to our study, but we imposed a high level of quality control measurements to ensure the generation of robust data [26–28].
EGFR was the first tyrosine kinase receptor to be linked to tumourigenesis [52,61–63] and therapeutic inhibition of this pathway has yielded varying success in the treatment of malignant disease [39,52,62]. A
Figure 5.MET expression in the chordoma cell line panel. (A) Western blot analyses for MET-expression in the cell line panel were conducted on endogenous (non-serum-starved, non-EGF-spiked), serum-starved (serum-starved, non-EGF-spiked) and EGF-spiked (serum-starved, EGF-spiked) samples of each chordoma cell line. Normal adult human dermal fibroblasts (NAHDF) served as a control. Both western blots and immunohistochemistry (data shown in supplementary material, Figure 6B) revealed strong p-MET expression in U-CH2, a cell line resistant to EGFR TKIs, but not in the other chordoma cell lines. (B) Western blots of U-CH2 treated with reagents as indicated for 4 h
common cause for EGFR activation is the presence of mutations and gene amplification, as seen in non-small cell lung cancer and glioblastoma [22,39,64,65]. How-ever, this is not the case for the cell lines in our study, which is consistent with publishedEGFR genetic pro-filing reports [19,23] and the unpublished data from
∼30 whole genomes/whole exomes from our labora-tory. The absence of EGFR mutations in chordomas is shared with other cancers, such as head and neck squamous cell carcinoma and colorectal and pancre-atic cancers, which are known to respond to anti-EGFR therapy to varying degrees [52,66–72]. Similar to these tumours, chordoma cell lines express the activated form of the receptor and show suppression of the down-stream EGFR signalling pathways following treatment with EGFR inhibitors. The clinical relevance of ourin vitrostudies is supported by the documented expression of these markers in patients’ samples [18–21,73–75]. Specifically, up to 52% of 170 chordoma samples have been reported to express p-EGFR [18–21,76], although as phosphorylated protein is unstable, this is likely to be an underestimate [19,21,73,74]. The significance of
Figure 6.Combination treatment of the EGFR TKI sapitinib and the MET inhibitor crizotinib revealed significant synergy. (A) U-CH2 cells were plated with a Multidrop Combi in a 384-well format: after 24 h, cells were treated with crizotinib for 72 h, followed by sapitinib for another 24 h (n=4 for combination;n=3 for compounds alone); a combination index (CI) was calculated and evaluated as synergistic (CI<0.9), additive (CI=0.9–1.1) or antagonistic (CI>1.1) [86]; we observed a significant synergistic effect when sapitinib (300 nM) was combined with the MET inhibitor crizotinib (1μM) in U-CH2 (MI58%; CI=0.121; combination versus control, **p=0.0047). (B) Immunohistochemistry was conducted on formalin-fixed, paraffin-embedded pellets of all seven chordoma cell lines, normal adult human dermal fibroblasts (NAHDF) and positive controls (POS): all images were taken at×20 magnification; results for p-MET showed strong expression in U-CH2, concordant with the results obtained in western blot analysis (Figure5), but not in the other cell lines. (C) PTEN expression was absent in U-CH1, weak in UM-Chor1 and positive to varying degrees in the other cell lines. (D) E-Cadherin was expressed weakly and only focally in U-CH7 and MUG-Chor1 and was negative in the remaining five cell lines. (E) Western blots on the chordoma cell line panel (n=7) and NAHDF confirmed an absence of PTEN in U-CH1, weak expression in UM-Chor1 and varying positivity in the other cell lines, as observed in IHC (C)
compounds such as sapitinib, with small substituents appended to the aniline ring in the 4-position of the quinazoline ring system, were more effective than com-pounds such as lapatinib, with large substituents, albeit these findings derive from a small sample size. However, the complexities of this potency, selectivity and pheno-typic response relationship demand further study so that activity can be optimized for chordoma patients.
The expression of p-EGFR in chordoma may be explained on the basis that epidermal growth fac-tor (EGF) ligands are direct targets of T [17], the expression of which is considered to be critical in the growth of this tumour. This could also explain why T expression is not suppressed on western blot in response to EGFR inhibitors. It is therefore interesting that early-phase clinical trials involving vaccines against T in patients with lung cancer and chordoma are showing some evidence of clinical activity [79–81], and it would
be of interest to know whether p-EGFR is suppressed in the clinical samples from these patients. The combina-tion of one these vaccines and EGFR inhibicombina-tion may be more effective than a monotherapy.
In an attempt to understand why three of seven cell lines were resistant to EGFR inhibitors, we studied the common mechanisms by which EGFR TKI resistance occurs [22,52,54]. We were unable to detect downstream mutations inPIK3CA,BRAF,KRAS,MAPK1and oth-ers [22,52,54]. Nevertheless, as PIK3CA alterations have been reported in a minority of chordomas, these could be used to stratify patients for future EGFR inhibitor clinical trials [23]. ERBB2 amplification, another reported resistance mechanism [22,52], was not identified in the cell lines. Loss of heterozygosity for PTEN has been reported frequently in chordoma [19,23,24,52,53,82–84]; however, based on ourin vitro results, it was not possible to predict response to EGFR
inhibition based on PTEN expression. Other major causes of EGFR resistance may be explained by the activation of bypass signalling pathways such as MET [22,52]. It is therefore noteworthy that MET signalling was activated in the most resistant cell line, U-CH2, and that a combination of the MET-inhibitor crizotinib and the EGFR-inhibitor sapitinib exhibited a synergistic effect on cell kill in this cell line. The absence of gene amplification and aMETmutation in this cell line leaves the mechanism of activation unanswered, although this has not been studied exhaustively, as MET can be acti-vated by various other mechanisms, such as crosstalk with other receptor tyrosine kinases [85]. As there are numerous resistance mechanisms to EGFR TKIs, many of which remain unexplained even in common cancers [22], it was beyond the scope of this project to pursue this further.
The collective data from this study show that EGFR inhibitors represent the group of compounds within our extensive screen that were most effective against chordoma cell growth. There have been reports that other therapeutic agents have been found to be active against chordoma but, ultimately, whether some patients with chordoma benefit from EGFR inhibitors alone or in combination with these other agents is likely only to be resolved in a clinical trial [3,14,29]. We propose that such a study should involve in-depth biological studies of the tumour samples pre- and post-treatment, with the aim of explaining the mechanism by which some chordomas are primarily resistant or develop secondary resistance to EGFR inhibitors.
Acknowledgements
The research was funded by Chordoma UK (166854), Sarcoma UK (008.2012), the Rosetrees Trust (M23-F1), and the RNOH NHS Trust. Susanne Scheipl received an Erwin-Schroedinger fellowship from the Austrian Science Fund (FWF) (J3640) (2014-2016), and a Marietta-Blau fellowship (ICM-2012-01605) from the OeAD (2013). Mette Jorgensen was supported by a Cancer Research UK clinical research fellowship. Nischalan Pillay is a recipient of a clinician scientist fellowship from Cancer Research UK. Support was provided to Adrienne Flanagan and Sandra Strauss by the NIHR, the University College London Hospitals Biomedical Research Centre, and the Cancer Research UK University College London Experimental Can-cer Medicine Centre. The work could not have been done without the existence of the Stanmore biobank, a satellite of the UCL Biobank for Health and Disease which is supported by the Research and Develop-ment DepartDevelop-ment of the Royal National Orthopaedic Hospital.
The Chordoma Foundation (CF) provided support with administration and cell line validation. Preclin-ical studies were conducted through the Chordoma Foundation Drug Screening Pipeline. We are grateful
to GlaxoSmithKline (GSK) for the donation of the Published Kinase Inhibitor Set (PKIS) compounds used in these studies. We would like to thank the scientists at START for their help in conducting thein vivo experi-ments and Patty Cogswell (CF) for providing a statement on the methods employed. Staff members, particularly Mathew Rushbrook (Cancer Research Technology Dis-covery Laboratories) and Ariadna Mendoza-Naranjo (UCL Cancer Institute), provided technical support and reagents. Franz Quehenberger and Beate Rinner (Med-ical University of Graz) advised on statist(Med-ical analysis and provided the cell line MUG-Chor1, respectively. David Allen (UCL Advanced Diagnostics) helped with the creation of the IHC images. Paolo Salomoni and Aikaterini Lampada (UCL Cancer Institute) provided scientific and technical advice. We are grateful to all clinicians who cared for these patients, and for patients who generously donated their tissue for research.
Author contributions
AMF initiated and supervised the project; SS, MB, LC and MJ conducted the experiments; MB and SS outlined the screening cascade; MB conducted the data analy-sis; DHD and WJZ provided the GSK compounds and biochemical selectivity data and advised on data analy-sis and data preparation for publication; FT overlooked and advised on compound screening and data analysis; JAS was responsible for compound plate preparation; HY performed FISH analysis; NG performed immuno-histochemistry; APL and NP supported data and NGS mutation analysis; APL conducted the MSigDB enrich-ment analysis; SjS advised on the clinical relevance of the findings; AL provided organizational support and clinical advice; SB and PM established the U-CH7 pri-mary culture; FA, PM and RT provided clinicopatholog-ical expertise; and SS and AMF wrote the manuscript. All authors read and approved the final version of the manuscript.
References
1. Flanagan A, Yamaguchi T. Chordoma. InWorld Health Organization
Classification of Tumours of Soft Tissue and Bone, 4th edn, Fletcher C, Bridge J, Hogendoorn P, Mertens F (eds). IARC Press: Lyon, 2013: 328–329.
2. Walcott BP, Nahed BV, Mohyeldin A, et al. Chordoma: current
concepts, management, and future directions.Lancet Oncol2012;13:
e69–76.
3. Stacchiotti S, Sommer J. Building a global consensus approach to chordoma: a position paper from the medical and patient community.
Lancet Oncol2015;16:e71–83.
4. Tirabosco R, Mangham DC, Rosenberg AE, et al. Brachyury expres-sion in extra-axial skeletal and soft tissue chordomas: a marker that distinguishes chordoma from mixed tumor/myoepithelioma/
parachordoma in soft tissue.Am J Surg Pathol2008;32:572–580.
5. ESMO/European Sarcoma Network Working Group. Bone sarcomas: ESMO Clinical Practice Guidelines for diagnosis, treatment and
follow-up.Ann Oncol2014;25(suppl 3): iii, 113–123.
6. Stacchiotti S, Longhi A, Ferraresi V, et al. Phase II study of imatinib
7. Hindi N, Casali PG, Morosi C, et al. Imatinib in advanced
chor-doma: a retrospective case series analysis.Eur J Cancer2015;17:
2609–2614.
8. Singhal N, Kotasek D, Parnis FX. Response to erlotinib in a patient
with treatment refractory chordoma.Anticancer Drugs2009;20:
953–955.
9. Launay SG, Chetaille B, Medina F, et al. Efficacy of epidermal growth factor receptor targeting in advanced chordoma: case report
and literature review.BMC Cancer2011;11:423.
10. Houessinon A, Boone M, Constans JM, et al. Sustained response of
a clivus chordoma to erlotinib after imatinib failure.Case Rep Oncol
2015;8:25–29.
11. Hof H, Welzel T, Debus J. Effectiveness of cetuximab/gefitinib in the
therapy of a sacral chordoma.Onkologie2006;29:572–574.
12. Asklund T, Sandstrom M, Shahidi S, et al. Durable stabilization of
three chordoma cases by bevacizumab and erlotinib.Acta Oncol
2014;53:980–984.
13. Asklund T, Danfors T, Henriksson R. PET response and tumor sta-bilization under erlotinib and bevacizumab treatment of an
intracra-nial lesion non-invasively diagnosed as likely chordoma.Clin
Neu-ropathol2011;30:242–246.
14. Lebellec L, Aubert S, Zairi F, et al. Molecular targeted therapies in
advanced or metastatic chordoma patients: facts and hypotheses.Crit
Rev Oncol Hematol2015;95:125–131.
15. Vujovic S, Henderson S, Presneau N, et al. Brachyury, a crucial
regulator of notochordal development, is a novel biomarker for
chordomas.J Pathol2006;209:157–165.
16. Presneau N, Shalaby A, Ye H, et al. Role of the transcription factorT
(brachyury) in the pathogenesis of sporadic chordoma: a genetic and
functional-based study.J Pathol2011;223:327–335.
17. Nelson AC, Pillay N, Henderson S, et al. An integrated functional genomics approach identifies the regulatory network directed by
brachyury(T) in chordoma.J Pathol2012;228:274–285. 18. Shalaby A, Presneau N, Ye H, et al. The role of epidermal growth
factor receptor in chordoma pathogenesis: a potential therapeutic
target.J Pathol2011;223:336–346.
19. Dewaele B, Maggiani F, Floris G, et al. Frequent activation of EGFR
in advanced chordomas.Clin Sarcoma Res2011;1:4.
20. Weinberger PM, Yu Z, Kowalski D, et al. Differential expression of epidermal growth factor receptor, c-Met, and HER2/neu in chordoma
compared with 17 other malignancies.Arch Otolaryngol Head Neck
Surg2005;131:707–711.
21. Tamborini E, Virdis E, Negri T, et al. Analysis of receptor tyrosine
kinases (RTKs) and downstream pathways in chordomas. Neuro
Oncol2010;12:776–789.
22. Camidge DR, Pao W, Sequist LV. Acquired resistance to TKIs in
solid tumours: learning from lung cancer.Nat Rev Clin Oncol2014;
11:473–481.
23. Choy E, MacConaill LE, Cote GM, et al. Genotyping
cancer-associated genes in chordoma identifies mutations in
oncogenes and areas of chromosomal loss involving CDKN2A,
PTEN, andSMARCB1.PLoS One2014;9:e101283.
24. Le LP, Nielsen GP, Rosenberg AE, et al. Recurrent chromosomal
copy number alterations in sporadic chordomas.PLoS One2011;6:
e18846.
25. Hallor KH, Staaf J, Jonsson G, et al. Frequent deletion of the
CDKN2Alocus in chordoma: analysis of chromosomal imbalances
using array comparative genomic hybridisation.Br J Cancer2008;
98:434–442.
26. Swinney DC. Phenotypic vs. target-based drug discovery for
first-in-class medicines.Clin Pharmacol Ther2013;93:299–301.
27. Moffat JG, Rudolph J, Bailey D. Phenotypic screening in cancer drug
discovery – past, present and future.Nat Rev Drug Discov2014;13:
588–602.
28. Zheng W, Thorne N, McKew JC. Phenotypic screens as a renewed
approach for drug discovery. Drug Discov Today 2013; 18:
1067–1073.
29. von Witzleben A, Goerttler LT, Marienfeld R, et al. Preclinical char-acterization of novel chordoma cell systems and their targeting by
pharmocological inhibitors of the Cdk4/6 cell cycle pathway.Cancer
Res2015;75:3823–3831.
30. Brüderlein S, Sommer JB, Meltzer PS, et al. Molecular
characteriza-tion of putative chordoma cell lines.Sarcoma2010;2010:630129.
31. Hsu W, Mohyeldin A, Shah SR, et al. Generation of chordoma cell line JHC7 and the identification of Brachyury as a novel molecular
target.J Neurosurg2011;115:760–769.
32. Scheil S, Brüderlein S, Liehr T, et al. Genome-wide analysis of 16 chordomas by comparative genomic hybridization and cytogenetics
of the first human chordoma cell line, U-CH1.Genes Chromosomes
Cancer2001;32:203–211.
33. Rinner B, Froehlich EV, Buerger K, et al. Establishment and detailed functional and molecular genetic characterisation of a novel sacral
chordoma cell line, MUG-Chor1.Int J Oncol2012;40:443–451.
34. Hotz B, Keilholz U, Fusi A, et al.In vitroandin vivoantitumor
activity of cetuximab in human gastric cancer cell lines in relation to epidermal growth factor receptor (EGFR) expression and mutational
phenotype.Gastric Cancer2012;15:252–264.
35. Park JG, Frucht H, LaRocca RV, et al. Characteristics of cell lines
established from human gastric carcinoma.Cancer Res1990;50:
2773–2780.
36. Drewry DH, Willson TM, Zuercher WJ. Seeding collaborations to advance kinase science with the GSK Published Kinase Inhibitor Set
(PKIS).Curr Top Med Chem2014;14:340–342.
37. Elkins JM, Fedele V, Szklarz M, et al. Comprehensive
characteriza-tion of the Published Kinase Inhibitor Set.Nat Biotechnol2015;34:
95–103.
38. Matsunaga T, Wada Y, Endo S, et al. Aldo-keto reductase 1B10
and its role in proliferation capacity of drug-resistant cancers.Front
Pharmacol2012;3:5.
39. Roskoski R Jr. The ErbB/HER family of protein-tyrosine kinases and
cancer.Pharmacol Res2014;79:34–74.
40. Kurata T, Tsurutani J, Fujisaka Y, et al. Inhibition of EGFR, HER2 and HER3 signaling with AZD8931 alone and in combination with paclitaxel: phase I study in Japanese patients with advanced solid
malignancies and advanced breast cancer.Invest New Drugs2014;
32:946–954.
41. Tjulandin S, Moiseyenko V, Semiglazov V, et al. Phase I, dose-finding study of AZD8931, an inhibitor of EGFR (erbB1), HER2 (erbB2) and HER3 (erbB3) signaling, in patients with
advanced solid tumors.Invest New Drugs2014;32:145–153.
42. Noh YH, Lim HS, Jung JA, et al. Population pharmacokinetics of HM781–36 (poziotinib), pan-human EGF receptor (HER) inhibitor, and its two metabolites in patients with advanced solid malignancies.
Cancer Chemother Pharmacol2015;75:97–109.
43. Davies JM, Robinson AE, Cowdrey C, et al. Generation of a patient-derived chordoma xenograft and characterization of the
phosphoproteome in a recurrent chordoma.J Neurosurg2014;120:
331–336.
44. Folkes AJ, Ahmadi K, Alderton WK, et al. The identification of
2-(1H
-indazol-4-yl)-6-(4-methanesulfonyl-piperazin-1-ylmethyl)-4-morpholin-4-yl-thieno[3,2-D]pyrimidine (GDC-0941) as a potent,
selective, orally bioavailable inhibitor of class I PI3 kinase for the
treatment of cancer.J Med Chem2008;51:5522–5532.
45. Seefeld MA, Rouse MB, McNulty KC, et al. Discovery of 5-pyrrolopyridinyl-2-thiophenecarboxamides as potent AKT kinase
inhibitors.Bioorg Med Chem Lett2009;19:2244–2248.
46. Stellwagen JC, Adjabeng GM, Arnone MR, et al. Development of potent B-RafV600E inhibitors containing an arylsulfonamide
head-group.Bioorg Med Chem Lett2011;21:4436–4440.
47. Gellibert F, Fouchet MH, Nguyen VL, et al. Design of novel quinazo-line derivatives and related analogues as potent and selective ALK5
inhibitors.Bioorg Med Chem Lett2009;19:2277–2281.
48. Radaelli S, Stacchiotti S, Casali PG, et al. Emerging therapies for
adult soft tissue sarcoma.Expert Rev Anticancer Ther 2014;14:
689–704.
49. Ranieri G, Mammi M, Donato Di Paola E, et al. Pazopanib a tyro-sine kinase inhibitor with strong anti-angiogenetic activity: a new
treatment for metastatic soft tissue sarcoma.Crit Rev Oncol Hematol
2014;89:322–329.
50. Subramanian A, Tamayo P, Mootha VK, et al. Gene set enrich-ment analysis: a knowledge-based approach for interpreting
genome-wide expression profiles.Proc Natl Acad Sci USA2005;
102:15545–15550.
51. Hickinson DM, Klinowska T, Speake G, et al. AZD8931, an equipo-tent, reversible inhibitor of signaling by epidermal growth factor receptor, ERBB2 (HER2), and ERBB3, a unique agent for
simulta-neous ERBB receptor blockade in cancer.Clin Cancer Res2010;16:
1159–1169.
52. Chong CR, Janne PA. The quest to overcome resistance to
EGFR-targeted therapies in cancer.Nat Med2013;19:1389–1400.
53. Yang ZY, Wu XY, Huang YF, et al. Promising biomarkers for
predicting the outcomes of patients withKRASwild-type metastatic
colorectal cancer treated with anti-epidermal growth factor receptor
monoclonal antibodies: a systematic review with meta-analysis.Int J
Cancer2013;133:1914–1925.
54. Stewart EL, Tan SZ, Liu G, et al. Known and putative mechanisms of
resistance to EGFR targeted therapies in NSCLC patients withEGFR
mutations – a review.Transl Lung Cancer Res2015;4:67–81.
55. Moroishi T, Hansen CG, Guan KL. The emerging roles of YAP and
TAZ in cancer.Nat Rev Cancer2015;15:73–79.
56. Yu FX, Guan KL. The Hippo pathway: regulators and regulations.
Genes Dev2013;27:355–371.
57. Song S, Honjo S, Jin J, et al. The Hippo coactivator YAP1 mediates EGFR overexpression and confers chemoresistance in esophageal
cancer.Clin Cancer Res2015;21:2580–2590.
58. Flaherty KT, Wargo JA, Bivona TG. YAP in MAPK pathway targeted
therapy resistance.Cell Cycle2015;14:1765–1766.
59. He C, Mao D, Hua G, et al. The Hippo/YAP pathway interacts with EGFR signaling and HPV oncoproteins to regulate cervical cancer
progression.EMBO Mol Med2015;7:1426–1449.
60. de Marinis F, Catania C, Passaro A. Afatinib in NSCLC harbouring
EGFR mutations.Lancet Oncol2014;15:e148–149.
61. Cohen S. Nobel lecture. Epidermal growth factor.Biosci Rep1986;
6:1017–1028.
62. Hynes NE, Lane HA. ERBB receptors and cancer: the complexity of
targeted inhibitors.Nat Rev Cancer2005;5:341–354.
63. Normanno N, De Luca A, Bianco C, et al. Epidermal growth factor
receptor (EGFR) signaling in cancer.Gene2006;366:2–16.
64. Mitsudomi T, Yatabe Y. Epidermal growth factor receptor in relation
to tumor development:EGFRgene and cancer.FEBS J2010;277:
301–308.
65. Padfield E, Ellis HP, Kurian KM. Current therapeutic advances
targeting EGFR and EGFRvIII in glioblastoma.Front Oncol2015;
5:5.
66. Jutten B, Rouschop KM. EGFR signaling and autophagy dependence
for growth, survival, and therapy resistance.Cell Cycle2014;13:
42–51.
67. Hansen AR, Siu LL. Epidermal growth factor receptor targeting in
head and neck cancer: have we been just skimming the surface?J
Clin Oncol2013;31:1381–1383.
68. Sacco AG, Cohen EE. Current treatment options for recurrent or
metastatic head and neck squamous cell carcinoma.J Clin Oncol
2015;33:3305–3313.
69. Smilek P, Neuwirthova J, Jarkovsky J, et al. Epidermal growth factor
receptor (EGFR) expression and mutations in the EGFR signaling
pathway in correlation with anti-EGFR therapy in head and neck
squamous cell carcinomas.Neoplasma2012;59:508–515.
70. Keren S, Shoude Z, Lu Z, et al. Role of EGFR as a prognostic factor
for survival in head and neck cancer: a meta-analysis.Tumour Biol
2014;35:2285–2295.
71. Sasaki T, Hiroki K, Yamashita Y. The role of epidermal growth factor
receptor in cancer metastasis and microenvironment.Biomed Res Int
2013;2013:546318.
72. Seton-Rogers S. Tumorigenesis: pushing pancreatic cancer to take off.Nat Rev Cancer2012;12:739.
73. Presneau N, Shalaby A, Idowu B, et al. Potential therapeutic targets
for chordoma: PI3K/AKT/TSC1/TSC2/mTOR pathway.Br J Cancer
2009;100:1406–1414.
74. Shalaby AA, Presneau N, Idowu BD, et al. Analysis of the fibroblas-tic growth factor receptor–RAS/RAF/MEK/ERK– ETS2/brachyury
signalling pathway in chordomas.Mod Pathol2009;22:996–1005.
75. Han S, Polizzano C, Nielsen GP, et al. Aberrant hyperactivation of akt and Mammalian target of rapamycin complex 1 signaling in
sporadic chordomas.Clin Cancer Res2009;15:1940–1946.
76. Stacchiotti S, Tamborini E, Lo Vullo S, et al. Phase II study on
lapatinib in advanced EGFR-positive chordoma.Ann Oncol2013;
24:1931–1936.
77. Siu IM, Ruzevick J, Zhao Q, et al. Erlotinib inhibits growth
of a patient-derived chordoma xenograft. PLoS One 2013; 8:
e78895.
78. Linden O, Stenberg L, Kjellen E. Regression of cervical spinal cord compression in a patient with chordoma following treatment with
cetuximab and gefitinib.Acta Oncol2009;48:158–159.
79. Heery CR, Singh BH, Rauckhorst M, et al. Phase I trial of a yeast-based therapeutic cancer vaccine (GI-6301) targeting the
transcription factor Brachyury. Cancer Immunol Res 2015; 3:
1248–1256.
80. Hamilton DH, Litzinger MT, Jales A, et al. Immunological targeting of tumor cells undergoing an epithelial– mesenchymal transition
via a recombinant brachyury–yeast vaccine.Oncotarget2013; 4:
1777–1790.
81. Hamilton DH, Litzinger MT, Fernando RI, et al. Cancer vaccines targeting the epithelial–mesenchymal transition: tissue distribution of brachyury and other drivers of the mesenchymal-like phenotype
of carcinomas.Semin Oncol2012;39:358–366.
82. Lee DH, Zhang Y, Kassam AB, et al. Combined PDGFR and HDAC
inhibition overcomes PTEN disruption in chordoma.PLoS One2015;
10:e0134426.
83. Therkildsen C, Bergmann TK, Henrichsen-Schnack T, et al. The predictive value of KRAS, NRAS, BRAF, PIK3CA and PTEN for anti-EGFR treatment in metastatic colorectal cancer:
a systematic review and meta-analysis. Acta Oncol 2014; 53:
852–864.
84. Sun X, Hornicek F, Schwab JH. Chordoma: an update on the
patho-physiology and molecular mechanisms.Curr Rev Musculoskel Med
2015;8:344–352.
85. Organ SL, Tsao MS. An overview of the c-MET signaling pathway.
Ther Adv Med Oncol2011;3:S7–19.
86. Chou TC. Theoretical basis, experimental design, and computerized simulation of synergism and antagonism in drug combination studies.
SUPPLEMENTARY MATERIAL ON THE INTERNET
The following supplementary material may be found in the online version of this article:
Supplementary materials and methods
Figure S1.T(brachyury) expression in the chordoma cell line panel
Figure S2.Western blot data for p-EGFR and its downstream effectors in MUG-Chor1, U-CH7, U-CH2 and JCH7
Figure S3.Western blots of U-CH1, UM-Chor1 and U-CH2 in the absence of EGF spiking
Figure S4.Western blot analyses of U-CH7, MUG-Chor1 and JHC7 in the absence of EGF spiking
Figure S5.Endogenous/baseline status for the markers investigated
Figure S6.Apoptosis data for U-CH7 and MUG-Chor1
Table S1.STR profiles of the cell lines used in the experiments
Table S2.Summary of compounds included in the single-concentration focused compound screen (n=1097)
Table S3.Biochemical selectivity data for EGFR, ERBB2 and ERBB4 of selected EGFR/ERBB inhibitors (n=14)
Table S4.Antibodies and conditions used for western blot analysis
Table S5.Inhibitory hit rates across all compound libraries included in the single-concentration focused compound screen
Table S6.Enrichment in pathways of targets of non-EGFR hit compounds.
Table S7.FISH data of the cell lines included in the study