The Journal of Nutrition
Ingestive Behavior and Neurosciences
Hedonic Hunger Is Related to Increased Neural
and Perceptual Responses to Cues of Palatable
Food and Motivation to Consume: Evidence
from 3 Independent Investigations
1,2
Kyle S Burger,
3* Abigail J Sanders,
3and Jennifer R Gilbert
3,43Department of Nutrition, Gillings School of Public Health, University of North Carolina at Chapel Hill, Chapel Hill, NC; and 4Department of Psychology, Drexel University, Philadelphia, PA
Abstract
Background:The Power of Food Scale (PFS) seeks to identify individuals who experience high appetitive drive in
response to food cues, which is a construct termed ‘‘hedonic hunger.’’
Objective:The purpose of this study was to assess cross-sectional correlates and predictive power of PFS scores to
probe the construct of hedonic hunger.
Methods:Separate data from 3 studies (study 1,n= 44; study 2,n= 398; study 3,n= 100) were used to evaluate the
construct of hedonic hunger. We examined the correlations between the PFS and neural responsivity during intake and
anticipated intake of palatable foods, behavioral food reinforcement, perceptual hedonic ratings of food images, and
change in body mass index (BMI) and binge eating over time.
Results:Hedonic hunger was strongly related to bilateral brain response in regions implicated in oral somatosensory
processing during cue-elicited anticipation of food intake (study 1; right postcentral gyrus:r= 0.67,P< 0.001; left
postcentral gyrus:r= 0.64,P< 0.001), and was correlated with behavioral food reinforcement (study 2;r= 0.31,P= 0.03)
and perceptual hedonic ratings (study 3;r= 0.24,P= 0.02). Hedonic hunger was not associated with baseline BMI (studies
1–3:P= 0.14, 0.21, and 0.37, respectively) or change in BMI over the 2-y follow-up (studies 1 and 2:P= 0.14 and 0.37,
respectively) but was significantly correlated with baseline binge eating in 2 samples (study 1:r= 0.58,P= 0.001; study 2: r= 0.31,P= 0.02; and study 3:P= 0.02).
Conclusions:Hedonic hunger was not predictive of weight regulation. However, individuals who report high hedonic
hunger are likely to show increased neural and perceptual responses to cues of palatable foods, increased motivation to
consume such foods, and a greater likelihood of current binge eating. J Nutr2016;146:1807–12.
Keywords:
Power of Food Scale, binge eating, fMRI, obesity, food reinforcement, food rewardIntroduction
The dramatic rise in obesity seen in the United States and in
other industrialized nations over the past 40 y has been
frequently credited to increases in the availability of highly
palatable, energy-dense foods and food cues that encourage
increased consumption (1). Despite the ubiquity of
eating-related cues, approximately one-third of Americans are able to
maintain a healthy body weight (1), suggesting that individuals
are differentially susceptible to cues that encourage excess food
consumption. An individual
Õ
s tendency to experience appetitive
thoughts, feelings, and urges about food in response to palatable
food cues has been termed ‘‘hedonic hunger’’ (2). The Power of
Food Scale (PFS)
5was developed to measure individual
differ-ences in hedonic hunger (3). Although other measures, such as
the external eating subscale of the Dutch Eating Behavior
Questionnaire and the Food Craving Inventory, assess individual
differences in drive to consume palatable food (4), the PFS was
designed specifically to assess susceptibility to environmental
food cues, and compared with other external eating measures,
explains unique variations in measures of aberrant eating
be-havior (3, 5).
The PFS is shown to predict a number of behavioral and brain
responses to food cues. Studies that use neuroimaging tools
1
Supported by NIH grants R1MH64560A and DK080760. 2
Author disclosures: KS Burger, AJ Sanders, and JR Gilbert, no conflicts of interest.
*To whom correspondence should be addressed. E-mail: [email protected]. 5
Abbreviations used: EDDI, Eating Disorder Diagnostic Interview; PFS, Power of Food Scale; VR, variable ratio.
ã2016 American Society for Nutrition.
showed that high PFS scores relate to increased neural response
in the insula, a region thought to house the primary taste cortex
(6). In addition, studies showed that PFS scores positively
re-late to binge eating behavior in healthy and eating-disordered
samples (7, 8). Interestingly, whereas models of obesity suggest
that increased susceptibility to environmental food cues leads to
increased consumption of palatable foods, studies reporting that
PFS scores do predict ad libitum consumption of a palatable
food in the absence of hunger are inconsistent (9, 10).
Further-more, reports present mixed results comparing PFS and current
weight status (3, 5, 11), and the scale
Õ
s ability to predict future
weight change has not been examined. Together, these data
suggest that hedonic hunger may not be directly related to food
consumption, as theorized. In addition, there is a lack of evidence
that shows a connection between PFS scores and food reward,
because, theoretically, increased consummatory motivation is
congruent with increased food reward and valuation. In light of
these inconsistent reports, further characterization of hedonic
hunger, the PFS, and associated neurobehavioral responses is
warranted.
Thus, in this report, we provide secondary analyses from
3 studies (12–14) that provide 3 approaches to examine correlates
of hedonic hunger as measured by the PFS. This investigation used
functional neuroimaging to provide an objective measurement
of neural responses to palatable food intake and cue-elicited
anticipation of food intake from study 1 (13), behavioral
assess-ment of food reinforceassess-ment with the use of a progressive
reinforce-ment button-pressing task from study 2 (12), perceptual hedonic
food ratings with the use of visual analog scales from study 3 (14),
and longitudinal changes in measured body mass and binge eating
collected in all 3 studies. Together, the 3 studies used different,
unique measures to give a more coherent characterization of hedonic
hunger and the PFS. Given the theoretical aim of the PFS, we
hypothesized that PFS scores (i.e., greater hedonic hunger)
would be positively correlated with neural responsivity in
reward-, gustatory-, and somatosensory-related brain regions
during intake and anticipated intake of palatable food, greater
behavioral food reinforcement, and higher perceptual hedonic
food ratings. Moreover, we hypothesized that hedonic hunger
would be associated with, and predict increases in, body mass
and binge eating over time. We tested the correlation between
hedonic hunger and brain activity with the use of data from
study 1. Data from study 2 were used to examine the
correla-tion between hedonic hunger and food reinforcement, and study
3 was used to test the correlation between hedonic hunger and
food ratings. The relation between hedonic hunger and weight
change and binge eating was assessed by using data from studies
1 and 2.
Methods
Participants
Study 1 participants.Forty-four young women (mean6SD age: 20.86 1.3 y) were recruited from a large college campus in Oregon to partic-ipate in a weight-gain-prevention intervention study. Two-thirds of participants were in the normal-weight range [BMI (in kg/m2): 23.86 2.9]. Seventy-nine percent of participants reported being white, 8% Asian/Pacific Islander, 8% multiethnic, 2% Native American, and 2% Hispanic. Individuals who reported binge eating or compensatory behaviors in the previous 3 mo, use of psychotropic medications or illicit drugs, head injury with a loss of consciousness, or current Axis I psychiatric disorder were excluded. The weight-control intervention had no effect on the measures reported and was included as a covariate in the analyses.
Study 2 participants.Participants were 398 college freshman women (mean6SD age: 18.460.6 y) recruited from a large state university to participate in a study evaluating body acceptance interventions. Partici-pants had a mean BMI of 23.86 4.3 at baseline. The sample was 7% Asian/Pacific Islander, 1% African American, 8% Hispanic, 83% European American, and 2% other or mixed racial heritage. Informed written consent was obtained before data collection. The sole exclusion criterion was a current diagnosis ofDiagnostic and Statistical Manual of Mental Disorders,Fourth Edition, anorexia nervosa, bulimia nervosa, or binge eating disorder.
Study 3 participants.Participants were 100 individuals (mean6SD age: 32.7611.3; 42 men and 58 women) recruited via flyers, e-mail distribution lists, and website message boards in the Denver Metro and Northern Colorado areas. Most participants were in the nonobese weight range (BMI: 25.967.3); 85% reported being white, 9% black, 2% Asian/Pacific Islander, and 1% Native American. Individuals were excluded if they reported having a visual disability that would affect the ability to differentiate colors, impaired night vision, or any developmental impairment that could affect the ability to complete the measures. Each participant provided written consent and completed all procedures and measures. The local institutional review boards approved studies 1, 2, and 3.
Study 1 measures
Hedonic hunger. The PFS is an 18-item self-report measure of responsivity to appetitive cues, which aims to assess responsivity to om-nipresent food cues in our environment (3). Respondents are instructed to indicate the extent to which each statement describes their personal experience. Examples of PFS items include the following: ‘‘If I see or smell a food I like, I get a powerful urge to have some’’; ‘‘It seems like I have food on my mind a lot’’; and ‘‘I think I enjoy eating a lot more than most other people.’’ Response options are on a 5-point Likert scale, anchored with 1 ‘‘donÕt agree at all’’ to 5 ‘‘strongly agree.’’ PFS total scores range from 18 to 90, with higher scores indicating greater appetitive responsivity. Participants in all 3 studies completed the PFS at baseline. In study 1, participants completed the PFS again at the 3- and 6-mo follow-ups. In study 2, the PFS was implemented at the 6-wk and 6-mo follow-follow-ups.
Body mass.BMI was used to reflect adiposity (15) at baseline and at the 6-wk, 6-mo, 1-y, and 2-y follow-ups for participants in study 1; at baseline and at the 3-mo, 6-mo, 1-y, and 2-y follow-ups for participants in study 2; and at baseline only in study 3. For all participants at each assessment, after removal of shoes and coats, height was measured to the nearest millimeter by using a standard stadiometer, and weight was assessed to the nearest 0.1 kg by using a digital scale. Two measures of both height and weight were obtained and averaged per assessment.
Binge eating. The Eating Disorder Diagnostic Interview (EDDI), a semistructured interview adapted from the Eating Disorder Examination (16), assessedDiagnostic and Statistical Manual of Mental Disorders, Fourth Edition, eating disorder symptoms, including binge eating. Female assessors attended 24 h of training, wherein they received instruction in interview skills, reviewed diagnostic criteria for eating disorders, observed simulated interviews, and role-played interviews. Assessors showed high interrater agreement (k> 0.80) with supervisors using 12 tape-recorded interviews conducted with individuals with and without eating disorders before collecting data. Weekly consensus meetings were used to resolve diagnostic ambiguities. EDDI eating disorder diagnoses have shown test-retest reliability (k= 0.96) and interrater agreement [k= 0.86 (17)].
a cue preceding receipt of palatable food. Stimuli consisted of an image (glass containing a milkshake or a glass of water) that signaled the delivery of 0.5 mL of either of the tastants (chocolate milkshake or tasteless solution). The visual stimulus was presented for 2 s by using a digital projector/reverse screen display. A manifold was fit into the participantsÕmouths, which delivered the tastant to a consistent segment of the tongue. The tasteless solution, which was designed to mimic the natural taste of saliva, was noncaloric and consisted of 25 mM KCl and 2.5 mM NaHCO3(18). During 40% of the milkshake and tasteless-solution trials, the taste was not delivered as expected in order to allow the investigation of the neural response to the cue preceding receipt not confounded by actual receipt of the tastant. Fluids were delivered by using programmable syringe pumps controlled by Matlab (Mathworks, Inc.) to ensure consistent volume, rate, and timing of taste delivery.
Study 2 measures
Participants in study 2 completed measures of hedonic hunger, body mass, and binge eating as described above. Although binge eating was used as an exclusion criterion in study 2, the EDDI is a more sensitive measure than that used during screening. Therefore, there were binge-eating episodes present at baseline in study 2.
Participants in study 2 completed the Epstein Task progressive reinforcement paradigm (19). In this task, participants worked to earn points toward a snack food reward of their choice (e.g., small servings of salted peanuts, chips, peanut butter cups, Mars M&MÕs, or cookies). First, participants performed a taste test of 1 g of each food and then selected the snack food they wanted to earn in the progressive reinforcement task. In the second phase, 3 boxes varying in shape and color are displayed on a computer screen. The boxes flip, rotate, and change in color each time the participant presses the mouse button. Points can be earned each time the shapes match in color and shape after the participant presses a button. A total of 5 points are worth 1 standard portion of the food (per the nutritional information for the snack). The task starts at a variable ratio (VR) 1:4 schedule, meaning that, on average, 1 point is awarded for every 4 button presses. The progressive ratio schedule for the food item doubles (VR8, VR16, VR32, etc.) each time the participant earns 5 points for 1 snack portion. Participants played for as long as they liked and were allowed to consume earned food upon task completion. This food reinforcement paradigm shows 2- to 7-d test-retest reliability [r= 0.80 (14)]. Previous data suggest that food reinforcement is positively related to ad libitum intake, higher hedonic ratings, and BMI (19–21).
Study 3 measures
Participants in study 3 completed measures of hedonic hunger and body mass as described in study 1 methods. Binge eating was not assessed in this study. This study did not include follow-up assessment.
In study 3, participants used the ImageRate protocol developed by our laboratory to assess the hedonic ratings of foods (14). The computer program ImageRate presented food images, one at a time, in random order, and was previously reported to be a reliable instrument to assess hedonic ratings of food images (14). Perceptual hedonic ratings were assessed by a measure of food appeal, which queried ‘‘How appealing is this food?’’ anchored by 0 (‘‘Not appealing at all’’) to 100 (‘‘Extremely appealing’’). Food categories (energy-dense entr´ees, meats, desserts, fruit, light entr´ees, seafood, and breads) were determined by using indepen-dent component analyses of perceptual hedonic ratings as described in reference 22.
Neuroimaging processing and statistical analyses
Neuroimaging data collected in study 1 were preprocessed and analyzed primarily by using SPM12 (Functional Imaging Laboratory, University College of London) in Matlab for Mac OSX. All images were manually realigned to the AC-PC line in SPM and skull-stripped by using the Brain Extraction Tool in FSL (FMRIB Analysis Group). Anatomic data were segmented and normalized by using DARTEL, resulting in a sample-specific template and individual-level deformation fields for application to the normalization step during functional data preprocessing. Func-tional data were as follows:1) slice-timing-corrected because these methods can successfully compensate for the temporal offset between slice
acquisition and can therefore increase the robustness of the data analysis (23),2) adjusted for variation in magnetic field distortion by using field maps, 3) realigned to the mean functional and coregistered with the anatomical image, and4) normalized to Montreal Neurological Institute (24) space by using the DARTEL template and deformation field output, which allows more precise alignment (25). Last, functional data were smoothed to 6 mm Gaussian full width at half maximum function. Functional data were then assessed for detected spikes in global mean response and motion outliers in the functional data by using the Artifact Detection Toolbox (Gabrieli Lab, McGovern Institute for Brain Research). Motion variables were included as regressors in the design matrix at individual-level analysis. Image volumes where thez-normalized global brain activation exceeded 3 SDs from the mean of the run or showed >1 mm of composite (linear plus rotational) movement were flagged as outliers and deweighted during individual-level model estimation.
At the individual level, T-maps were constructed for comparison of activation within each participant for contrasts on the individual level (e.g., milkshake receipt > tasteless-solution receipt). These individual contrasts were entered into a second-level regression model with PFS scores. Whole-brain analyses were conducted after the biranized sample-specific gray matter mask was applied. An overall significance level of cluster-level q-false discovery rate <0.05 was considered significant and corrected for multiple comparisons across the gray matter–masked whole brain. Effect sizes (r) for neuroimaging data were calculated as (Z/On).
Analyses of non-fMRI data collected from all studies were considered significant with 2-sided hypotheses at P < 0.05. All data were first checked for assumptions of normality and overly influential data points. CronbachÕsawas used to assess internal consistency, and PearsonÕsrwas used in correlational analyses and test-retest reliability of the PFS. In the 2 prospective studies (studies 1 and 2), BMI and binge eating were used from all available points in mixed-effects growth curve analyses [version 9.3; SAS Institute (26)] to model weight change (or change in binge eating). After this, we1) examined empirical growth plots,2) fit an un-conditional means model,3) fit an unconditional linear growth model, and4) fit unconditional nonlinear models. Data are presented as means6 SDs unless otherwise noted.
Results
Neural and behavioral correlates of hedonic hunger.
From
data collected in study 1, when assessing the BOLD response to
the anticipatory food cue (> anticipatory tasteless-solution cue)
contrast as a function of hedonic hunger (study 1,
n
= 44), we
observed robust bilateral activity in the oral somatosensory
region of the postcentral gyrus, extending into the central
opercu-lum (
Table 1
,
Figure 1
). No significant relation was observed
between hedonic hunger and responsivity to the palatable food
receipt (> tasteless-solution receipt). From this receipt contrast,
we observed a peak in the premotor area of the precentral gyrus
that could be considered trending (Montreal Neurological
Institute: 51, 6, 24;
k
= 19;
Z
= 4.8,
r
= 0.72; voxel-level
family-wise error rate
P
= 0.04). This peak voxel met a common
voxel-level threshold of significance (whole-brain family-wise
error rate
P
< 0.05) but failed to meet the cluster-level significance
threshold of q-false discovery rate <0.05 used here. There was no
significant BOLD response negatively associated with hedonic
hunger to either cue-elicited anticipation or receipt, meaning that all
BOLD responses were related to the cue presented. Measured in
study 2, ‘‘food reinforcement,’’ as defined by the breakpoint at
which the participant stopped the food reinforcement behavioral
task, was positively related to hedonic hunger (
r
= 0.31,
P
= 0.03).
Hedonic hunger, body mass, and binge eating.
In the 3
3 studies (study 1:
r
=
2
0.22,
P
= 0.14; study 2:
r
= 0.05,
P
= 0.37;
study 3:
r
= 0.13,
P
= 0.21). Hedonic hunger did not predict future
weight change (study 1:
r
=
2
0.22,
P
= 0.14; study 2:
r
= 0.05,
P
=
0.37). Hedonic hunger was positively related to current binge eating
episodes in both study 1 (
r
= 0.58,
P
< 0.001) and study 2 (
r
= 0.31,
P
= 0.02). Conversely, hedonic hunger predicted future decreases in
binge eating (study 1:
r
=
2
0.41,
P
< 0.05) and showed no relation
with change in binge eating in the large sample (study 2:
r
= 0.02,
P
= 0.69). Binge eating was not assessed in study 3.
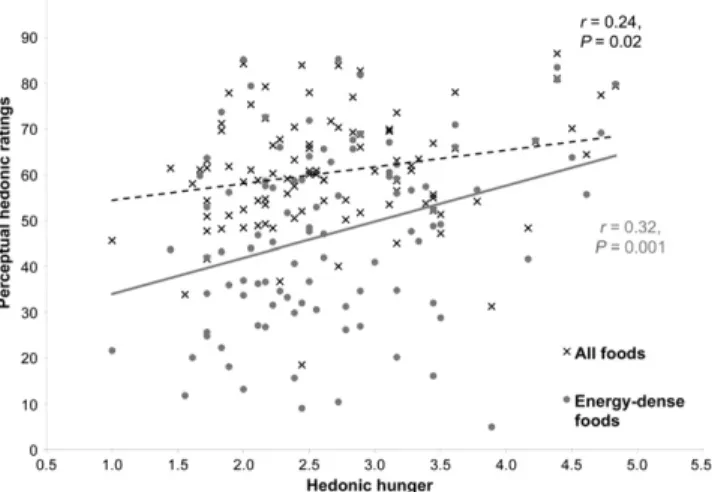
Perceptual food ratings and hedonic hunger.
In study 3,
participants
Õ
(
n
= 100) overall perceptual ratings of food appeal
were positively related to hedonic hunger (
r
= 0.24,
P
= 0.02;
Figure 2
). Interestingly, this effect was driven by the ratings for
the energy-dense entr´ee (
r
= 0.32,
P
= 0.001) and meat (
r
= 0.21,
P
= 0.033) categories. Hedonic hunger was not related to ratings
of the dessert (
r
= 0.13,
P
= 0.19), fruit (
r
=
2
0.09,
P
= 0.38),
light entr´ee (
r
= 0.07,
P
= 0.49), seafood (
r
= 0.18,
P
= 0.08), or
bread (
r
= 0.14,
P
= 0.18) categories.
Internal consistency and temporal reliability of the PFS.
The PFS showed internal consistency in both study 1 (Cronbach
Õ
s
a
= 0.95,
n
= 44) and study 2 (Cronbach
Õ
s
a
= 0.94,
n
= 389). The
PFS showed test-retest reliability in study 1 from baseline to the
3-mo (
r
= 0.84,
P
< 0.001) and 6-mo (
r
= 0.73,
P
< 0.001)
follow-ups. This was also seen in study 2 from baseline to the 6-wk
(
r
= 0.78,
P
< 0.001) and 6-mo (
r
= 0.72,
P
< 0.001) follow-ups.
Discussion
Data indicate that hedonic hunger as measured by the PFS is
positively related to the following:
1
) BOLD response in brain
regions commonly associated with oral somatosensory
process-ing durprocess-ing cue-elicited anticipation of palatable food (study 1);
2
) food reinforcement (study 2);
3
) perceived appeal of foods,
particularly energy-dense foods (study 3); and
4
) current binge
eating (studies 1 and 2). These data indicate that self-reported
hedonic hunger is related to an elevated response to food stimuli
independent of modality (i.e., brain response, observed behavior,
or explicit ratings). In addition, the present results support
previous reports of internal consistency and temporal reliability
(3, 5), supporting that hedonic hunger is a stable construct. In
summary, the heightened responses to external food stimuli
re-ported suggest that that an individual reporting greater hedonic
hunger is hyperresponsive to the external food environment. In
line with this notion, hedonic hunger was related to increased
binge eating. However, hedonic hunger was not related to BMI
or change in BMI, suggesting that the relation between hedonic
hunger, habitual energy intake, and weight regulation is less clear.
Data from the fMRI study showed that hedonic hunger is
positively correlated with the BOLD response in brain regions
previously associated with oral somatosensory processing
dur-ing the anticipatory cue preceddur-ing the intake of palatable food.
Activity in the postcentral gyrus is thought to encode the
somatosensory aspects of stimuli (e.g., touch, taste, and
prop-erties of food such as viscosity and fat). Differential response
patterns in the oral somatosensory regions have also been shown
between obese and lean individuals when exposed to
anticipa-tory food cues, showing that differential neural responses can
lead to BMI change (27, 28). Moreover, greater basal
somato-sensory functioning in this area has been posited as a risk factor
for obesity (29). Although our findings did not support a direct
association between PFS scores and weight gain, PFS scores do
correlate with neural activity that confers risk for weight gain.
Food reinforcement has previously been associated with
obesity as well as increased acute food intake (20), indicating
that individuals who are more willing to work for palatable food
are more likely to consume greater amounts of food in an ad
libitum assessment. These individuals are also more likely to be
obese. This supports our findings in the neuroimaging data, in
which we also observed a positive relation between hedonic
hunger and food reinforcement via an operant behavioral task.
Collectively, the above findings support the notion that
individ-uals reporting high hedonic hunger have greater anticipatory
response to food stimuli and are more willing to work to receive
this food.
TABLE 1 Regional brain response to cue-elicited anticipated
receipt of a palatable food as a function of hedonic hunger in a sample of nonobese young women (study 1)1
Postcentral
gyrus x, y, z2 k3 Peak Zvalue r4 PeakP5
Right 60,218, 36 1016 4.40 0.67 5.531026
60,29, 15 4.08 0.62 2.931025
63,26, 18 3.86 0.58 5.631025
54,212, 21 4.08 0.62 1.131024
Left 254,218, 45 506 4.23 0.64 1.131025
248,221, 33 4.09 0.62 2.231025
263,215, 27 3.54 0.54 2.031024
251,29, 39 3.33 0.50 4.331024
1n= 44.
2Stereotactic coordinates in Montreal Neurological Institute space (24). 3k= Number of contiguous voxels.
4Effect sizes calculated as (Z/On).
5Cluster significant q-false discovery rate,0.05 corrected across the whole brain. 6The 18-item measure was used instead of the final 15-item version (3, 5).
Hedonic hunger was positively related to binge eating
behav-ior in both of the samples in which it was assessed, but it was not
related to body mass in any of the 3 studies. This phenomenon of
finding a correlation between binge eating and hedonic hunger
but not BMI was also found in previous studies (7, 30). Previous
reports related hedonic hunger to the loss of control while eating
in studies in overweight and obese women (31) and women
with eating disorder pathology (7). Collectively, these data suggest
that hedonic hunger may be related to binge eating behavior
independent of weight status or disordered eating symptoms.
The fact that hedonic hunger was not related to BMI in all 3
studies echoes previous reports in the initial validation study and
others (3, 32, 33). However, some studies found a relation
between hedonic hunger and BMI (5, 11). Of note, the 2 studies
reported relatively small effect sizes between BMI and hedonic
hunger [mean
r
Õ
s = 0.12–0.13 (5, 11)], which suggests that this
relation is weak at best. If there were a large effect, one would
expect that results from study 2 (
n
= 398) would be able to show
such a relation. Other studies have suggested that hedonic hunger
is more likely to predict palatable food intake when paired with
a measure for inhibitory control (30, 31). This warrants further
exploration, because our findings suggest that an additional
explanatory variable may be present to explain the lack of
correlation between PFS scores and weight gain. Furthermore,
hedonic hunger was not predictive of BMI change or escalation in
binge eating over time, suggesting that the PFS is not a tool that
identifies risk factors for future weight gain or increases in
disor-dered eating.
Certain limitations in the studies being analyzed should be
acknowledged. First, the interpretation of the present results in
the context of the validity of hedonic hunger and the PFS should
be made with caution. Specifically, we do not suggest that the
current results provide criterion validity for the PFS, but they do
support that an individual indicating greater hedonic hunger
may also show greater responses in neural, behavioral, and
per-ceptive measures of food reward and/or reinforcement.
How-ever, given our findings, this does not directly indicate that these
neural and behavioral responses are driving factors in the
assessment of hedonic hunger. Considering the methodologic
limitations of these studies, the samples in studies 1 and 2 consisted
of women recruited for a body-acceptance and weight-management
intervention, which limits generalizability. Of note, the presented
data did not differ as a function of intervention group. Second, the
sample size in study 1 is relatively small to detect significant changes
in weight over follow-up, but it is relatively large for an fMRI study.
Moreover, in the anticipatory cue portion of the fMRI paradigm,
participants were exposed to a cartoon drawing of a milkshake and
received only 2 tastants (milkshake and tasteless control solution),
which may also decrease the generalizability of results. In addition,
the participants in study 1 were in a moderately fasted state, which
may increase perceived hunger and cravings, and therefore influence
neural response. Despite these limitations, the collection of results
here presents the first attempt, to our knowledge, to relate a widely
used self-report measure of hedonic hunger to methodologies
thought to capture various aspects of susceptibility to palatable food
stimuli outside of homeostatic needs.
In sum, the results indicate that hedonic hunger, although not
predicative of weight gain, does relate to increased neural and
perceptive responses to cues of palatable foods and to an
in-creased motivation to consume such foods and is associated with
current binge eating. Given the consistent findings with current
binge eating, hedonic hunger may be a useful tool in eating disorder
research and treatment settings. Accurately predicting individual
differences in longitudinal weight regulation is extremely
challeng-ing given the multitude of internal and external factors that
influence food intake along with the variability in individual biology
and physiologic determinates of metabolism. The PFS provides
valuable information with regard to acute response to food stimuli,
which might be more effective in combination with additional
measures that assess other known determinists of habitual food
intake (e.g., impulsivity, stress, socioeconomic status, or dieting).
Acknowledgments
We thank Eric Stice for supporting this manuscript and for data
sharing. KSB, AJS, and JRG were responsible for writing and
revising the manuscript; and KSB assisted in the data collection
and performed the data analyses. All authors read and approved
the final manuscript.
References
1. Flegal KM, Carroll MD, Kit BK, Ogden CL. Prevalence of obesity and trends in the distribution of body mass index among US adults, 1999– 2010 [Internet]. JAMA 2012;307:491–7. [cited 2015 Mar 25]. Available from: http://jama.jamanetwork.com/article.aspx?articleID=1104933. 2. Lowe MR, Butryn ML. Hedonic hunger: a new dimension of appetite?
Physiol Behav 2007;91:432–9.
3. Lowe MR, Butryn ML, Didie ER, Annunziato RA, Thomas JG, Crerand CE, Ochner CN, Coletta MC, Bellace D, Wallaert M, et al. The Power of Food Scale. A new measure of the psychological influence of the food environment. Appetite [Internet]. 2009;53:114–8. [cited 2015 Mar 25]. Available from: http://www.ncbi.nlm.nih.gov/pubmed/19500623. 4. Van Strien T, Frijters JER, Bergers G, Defares PB, Van Strien T, Frijters
JER. The Dutch Eating Behavior Questionnaire (DEBQ) for assessment of restrained, emotional, and external eating behavior. Int J Eat Disord 1986;5:295–315.
5. Cappelleri JC, Bushmakin AG, Gerber RA, Leidy NK, Sexton CC, Karlsson J, Lowe MR. Evaluating the Power of Food Scale in obese subjects and a general sample of individuals: development and measure-ment properties. Int J Obes (Lond) 2009;33:913–22.
6. OÕDoherty J, Rolls ET, Francis S, Bowtell R, McGlone F. Represen-tation of pleasant and aversive taste in the human brain [Internet]. J Neurophysiol 2001;85:1315–21. [cited 2015 Apr 29]. Available from: http://www.ncbi.nlm.nih.gov/pubmed/11248000.
7. Witt AA, Lowe MR. Hedonic hunger and binge eating among women with eating disorders. Int J Eat Disord 2014;47:273–80.
8. Ochner CN, Green D, van Steenburgh JJ, Kounios J, Lowe MR. Asymmetric prefrontal cortex activation in relation to markers of overeating in obese humans. Appetite 2009;53:44–9.
9. Nolan-Poupart S, Veldhuizen MG, Geha P, Small DM. Midbrain response to milkshake correlates with ad libitum milkshake intake in the absence of hunger [Internet]. Appetite 2013;60:168–74. [cited 2015 Mar 25]. Available from: http://www.sciencedirect.com/science/article/ pii/S0195666312004035.
10. Levitsky DA, Shen X. Food Power Scale predicts dessert eating, but not meal eating or portion size effect. Appetite 2008;51:381.
11. Schultes B, Ernst B, Wilms B, Thurnheer M, Hallschmid M. Hedonic hunger is increased in severely obese patients and is reduced after gastric bypass surgery. Am J Clin Nutr 2010;92:277–83.
12. Stice E, Shaw H, Burton E, Wade E. Dissonance and healthy weight eating disorder prevention programs: a randomized efficacy trial [Internet]. J Consult Clin Psychol 2006;74:263–75. [cited 2015 Apr 1]. Available from: http://www.pubmedcentral.nih.gov/articlerender. fcgi?artid=1479305&tool=pmcentrez&rendertype=abstract.
13. Stice E, Yokum S, Blum K, Bohon C. Weight gain is associated with reduced striatal response to palatable food [Internet]. J Neurosci 2010;30:13105–9. [cited 2015 Mar 25]. Available from: http://www. jneurosci.org/content/30/39/13105.short.
14. Burger KS, Cornier MA, Ingebrigtsen J, Johnson SL. Assessing food appeal and desire to eat: the effects of portion size & energy density [Internet]. Int J Behav Nutr Phys Act 2011;8:101. [cited 2015 Mar 25]. Available from: http://www.ijbnpa.org/content/8/1/101.
15. Dietz WH, Robinson TN. Use of the body mass index (BMI) as a measure of overweight in children and adolescents. J Pediatr 1998;132:191–3. 16. Fairburn CG, Beglin SJ. Assessment of eating disorders: Interview or
self-report questionnaire? Int J Eat Disord 1994;16:363–70.
17. Stice E, Marti CN, Shaw H, Jaconis M. An 8-year longitudinal study of the natural history of threshold, subthreshold, and partial eating disorders from a community sample of adolescents [Internet]. J Abnorm Psychol 2009;118:587–97. [cited 2015 Mar 25]. Available from: http:// www.pubmedcentral.nih.gov/articlerender.fcgi?artid=2849679&tool= pmcentrez&rendertype=abstract.
18. Zald DH, Pardo JV. Cortical activation induced by intraoral stimulation with water in humans [Internet]. Chem Senses 2000;25:267–75. [cited 2015 Mar 25]. Available from: http://chemse.oxfordjournals.org/content/ 25/3/267.abstract.
19. Epstein LH, Truesdale R, Wojcik A, Paluch RA, Raynor HA. Effects of deprivation on hedonics and reinforcing value of food [Internet]. Physiol Behav 2003;78:221–7. [cited 2015 Mar 25]. Available from: http://www.sciencedirect.com/science/article/pii/S0031938402009782. 20. Epstein LH, Temple JL, Neaderhiser BJ, Salis RJ, Erbe RW, Leddy JJ.
Food reinforcement, the dopamine D-2 receptor genotype, and energy intake in obese and nonobese humans [Internet]. Behav Neurosci 2007; 121:877–86. [cited 2015 Mar 25]. Available from: http://psycnet.apa. org/journals/bne/121/5/877/.
21. Epstein LH, Wright SM, Paluch RA, Leddy JJ, Hawk LW, Jaroni JL, Saad FG, Crystal-Mansour S, Shields PG, Lerman C. Relation between food reinforcement and dopamine genotypes and its effect on food intake in smokers [Internet]. Am J Clin Nutr 2004;80:82–8. [cited 2015 Mar 25]. Available from: http://ajcn.nutrition.org/content/80/1/82.abstract.
22. Johnson SL, Boles RE, Burger KS. Using participant hedonic ratings of food images to construct data driven food groupings [Internet]. Appetite 2014;79:189–96. [cited 2015 Mar 25]. Available from: http:// www.pubmedcentral.nih.gov/articlerender.fcgi?artid=4104662&tool= pmcentrez&rendertype=abstract.
23. Sladky R, Friston KJ, Tro¨stl J, Cunnington R, Moser E, Windischberger C. Slice-timing effects and their correction in functional MRI [Internet]. Neuroimage 2011;58:588–94. [cited 2015 Feb 25]. Available from: http://www.sciencedirect.com/science/article/pii/S1053811911007245. 24. Mazziotta JC, Toga AW, Evans A, Fox P, Lancaster J. A probabilistic atlas of
the human brain: theory and rationale for its development the international consortium for brain mapping (ICBM). Neuroimage 1995;2:89–101. 25. Klein A, Andersson J, Ardekani BA, Ashburner J, Avants B, Chiang MC,
Christensen GE, Collins DL, Gee J, Hellier P, et al. Evaluation of 14 nonlinear deformation algorithms applied to human brain MRI registration. Neuroimage [Internet]. Elsevier B.V.; 2009;46:786–802. [cited 2015 Mar 25]. Available from: http://dx.doi.org/10.1016/j.neuroimage.2008.12.037. 26. Singer JD. Using SAS PROC MIXED to fit multilevel models,
hierarchical models, and individual growth models. J Educ Behav Stat 1998;23:323–55.
27. Stice E, Spoor S, Bohon C, Small DM. Relation between obesity and blunted striatal response to food is moderated by TaqIA A1 allele [Internet]. Science. 2008;322:449–52. [cited 2015 Mar 25]. Available from: http://science.sciencemag.org/content/322/5900/449.
28. Stice E, Spoor S, Bohon C, Veldhuizen MG, Small DM. Relation of reward from food intake and anticipated food intake to obesity: a functional magnetic resonance imaging study [Internet]. J Abnorm Psychol. 2008;117:924–35. [cited 2015 Mar 25]. Available from: http:// psycnet.apa.org/journals/abn/117/4/924/.
29. Wang G-J, Geliebter A, Volkow ND, Telang FW, Logan J, Jayne MC, Galanti K, Selig PA, Han H, Zhu W, et al. Enhanced striatal dopamine release during food stimulation in binge eating disorder. Obesity (Silver Spring) [Internet]. Nature Publishing Group 2011;19:1601–8. [cited 2015 Mar 25]. Available from: http://onlinelibrary.wiley.com/doi/10.1038/oby.2011.27/abstract; jsessionid=FEB207D2D1BF57263F091C30365667BA.f04t02.
30. Appelhans BM. Neurobehavioral inhibition of reward-driven feeding: implications for dieting and obesity. Obesity (Silver Spring) 2009;17:640–7. 31. Manasse SM, Espel HM, Forman EM, Ruocco AC, Juarascio AS, Butryn ML, Zhang F, Lowe MR. The independent and interacting effects of hedonic hunger and executive function on binge eating [Internet]. Appetite 2015;89:16–21. [cited 2015 Mar 25]. Available from: http://linkinghub.elsevier.com/retrieve/pii/S0195666315000227. 32. Davis CA, Levitan RD, Reid C, Carter JC, Kaplan AS, Patte KA, King
N, Curtis C, Kennedy JL. Dopamine for ‘‘wanting’’ and opioids for ‘‘liking’’: a comparison of obese adults with and without binge eating. Obesity (Silver Spring) 2009;17:1220–5.