Influence of Different Levels of Lipoic Acid
Synthase Gene Expression on Diabetic
Nephropathy
Longquan Xu1, Sylvia Hiller1, Stephen Simington1, Volker Nickeleit1, Nobuyo Maeda1, Leighton R. James2*, Xianwen Yi1*
1 Department of Pathology and Laboratory Medicine, University of North Carolina, Chapel Hill, North Carolina, United States of America, 2 Division of Nephrology and Hypertension, Department of Medicine, University of Florida, Jacksonville, Florida, United States of America
*[email protected](XY);[email protected](LRJ)
Abstract
Oxidative stress is implicated in the pathogenesis of diabetic nephropathy (DN) but out-comes of many clinical trials are controversial. To define the role of antioxidants in kidney protection during the development of diabetic nephropathy, we have generated a novel genetic antioxidant mouse model with over- or under-expression of lipoic acid synthase gene (Lias). These models have been mated with Ins2Akita/+mice, a type I diabetic mouse model. We compare the major pathologic changes and oxidative stress status in two new strains of the mice with controls. Our results show that Ins2Akita/+mice with under-expressed Lias gene, exhibit higher oxidative stress and more severe DN features (albu-minuria, glomerular basement membrane thickening and mesangial matrix expansion). In contrast, Ins2Akita/+mice with highly-expressed Lias gene display lower oxidative stress and less DN pathologic changes. Our study demonstrates that strengthening endogenous antioxidant capacity could be an effective strategy for prevention and treatment of DN.
Introduction
Alpha-lipoid acid (1, 2-dithiolane-3-pentanoic acid, LA) is a potent antioxidant produced in mitochondria by lipoic acid synthase (LIAS) [1]. Among all natural antioxidants, LA plays a central role in the antioxidant network. It has several unique characteristics that include: 1) serving as a powerful antioxidant in both the oxidized and reduced forms; 2) quenching of a variety of reactive oxygen species (ROS); and 3) regenerating other antioxidants such as oxi-dized vitamins C and E, coenzyme Q10 and glutathione [2,3]. LA is also a cofactor for several mitochondrial enzymes such as pyruvate dehydrogenase complex andα-ketoglutarate dehy-drogenase complex, both of which participate in energy generation [4]. Complete lack of the
Liasgene leads to mouse embryonic death, further underscoring the pivotal role LA plays in antioxidant defense and as a metabolic requirement [5].
Diabetic nephropathy (DN) is a leading cause of end-stage renal disease [6]. Oxidative stress has been suggested to play an important role in the development of DN [7,8]. On the basis of
a11111
OPEN ACCESS
Citation: Xu L, Hiller S, Simington S, Nickeleit V,
Maeda N, James LR, et al. (2016) Influence of Different Levels of Lipoic Acid Synthase Gene Expression on Diabetic Nephropathy. PLoS ONE 11 (10): e0163208. doi:10.1371/journal.
pone.0163208
Editor: Jian Fu, University of Kentucky, UNITED
STATES
Received: October 1, 2015
Accepted: September 6, 2016
Published: October 5, 2016
Copyright:©2016 Xu et al. This is an open access article distributed under the terms of theCreative Commons Attribution License, which permits unrestricted use, distribution, and reproduction in any medium, provided the original author and source are credited.
Data Availability Statement: All relevant data are
within the paper.
Funding: The study design, data collection and
analysis, decision to publish, or preparation of the manuscript are supported by Juvenile Diabetes Research Foundation (5-2011-471) and Diabetic Complications Consortium DCC)3U24DK076169-0452 grants.
Competing Interests: The authors have declared
epidemiological evidence, antioxidant therapy is a plausible strategy for treatment of this oxi-dative stress-related disease. However, there are conflicting reports regarding the effect of chronic dietary supplementation with antioxidants on outcomes of diabetic kidney disease in clinical trials [9–12]. An explanation for these observations is that natural genetic variation leads to inter-individual variations with respect to basic endogenous antioxidant levels. Indeed, it is well known that natural genetic variation affects gene expression levels and thus impacts molecular and physiological phenotypes such as protein expression levels. As a consequence, different endogenous antioxidant levels in tested individuals may influence experimental results and outcome of clinical trials aimed at examining the impact of antioxidant therapy on disease course. Thus, we hypothesize that the extent of oxidative damage is mainly dependent on endogenous antioxidant levels, especially in the initiation stage of diseases in which oxida-tive stress is implicated. To test our hypothesis, we have generated a group of unique lipoic acid hypomorphic and hypermorphic antioxidant mice by genetically modifying the 3’-untranslated region (3’-UTR) of lipoic acid synthase; this strategy is a similar approach that has been previ-ously reported [13]. By comparing the major parameters of DN and oxidative stress inIns2
A-kita/+
type 1 diabetic mice with different levels of endogenousLiasgene expression, we sought to define the role of oxidative stress in the onset and development of DN and obtain a better understanding of impact of antioxidants.
Materials and Methods
Creation of Lias
Low/+and Lias
High/+Mice by Changing 3’ untranslated
region (3’-UTR) Sequences
The targeting construct prior to recombination consisted of a 3’-UTR of the endogenousLias
gene and was replaced after recombination with a cassette. The cassette consisted of the 3’-UTR sequences of bovine growth hormone gene (bGH) and aNeogene, two lox P sites flanking the two fragments, and followed by the 3’-UTR ofcFosgene. Colonies surviving after selection with G418 and ganciclovir were first screened by PCR with the following primers: a common primer (50-CTA AAG TGT AGC CAA GCC CT-30), a primer for screeningLias3’-UTR (50-C
CT CCT CAG CTA CTG ACA TT-30), a primer for bGH 3’-UTR (50-GAG GCA AAC AAC AGA TGG CT-3’) and a primer for cFos 3’-UTR (50-CTT CTC TGA CTG CAG ATC CT-3’).
Targeted Embryonic stem (ES) cells were identified by the presence of approximately 200 bp PCR product for bGH 3’-UTR, and 300 bp after Cre recombinase-mediated recombination. Germline recombination was achieved using the B6.FVB-Tg (EIIa-Cre) stock (JAX#3724). These results were confirmed by Southern blot analysis.
The hypomorphic (LiasLow/Low) and hypermorphic (LiasHigh/High)Liasmice in C57BL/6 genetic background, with 25% or 150% of wildtypeLiasgene expression respectively, were mated with C57BL/6-Ins2Akita/+diabetic mice (JAX#3548), an established mouse model of type I diabetes mellitus [14,15]. TheIns2Akita/+mice have a mutation changing cysteine 96 to tyro-sine in the insulin 2 gene and exhibit marked hyperglycemia as early as 4 weeks of age [15]. Eight B6-LiasLow/LowIns2Akita/+males and 9 B6-LiasHigh/HighIns2Akita/+males were obtained from crossing C57BL/6-Ins2Akita/+female mice andLiasLow/LoworLiasHigh/Highmale mice. Only males were phenotyped in this study becauseIns2Akita/+females on the B6 genetic back-ground displayed much less severe diabetic phenotype than the males [16].Lias+/+Ins2Akita/+
mice served as a control. In addition, the mice were fed normal mouse chow (Research Diets, Inc. New Brunswick, NJ) and hadad libitumaccess to autoclaved water. All animal protocols were approved by the University of North Carolina at Chapel Hill Institutional Animal Care and Use Committee (Protocol numbers: 13-208-0 and16-153-0).
Abbreviations: DN, diabetic nephropathy; Lias, LA,
Biochemical Parameters
Blood glucose was monitored monthly in the mice from 7 to 28 weeks using the One-Touch Lifescan meter (Lifescan Inc, Milpitas, CA) on samples obtained after a 5-hour fasting period. Plasma glucose, total cholesterol and triglyceride were examined using assay kits (Wako, Rich-mond, VA). Lactic acid concentration in tissues was determined as described [17]. Pyruvate concentration was measured using a pyruvate assay kit (BioVision, Mountain View, CA).
Urinary Albumin Excretion
At 28 weeks of age, individual mice were placed in metabolic cages to record food consump-tion, water intake, body weight, and urine output for 48 hours prior to sacrifice. Urine albumin inLiasHigh/HighIns2Akita/+andLiasLow/LowIns2Akita/+mice was assessed by ELISA using Albu-well according to the manufacturer’s instructions (Exocell, Philadelphia, PA). Urinary creati-nine levels were determined by the Creaticreati-nine Kit (Exocell) according to the manufacturer’s instructions.
Urinary MCP-1 assay
Urinary monocyte chemoattractant protein-1 (MCP-1) excretion was measured as markers of renal inflammation. The MCP-1 concentration was measured using an ELISA assay kit (Research & Diagnostic Systems, Minneapolis, MN) according to the manufacturer’s instruc-tions. The ELISA kit was specific for mouse MCP-1 and sensitive down to 2 pg/ml. The MCP-1 concentration was normalized to the urinary creatinine concentration.
Blood Pressure Measurement
Systolic blood pressure (BP) was determined in conscious mice using a tail-cuff method [18]. The first 10 readings were discarded, and 30 readings were taken to obtain daily BP. Average BP on 5 consecutive days was taken to represent BP of each mouse.
Renal Function and Morphometric Analyses
slight swelling, 2) mitochondrial swelling and cristae dilated/disorder, and 3) mitochondrial vacuolization. On the basis of the above criteria, the degree of mitochondrial damage in the dif-ferent groups of mice were scored and the total scores of mitochondria per group were summa-rized and then divided by total counted mitochondrion number in each group to get the ratio of damaged over total counted mitochondrion number. The ratio indicates the degree of mito-chondrial damage.
Assessment of Oxidative Stress
To evaluate oxidative stress, the concentration of urinary 8-isoprostane was measured using an enzyme immunoassay and expressed relative to the level of urine creatinine following the man-ufacturer’s protocol (Cayman Chemical Inc., Ann Arbor, MI). Systemic oxidative stress in blood was determined using 4-Hydroxynonenal (4-HNE) assay kit in accordance with manu-facturer’s specifications (Cell Biolabs, Inc. San Diego, CA).
Western Blot Analysis
Total protein was extracted from the renal cortical tissues with RIPA buffer and protein con-centration was determined by BCA protein assay method (Thermo Scientific, Rockford, IL) fol-lowing manufacturer’s instructions. Western blot analysis was performed using a rabbit polyclonal antibody against mouse LIAS (GeneTex, Inc.Irvine, CA), and (voltage-dependent anion-selective channel protein 1) VDAC1 as mitochondrial loading control (Abcam, Cam-bridge, MA) and the protein bands were quantified with Image Quant LAS4000 software (GE Healthcare, Piscataway, NJ).
Reverse Transcription and Quantitative Real-Time Polymerase Chain
Reaction (RT-PCR)
Total RNA was extracted from kidney cortex using an ABI 6700 Automated Nucleic Acid Workstation following the manufacturer’s protocol (Applied Biosystems, Foster City, CA). Rel-ative mRNA amounts were determined using real-time quantitRel-ative reverse transcriptase-PCR (Applied Biosystems) withβ-actin as the reference gene in each reaction [18]. The expression of the genesLias, superoxide dismutase 2(Sod2), transforming growth factorβ1 (Tgfβ1), nuclear factor (erythroid-derived 2)-like 2 (Nrf2) and NADPH oxidase 4 (Nox4) were examined.
Statistical Analyses
Data were expressed as mean ± standard error of the mean (SEM).P<0.05 was considered significant.Pvalues are obtained for comparisons amongLiasLow/LowIns2Akita//+,LiasHigh/High Ins2Akita/+andLias+/+Ins2Akita/+mice using one-way or two-way ANOVA. Post hoc pairwise comparisons were performed by Tukey–Kramer honestly significant differences (HSD) test (JUM, SAS Institute, Cary, NC).
Results
Model Construction
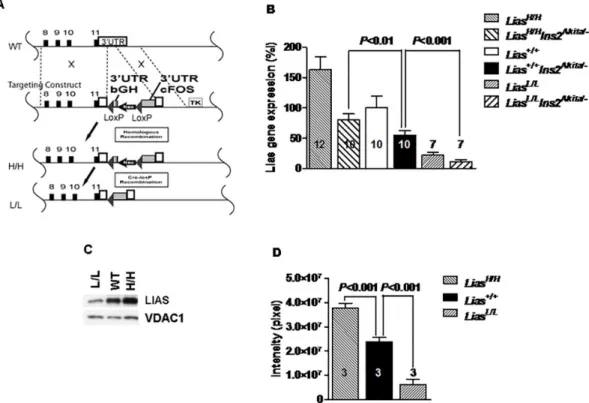
C57BL/6J recipient blastocysts, which were transferred to the uteri of CD-1 pseudopregnant dams. These mice initially produced stabilized transcripts of theLiasgene using the 3’-UTR sequence ofbGH, but were changed to unstable transcripts using the 3’-UTR from thecFosgene after Cre-LoxP recombination was induced. TheLiasHigh/+mice were crossed with Tg (Ella-cre) mice that expressed Cre-recombinase in testis and thus the homozygous offspring (LiasLow/Low) generated from theseLiasLow/+founder males expressed low levels ofLias. Since plasma and tis-sue LA were not directly measured due to a technical difficulty [19], changes in organ LA levels were inferred by demonstrating changes inLiasgene expression using RT-PCR (Fig 1B) or West-ern blot (Fig 1C). Western blot results for kidney LIAS, quantitatively assessed by densitometry, showed that LIAS protein concentrations were about 150% inLiasHigh/Highmice and around 25% inLiasLow/lowmice, compared with those inLias+/+mice (Fig 1D).
Systemic Pathological Changes
The hypomorphic (LiasLow/Low) and hypermorphic (LiasHigh/High)Liasmice, with 25% or 150% of wildtypeLiasgene expression, respectively, were mated withIns2Akita/+diabetic mice, an
Fig 1. Characterizations of the new mouse model. (A) Generation of mice with genetically graded expression of lipoic acid synthase (Lias). Wild type (top line): Endogenous Lias gene 3’-UTR (white column) is located after exon 11 of Lias gene. The targeting construct (second line): consisted of the 3’-UTR sequences of bovine growth hormone (bGH) gene and a Neo gene, two lox P sites flanking the two fragments, and followed by the 3’-UTR of cFos gene and thymidine kinase gene (TK). H/H (third line): The locus after homologous recombination. Lias expression is now controlled by the 3’-UTR of bGH, which stabilizes Lias mRNA. L/L (bottom line): The locus after Cre-lox P recombination. Lias expression is controlled by the 3-UTR of cFos, which destabilizes the Lias mRNA. (B) The kidney mRNA levels of Lias in 12-week-old L/L, H/H and WT male mice and in 28-week-old diabetic L/L, H/ H and WT male mice. Lias gene expression in the non-diabetic WT mice as a reference for the all six groups of mice. (C) Lipoic acid synthase (LIAS) concentrations of kidney cortex mitochondria, measured by Western blot, and VDAC1 as loading control, in 12-week-old L/L, H/H and WT male mice. n = 5, in each group. (D) The amounts of lipoic acid in non-diabetic LiasHigh/Highand LiasLow/Lowkidney, detected by Western blot, were quantified by
Image Quant software. Data are expressed as the mean±SE.
established mouse model of diabetes mellitus that can mimic early stages of DN [14,15]. Lia-sHigh/HighIns2Akita/+andLiasLow/LowIns2Akita/+mice exhibited the different diabetic phenotypes.
LiasLow/LowIns2Akita/+mice had significantly lower body weight compared to bothLiasHigh/High -Ins2Akita/+andLias+/+Ins2Akita/+mice as shown inTable 1(P<0.05). BothLiasHigh/HighIns2Akita/+
andLiasLow/LowIns2Akita//+mice manifested hyperglycemia at 28 weeks of age but there was no significant difference between the two groups of mice. In addition, plasma total cholesterol and triglyceride levels were similar amongLiasHigh/HighIns2Akita/+,LiasLow/LowIns2Akita/+, and
Lias+/+Ins2Akita/+mice (Table 1).
Kidney Pathologic Changes
Urinary albumin/creatinine ratio inLiasLow/LowIns2Akita/+mice was 2.6-fold higher thanLias+/+ Ins2Akita/+mice at 28 weeks of age whereas, the ratio inLiasHigh/HighIns2Akita/+mice was about 30% lower thanLias+/+Ins2Akitamice but was not statistically significant (Fig 2). Dietary intake and water consumption inLiasLow/LowIns2Akita/+andLiasHigh/HighIns2Akita/+mice were not significantly different compared withLias+/+Ins2Akitamice (Table 1). The ratio of kidney weight-to-body weight (KW/BW) inLiasLow/LowIns2Akita/+mice was higher than controlLias+/+Ins2Akita/+mice whereas this ratio was lower inLiasHigh/HighIns2Akita/+mice than in controlLias+/+Ins2Akita/+mice. Kidney levels of lactate and pyruvate were similar in all three diabetic groups (Table 1).
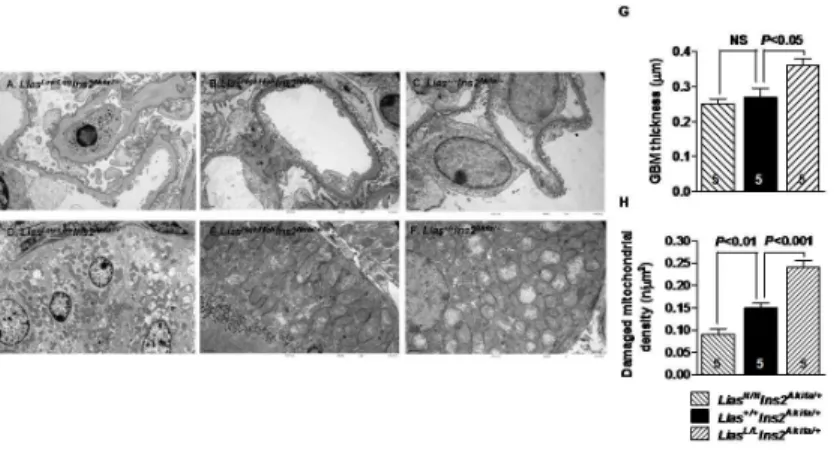
Renal pathological changes were assessed by light and transmission electron microscopy. Mod-erate mesangial matrix expansion, as evidenced by increased accumulation of PAS positive mate-rial in the mesangial area, was observed in 28-week-oldLiasLow/LowIns2Akita/+mice (Fig 3A), whereas mesangial expansion was milder inLiasHigh/HighIns2Akita/+mice (Fig 3C), compared to theLias+/+Ins2Akitacontrol (Fig 3B). Semi-quantitative analysis of PAS-stained kidney sections revealed a higher mesangial expansion score (P<0.05) inLiasLow/LowIns2Akita/+mice as compared withLiasHigh/HighIns2Akita/+andLias+/+Ins2Akita/+mice (Fig 3D). Electron microscopic examina-tion showed thickening of the GBM inLiasLow/LowIns2Akita/+mice (Fig 4A), compared toLias+/+ Ins2Akita/+mice (Fig 4C). Quantitative examination using Image J showed the thickening of the GBM significantly increased (0.36 ± 0.04 μm versus 0.27 ± 0.04 μm in,P<0.05,Fig 4G). Foot pro-cess effacement was primarily detected inLiasLow/LowIns2Akita/+mice (Fig 4A) but podocyte slit pore width did not exhibit significant differences among three groups of the mice. Considerable numbers of mitochondria within proximal tubules inLiasLow/LowIns2Akita/+mice were damaged as revealed by mitochondrial structural irregularities with swelling, disruption of cisternae and vacuolization. In contrast, few damaged mitochondria were observed inLiasHigh/HighIns2Akita/+
mice (Fig 4B and 4E) compared withLiasLow/LowIns2Akita/+andLias+/+Ins2Akita/+mice (Fig 4D and 4F). Damaged mitochondria were quantified inLiasHigh/HighIns2Akita/+andLias+/+Ins2Akita/+
mice at 28 weeks of age. As shown inFig 4H, the average number of damaged mitochondria in proximal tubules ofLiasLow/LowIns2Akita/+mice were significantly increased whereas damaged mitochondria inLiasHigh/HighIns2Akita/+mice were significantly decreased compared toLias+/+ Ins2Akita/+mice. Glomerulosclerosis, arteriolar hyalinosis and focal tubulointerstitial fibrosis were not detectable in all diabeticIns2Akita/+mice at 28 weeks of age regardless ofLiastranscript level. In addition, no electron dense deposits were observed in the glomeruli in all mice.
Oxidative Stress and Inflammation
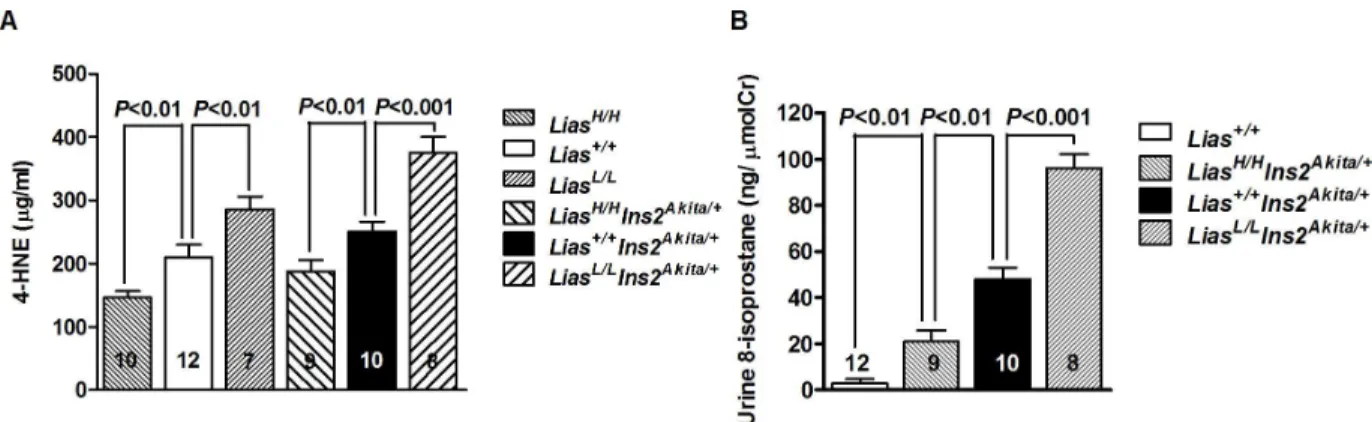
Systemic oxidative stress, assessed by measuring 4-HNE, a well-known product of lipid peroxi-dation and a measure of oxidative stress, was significantly different inLiasHigh/HighIns2Akita/+
contrary,LiasHigh/HighIns2Akita/+mice manifested significantly lower urinary 8-isoprostane lev-els thanLias+/+Ins2Akita/+mice (Fig 5B).
Consistent with Western blot results for LIAS protein, RT-PCR analysis of kidney cortex showed significantly increasedLiasgene expression inLiasHigh/HighIns2Akita/+and significantly reduced expression inLiasLow/LowIns2Akita/+mice at 28 weeks of age (Table 2). Interestingly, gene expression of mitochondrialSod2, a major antioxidant enzyme which responds to enhanced super-oxide production in mitochondria, was significantly higher inLiasLow/LowIns2Akita/+mice, likely reflecting an attempt to compensate for reduced LIAS-generated LA inLiasLow/LowIns2Akita/+
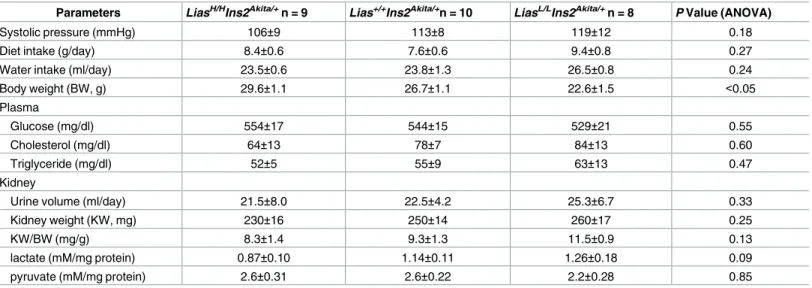
Table 1. Laboratory data in experimental animals.
Parameters LiasH/HIns2Akita/+n = 9 Lias+/+Ins2Akita/+n = 10 LiasL/LIns2Akita/+n = 8 P Value (ANOVA)
Systolic pressure (mmHg) 106±9 113±8 119±12 0.18
Diet intake (g/day) 8.4±0.6 7.6±0.6 9.4±0.8 0.27
Water intake (ml/day) 23.5±0.6 23.8±1.3 26.5±0.8 0.24
Body weight (BW, g) 29.6±1.1 26.7±1.1 22.6±1.5 <0.05
Plasma
Glucose (mg/dl) 554±17 544±15 529±21 0.55
Cholesterol (mg/dl) 64±13 78±7 84±13 0.60
Triglyceride (mg/dl) 52±5 55±9 63±13 0.47
Kidney
Urine volume (ml/day) 21.5±8.0 22.5±4.2 25.3±6.7 0.33
Kidney weight (KW, mg) 230±16 250±14 260±17 0.25
KW/BW (mg/g) 8.3±1.4 9.3±1.3 11.5±0.9 0.13
lactate (mM/mg protein) 0.87±0.10 1.14±0.11 1.26±0.18 0.09
pyruvate (mM/mg protein) 2.6±0.31 2.6±0.22 2.2±0.28 0.85
Data shown are mean values±SEM for the male mice at 28 weeks.
P values are for comparisons among LiasLow/LowIns2Akita//+, LiasHigh/HighIns2Akita/+mice and Lias+/+Ins2Akita/+mice using one way ANOVA.
doi:10.1371/journal.pone.0163208.t001
Fig 2. Changes of urine albumin in the mice. Urine albumin/creatinine ratio in LiasLow/LowIns2Akita//+mice is significantly elevated (P<0.01) whereas the ratio in LiasHigh/HighIns2Akita/+mice is reduced but does not reach
significance, compared with Lias+/+Ins2Akita/+mice at 28 weeks of age. The numbers inside the bars indicate the
number of animals.
kidney. The data confirm our previous observation thatSod2expression also markedly increases in
Lias+/-Ins2Akita/+mice [20]. To identify the ROS sources, we examinedNox4gene expression in kidney cortex. Our result showed thatNox4gene expression was significantly increased at 28-weeks of age inLiasLow/LowIns2Akita/+whereas a significant decrease inLiasHigh/HighIns2Akita/+
kidney suggests that NADPH oxidase is a target for the antioxidant effects of lipoic acid (Table 2). Fig 3. Changes of Lias gene expression influences mesangial matrix expansion (MME). Representative PAS staining of glomeruli in diabetic Ins2Akita//+mice at 28 weeks of age. (A) LiasLow/LowIns2Akita//+mice. (B) Lias+/+Ins2Akita/+mice. (C) LiasHigh/HighIns2Akita/+mice. Original magnification x400, Bars = 50μm. (D) MME
score, quantified as the region of positive PAS staining, is expressed as a function of total glomerular tuft area. The numbers inside the bars indicate the number of animals. LiasLow/LowIns2Akita//+and LiasHigh/HighIns2Akita/+ mice are compared with Lias+/+Ins2Akita/+mice. Values are expressed as the mean±SEM.
doi:10.1371/journal.pone.0163208.g003
Fig 4. Representative electron micrographs from diabetic Ins2Akita//+mice at 28 weeks of age. (A)
Segmentally thickened glomerular basement membrane (GBM) with minor irregularities along the lamina rara externa (“undulations”) and segmental podocyte foot process effacement in LiasLow/LowIns2Akita//+mice. Original magnification, x8,000. (B) LiasHigh/HighIns2Akita/+mice. Original magnification, x8,000. (C) Lias+/+Ins2Akita/+mice.
Original magnification, x8,000. (D) Illustrated is the basal part of a tubular epithelial cell containing distorted mitochondria. Cristae are disrupted and mitochondria filled presumably with lipid products vaguely resembling zebra-bodies in LiasLow/LowIns2Akita//+mice. Original Magnification, x5,000. (E) A small number of damaged
mitochondria in proximal tubular cells of LiasHigh/HighIns2Akita/+mice. Original magnification, x8,000. (F)
Damaged mitochondria in proximal tubular cells of Lias+/+Ins2Akita/+mice. Magnification, x8,000. (G) Electron microscopic quantitative examination using Image J showed thickening of the GBM significant increase in LiasLow/LowIns2Akita/+mice compared to Lias+/+Ins2Akita/+mice. (H) Ratio of average damaged mitochondrion
over entire counted mitochondria in proximal tubules of LiasLow/LowIns2Akita//+, LiasHigh/HighIns2Akita/+and Lias+/+
In addition, significantly reducedTgfβ1gene expression inLiasHigh/HighIns2Akitamice (Table 2) sug-gests that increasedLiasgene expression likely attenuates adverse effect(s) of TGF-β1.
NRF2 is a key transcription factor for regulation of antioxidant defense [21] and LA has been shown to stimulate NRF2 nuclear accumulation [22]. To test whether endogenous LA can affect NRF2, we examinedNrf2gene expression in 28-week-oldLiasLow/LowIns2Akita/+and Lia-sHigh/HighIns2Akita/+mouse kidney. UnlikeSod2,Nox4andTgfb1transcripts, no significant changes inNrf2expression were observed in response toLiasgene manipulation (Table 2).
Inflammation is thought to be a pathogenic factor in the initiation of DN and monocyte chemoattractant protein-1 (MCP-1) is considered as a major mediator of inflammation in DN patients. To further probe the underlying mechanism(s) of endogenous oxidant injury in rela-tion to inflammarela-tion in diabetes mellitus, we measured urinary MCP-1. Our results showed that there were significantly increased urinary MCP-1 levels inLiasLow/LowIns2Akita/+mice com-pared withLias+/+Ins2Akita/+andLiasHigh/HighIns2Akita/+mice (Fig 6).
Discussion
In our previous study, the pathologic changes of diabetic nephropathy (DN) were exacerbated inLias+/-Ins2Akita/+mice with an approximately 50% reducedLiasgene expression, and the aforementioned pathology was associated with significantly enhanced oxidative stress [20]. To verify the central role of LIAS in generating endogenous LA for antioxidant defenses, we Fig 5. Alternated oxidative stress. (A). Oxidative stress in kidney cortex is associated with plasma concentration of lipid perioxidation marker, 4-hydroxynonenal (4-HNE), in diabetic Ins2Akita//+mice and non-diabetic mice with differential Lias gene expression. Lias+/+mice as a control. Data were analyzed using two-way ANOVA. (B). Urine 8-isoprostane varies with Lias
expression in diabetic mice. Data were analyzed using one-way ANOVA. The numbers inside the bars indicate the number of animals in each group. Results are expressed as mean±SEM.
doi:10.1371/journal.pone.0163208.g005
Table 2. Gene expression in kidney cortex.
LiasH/HIns2Akita/-n = 10 Lias+/+Ins2Akita/-n = 10 LiasL/LIns2Akita/-n = 7
Lias 1.39±0.23aa 1.00±0.14 0.19±0.05aa
Sod2 1.05±0.25 1.00±0.16 1.65±0.21a
Tgfβ1 0.67±0.16a 1.00±0.11 1.32±0.19
Nrf2 1.23±0.22 1.00±0.15 0.86±0.2
Nox4 0.57±0.15a 1.00±0.16 1.94±0.26aa
Samples were taken at 7 months of age of the mice. Data shown are mean values±SEM using t-test. a: P<0.05 vs Lias+/+Ins2Akita/+mice.
aa: P<0.01 vs Lias+/+Ins2Akita/+mice mRNA levels of Lias+/+Ins2Akita/+mice were used as references and set to 1.00
manipulatedLiastranscript stability to generate two lines of novel antioxidant mouse models. In one,Liasgene expression was reduced to roughly 25% of normal, a level sufficient to maintain viability (Liasnull mice are embryonic lethal). In the other,Liasgene expression was increased to approximately 150% of normal expression level, which is anticipated to afford better protection, than wildtype mice, against oxidative stress. When combined with the diabetogenicIns2Akita
mutation, the double mutants allow evaluation of the impact of two different antioxidant base-lines (Low or High) on the development of DN. As hypothesized, the new diabetic models exhib-ited divergent renal responses to diabetogenic stress when compared withLias+/+Ins2Akita/+mice. Major DN pathological changes such as albuminuria and mesangial expansion inLiasLow/Low In-s2Akita/+mice were significantly worse than those inLias+/+Ins2Akita/+mice whereas the two patho-logical changes were less severe inLiasHigh/HighIns2Akita/+mice. The data further support the correlation betweenLiastranscript abundance and inferred endogenous LA concentration; levels of two reliable common oxidative stress biomarkers, plasma 4-NHE and urine 8-isopros-tane, were both significantly higher inLiasLow/LowIns2Akita/+mice and significantly lower in Lia-sHigh/HighIns2Akita/+mice compared toLias+/+Ins2Akita/+controls. These results are consistent with our previous data where we used different lipid peroxidation markers, like TBARS and, anti-oxidant marker such as ratio of GSH/GSSG to reveal significantly increased oxidative stress and decreased endogenous antioxidant capacity inLias+/-Ins2Akita/+mice. Since lipoic acid plays a central role in the antioxidant network, the significantly increased oxidative stress and decreased endogenous antioxidant capacity observed inLias+/-Ins2Akita/+mice were very likely due to the impairment of the antioxidant defense system. In addition, our data demonstrate thatLias over-expression effectively attenuates albuminuria and kidney disorders without exerting a significant hypoglycemic effect inLiasHigh/HighIns2Akita/+mice, suggesting that the protective effect of LA results primarily from its antioxidant capacity rather than from a direct hypoglycemic effect. These findings confirm that LIAS-generated lipoic acid plays a vital role in the early development of DN by demonstrating that diabetic mice with low endogenous antioxidant capacity manifestly increased ROS-mediated renal stress. In particular, the new models provide very strong proof-of-principle that an increased antioxidant reservoir could represent a powerful new tool in the Fig 6. Kideny inflammation. Urinary MCP-1 levels in LiasLow/LowIns2Akita/+, Lias+/+Ins2Akita/+and LiasHigh/
High
Ins2Akita/+mice. The numbers inside the bars indicate the number of animals in each group. Results are expressed as mean±SEM.
prevention and / or treatment of diabetic kidney disease. A novel finding obtained from our cur-rent study underlines the importance of antioxidants for mitochondrial protection in the retarda-tion of DN. Growing evidence indicates that mitochondria play a critical role in the initiaretarda-tion and development of DN. Mitochondria are believed to be the major organelles involved in super-oxide generation. They consume approximately 85% of the oxygen used by cells and overproduc-tion of superoxide anions may occur by excessive electron leak in the mitochondrial electron transport chain during diabetes [21]. On the other hand, mitochondria are the primary targets for oxidative stress because they lack protection from histone and are incapable of performing DNA repair functions by themselves [22]. Our previous observations have shown that the num-ber of damaged mitochondrion in kidney proximal tubules was significantly higher inIns2Akita/+
mice with 50% of reducedLiasgene expression thanLias+/+Ins2Akita/+littermate controls. In the current studies, we consolidate our previous observation that mitochondrial damage in proxi-mal tubules is a predominant pathological feature of DN by demonstrating that reduction in
Liasgene expression inLiasLow/LowIns2Akita/+mice and increasedLiasexpression inLiasHigh/High -Ins2Akita/+mice impact mitochondrial integrity and function. Through use ofin vitroLIAS knock-down studies it has been reported that ROS may decrease the mitochondrial membrane potential [23]. Given that mitochondrial dysfunction is postulated to be an initiator for diabetic complica-tions [24], we presume that attenuation of DN by endogenous LA is likely, through preservation of mitochondrial function, to mediate reduction in mitochondrial ROS and mitochondrial dam-age. Thus, strengthening mitochondrial antioxidant capacity could be an effective means for pre-vention and treatment of DN. Our results are similar to a recent report indicating thatIns2Akita/+
mice specifically overexpressing catalase, a key antioxidant enzyme in renal proximal tubular cells, had reduced renal oxidative stress and attenuated progression of DN without changing blood glucose concentration [25]. Our contention, that mitochondrial damage mediates DN and that lipoic acid mitigates this injury, is further supported by another recent report thatIns2Akita/+
derivedβ-cells have increased mitochondrial dysfunction, oxidative stress, mitochondrial DNA damage, and alterations in mitochondrial protein levels that contribute toβ-cell dysfunction [26].
LIAS synthesizes lipoic acid in mitochondria. Lipoic acid has a high reductive capacity and actively participates in the recycling of vitamin C and E. Diabetes mellitus is characterized by increased oxidative stress that negatively impacts mitochondrial integrity and function. Hence the physiologic importance of LIAS in diabetes is through its role in lipoic acid synthesis; lipoic acid may play a vital role in mitochondrial protection from oxidative stress and thus maintain energy balance during diabetes. Our previous data obtained from inLias+/-Ins2Akita/+mice showed that systemic and urinary oxidative stress markers significantly increased, whereas endogenous antioxidant capacity significantly decreased, whenLiasgene expression levels was approximately 50%. Furthermore, reducedLiasgene expression inLias+/-Ins2Akita/+mice was associated with more severe DN pathological changes compared withLias+/+Ins2Akita/+mice. In particular, a large number of damaged mitochondria were detected in mouse proximal tubule epithelial cells as a unique phenomenon. The results observed inLiasLow/LowIns2Akita/+
mice have confirmed that reducedLiasgene expression leads to decreased endogenous antioxi-dant capacity and mitochondrial damage in the proximal tubules. On the other hand, in Lia-sHigh/HighIns2Akita/+mice harboring increasedLiasgene expression, endogenous oxidant capacity and mitochondrial integrity are protected. Our data also indicate that kidney proximal tubules can serve as a window via which alternation of mitochondrial status due to oxidative stress can be assessed in diabetic nephropathy.
1. Excess ROS generated in diabetic mellitus impairs the antioxidant defense system, indicated by decline of reduced GSH levels, leading to further accumulation of ROS. The latter is reflected by a significantly enhanced lipid peroxidation levels in body and urine. Our new animal model with low expression ofLiasgene further highlights this relationship between endogenous antioxidant levels, ROS concentrations and DN pathologic changes. That is, low endogenous antioxidant capacity will result in high levels of ROS and more severe DN.
2. Excessive ROS in diabetes mellitus damages mitochondria. Mitochondria are a major site of ROS generation and are vulnerable targets for ROS; hence, accumulated ROS due to insuffi-cient LA protection inLiasLow/LowIns2Akita/+mice could damage mitochondria. We found that significant mitochondrial damage inLiasLow/LowIns2Akita/+mice; other investigators have also demonstrated decreased mitochondrial membrane potential usingin vitroLASY knockdown method [23].
To investigate the mechanisms through which lipoic acid protects mitochondria in kidney proximal tubules, we examined gene expression of several common antioxidant enzymes in kidney cortex, including Sod series and glutathione peroxidase. Our data, using these novel mouse models, identify Sod2 as an antioxidant target by showing that expression ofSod2 (a major antioxidant enzyme which responds to enhanced superoxide production in mitochon-dria) markedly increases in kidney cortex ofLiasLow/LowIns2Akita/+mice; the latter observation has been previously reported in theLias+/-Ins2Akita/+diabetic mice with 50% reduced LIAS [20]. SOD2 co-exists with Lias in mitochondria and is a major antioxidant enzyme that responds to enhanced superoxide production in mitochondria; hence, the observation that SOD2 increases in kidney cortex ofLiasLow/LowIns2Akita/+mice with increased ROS is not surprising.
We attempted to identify antioxidant targets of LA in the diabetic kidney cortex. In addition to dysfunctional mitochondria, one of the most prominent sources of ROS is from the
NADPH oxidase (NOX) activity [27–29]. Amongst these, theNox4gene, a biomarker of oxida-tive stress in the diabetic mellitus, has particularly high expression in the kidney [30]. Our result showed thatNox4gene expression was significantly increased inLiasLow/LowIns2Akita/+
and decreased inLiasHigh/HighIns2Akita/+kidney cortex, respectively, suggesting that NADPH oxidase 4 is an antioxidant target of lipoic acid.
NRF2 is a key transcription factor for regulation of antioxidant defense [31]. Although it has been reported that LA stimulated NRF2 nuclear accumulation [32], our result do not detect any significant changes ofNrf2gene expression in 28-week-oldLiasLow/LowIns2Akita/+and Lia-sHigh/HighIns2Akita/+mouse kidney. Hence, the renal protective action mediated by increased LIAS-generated LA is not accompanied byNrf2transcription alternation.
Several studies have revealed increased expression of TGF-β1 in renal glomeruli in experi-mental models of diabetes [34]. TGF-β1 is a critical mediator of podocyte injury and kidney hypertrophy characteristic of DN [33]. Thus, significantly reducedTgfβ1gene expression in
Accumulating evidence support a role for inflammation in DN. In particular, the inflamma-tory cells infiltrate (like increased renal macrophage infiltration) and significantly higher levels of cytokines (chemokines) including monocyte chemoattractant protein-1 (MCP-1), accompanies DN [35]. MCP-1 is considered as a major mediator of inflammation process in DN patients [36]. It is a member of the CC chemokine family synthesized by a variety of cell types including glo-merular endothelial cells, mesangial cells, tubular epithelial cells, and monocytes [37]. Studies suggest that MCP-1 production in mesangial cells and renal tubular epithelial cells are induced by advanced glycated end products (AGEs) through NF-κB activation [38,39]. The promoters of MCP-1 gene contain binding sites for NF-kB [40]. Since urinary MCP-1 is upregulated in many renal diseases, including DN patients, we measured urinary MCP-1 levels in the three groups of mice. Our results showed that there were significantly increased urinary MCP-1 levels inLiasLow/LowIns2Akita/+mice compared withLias+/+Ins2Akita/+andLiasHigh/HighIns2Akita/+mice. This observation indicates that increased inflammation occurs inLiasLow/LowIns2Akita/+mice. The increased MCP-1 is likely mediated by NF-kB in response to enhanced kidney oxidative stress [41,42]. This result provides further evidence that increasing the endogenous antioxidant capac-ity could be an effective strategy for prevention and treatment of DN.
In a previous study, we showed that plasma glucose levels inLias+/-Ins2Akita/+mice are sig-nificantly greater than those inLias+/+Ins2Akita/+mice [20]. However, we did not detect any sig-nificant differences among the three groups of mice in the current study. We believe genetic background of the mice plays a major role in this discrepancy [43,44]. We used mice with B6 genetic background for the current project, whereas we used F1 genetic background for the previous one. Thus, it is likely that even the same level ofLiasgene expression in the different genetic background could exhibit different traits.
In summary, our data clearly indicate thatLiasHigh/HighIns2Akita/+andLiasLow/LowIns2Akita/+
mice manifest variations in levels of endogenous antioxidant capacity in kidneys that lead to different degrees of diabetic pathologic changes. The results have clarified the role of antioxi-dants in the early development of diabetic nephropathy and strongly suggest that protection of mitochondria is a novel therapeutic target for effective antioxidant therapy of DN.
We conclude that these new antioxidant mouse models are suitable to elucidate the contri-butions of oxidative stress in the pathogenesis of diabetic kidney disease.
Acknowledgments
We thank Drs. Edward Leiter and Racheal Wallace of the Jackson Laboratory for assisting with mouse model development. The authors thank Dr. Edward H. Leiter for critical review. =
Author Contributions
Conceptualization: XY.
Data curation: XY.
Formal analysis: XY LRJ VN NM.
Funding acquisition: XY LRJ.
Investigation: XY.
Methodology: XY LX SH SS.
Project administration: XY.
Validation: XY LRJ VN.
Visualization: XY.
Writing – original draft: XY.
Writing – review & editing: XY LRJ VN LX SH.
References
1. Packer L, Witt EH, Tritschler HJ. alpha-Lipoic acid as a biological antioxidant. Free Radic Biol Med. 1995 Aug; 19(2):227–50. doi:10.1016/0891-5849(95)00017-rPMID:7649494
2. Biewenga G, Haenen GR, Bast A. The role of lipoic acid in the treatment of diabetic polyneuropathy. Drug Metab Rev. 1997 Nov; 29(4):1025–54. doi:10.3109/03602539709002242PMID:9421684
3. Shay KP, Hagen TM. Age-associated impairment of Akt phosphorylation in primary rat hepatocytes is remediated by alpha-lipoic acid through PI3 kinase, PTEN, and PP2A. Biogerontology. 2009 Aug; 10 (4):443–56. doi:10.1007/s10522-008-9187-xPMID:18931933
4. Reed LJ. From lipoic acid to multi-enzyme complexes. Protein Sci. 1998 Jan; 7(1):220–4. doi:10. 1002/pro.5560070125PMID:9514279
5. Yi X, Maeda N. Endogenous production of lipoic acid is essential for mouse development. Mol Cell Biol. 2005 Sep; 25(18):8387–92. doi:10.1128/MCB.25.18.8387-8392.2005PMID:16135825
6. Raptis AE, Viberti G. Pathogenesis of diabetic nephropathy. Exp Clin Endocrinol Diabetes. 2001; 109 Suppl 2:S424–37. doi:10.1055/s-2001-18600PMID:11460589
7. Baynes JW. Role of oxidative stress in development of complications in diabetes. Diabetes. 1991 Apr; 40(4):405–12. doi:10.2337/diab.40.4.405PMID:2010041
8. Ha H, Hwang IA, Park JH, Lee HB. Role of reactive oxygen species in the pathogenesis of diabetic nephropathy. Diabetes Res Clin Pract. 2008 Nov 13; 82 Suppl 1:S42–5. doi:10.1016/j.diabres.2008. 09.017PMID:18845352
9. Darko D, Dornhorst A, Kelly FJ, Ritter JM, Chowienczyk PJ. Lack of effect of oral vitamin C on blood pressure, oxidative stress and endothelial function in Type II diabetes. Clin Sci (Lond). 2002 Oct; 103 (4):339–44. doi:10.1042/cs1030339PMID:12241530
10. Lonn E, Yusuf S, Hoogwerf B, Pogue J, Yi Q, Zinman B, et al. Effects of vitamin E on cardiovascular and microvascular outcomes in high-risk patients with diabetes: results of the HOPE study and MICRO-HOPE substudy. Diabetes Care. 2002 Nov; 25(11):1919–27. doi:10.2337/diacare.25.11. 1919PMID:12401733
11. Blum S, Vardi M, Levy NS, Miller-Lotan R, Levy AP. The effect of vitamin E supplementation on cardio-vascular risk in diabetic individuals with different haptoglobin phenotypes. Atherosclerosis. 2010 Jul; 211(1):25–7. doi:10.1016/j.atherosclerosis.2010.02.018PMID:20223458
12. Gaede P, Poulsen HE, Parving HH, Pedersen O. Double-blind, randomized study of the effect of com-bined treatment with vitamin C and E on albuminuria in Type 2 diabetic patients. Diabet Med. 2001 Sep; 18(9):756–60. doi:10.1046/j.0742-3071.2001.00574.xPMID:11606175
13. Doherty HE, Kim HS, Hiller S, Sulik KK, Maeda N. A mouse strain where basal connective tissue growth factor gene expression can be switched from low to high. PLOS ONE. 2010 Sep; 5(9):1–14. doi:10.1371/journal.pone.0012909PMID:20877562
14. Brosius FC 3rd, Alpers CE, Bottinger EP, Breyer MD, Coffman TM, Gurley SB, et al. Mouse models of diabetic nephropathy. J Am Soc Nephrol. 2009 Dec; 20(12):2503–12. doi:10.1681/ASN.2009070721
PMID:19729434
15. Breyer MD, Bottinger E, Brosius FC 3rd, Coffman TM, Harris RC, Heilig CW, et al. Mouse models of diabetic nephropathy. J Am Soc Nephrol. 2005 Jan; 16(1):27–45. doi:10.1681/ASN.2004080648
PMID:15563560
16. Yoshioka M, Kayo T, Ikeda T, Koizumi A. A novel locus, Mody4, distal to D7Mit189 on chromosome 7 determines early-onset NIDDM in nonobese C57BL/6 (Akita) mutant mice. Diabetes. 1997 May; 46 (5):887–94. doi:10.2337/diab.46.5.887PMID:9133560
17. Valero E, Garcia-Carmona F. Optimizing enzymatic cycling assays: spectrophotometric determination of low levels of pyruvate and L-lactate. Anal Biochem. 1996 Jul 15; 239(1):47–52. doi:10.1006/abio. 1996.0289PMID:8660624
19. Carlson DA, Smith AR, Fischer SJ, Young KL, Packer L. The plasma pharmacokinetics of R-(+)-lipoic acid administered as sodium R-(+)-lipoate to healthy human subjects. Altern Med Rev. 2007 Dec; 12 (4):343–51. PMID:18069903
20. Yi X, Xu L, Hiller S, Kim HS, Nickeleit V, James LR, et al. Reduced expression of lipoic acid synthase accelerates diabetic nephropathy. J Am Soc Nephrol. 2012 Jan; 23(1):103–11. doi:10.1681/ASN. 2011010003PMID:22021711
21. Forbes JM, Coughlan MT, Cooper ME. Oxidative stress as a major culprit in kidney disease in diabe-tes. Diabetes 2008 57: 1446–1454. doi:10.2337/db08-0057PMID:18511445
22. Shigenaga MK, Hagen TM, Ames BN. Oxidative damage and mitochondrial decay in aging. Proc Natl Acad Sci U S A. 1994 Nov 8; 91(23):10771–8. doi:10.1073/pnas.91.23.10771PMID:7971961
23. Padmalayam I, Hasham S, Saxena U, Pillarisetti S. Lipoic acid synthase (LASY): a novel role in inflam-mation, mitochondrial function, and insulin resistance. 2009 Mar; 58(3):600–8. doi: 10.2337/db08-0473PMID:19074983
24. Brownlee M. The pathobiology of diabetic complications: a unifying mechanism. Diabetes. 2005 Jun; 54(6):1615–25. doi:10.2337/diabetes.54.6.1615PMID:15919781
25. hi Y, Lo CS, Chenier I, Maachi H, Filep JG, Ingelfinger JR, et al. Overexpression of catalase prevents hypertension and tubulointerstitial fibrosis and normalization of renal angiotensin-converting enzyme-2 expression in Akita mice. Am J Physiol Renal Physiol. 2013 Jun 1; 304(11):F1335–46. doi:10.1152/ ajprenal.00405.2012PMID:23552863
26. Mitchell T, Johnson MS, Ouyang X, Chacko BK, Mitra K, Lei X, et al. Dysfunctional mitochondrial bio-energetics and oxidative stress in Akita(+/Ins2)-derived beta-cells. Am J Physiol Endocrinol Metab. 2013 Sep 1; 305(5):E585–99. doi:10.1152/ajpendo.00093.2013PMID:23820623
27. Bedard K, Krause KH. The NOX family of ROS-generating NADPH oxidases: physiology and patho-physiology. Physiol Rev. 2007 Jan; 87(1):245–313. doi:10.1152/physrev.00044.2005PMID:
17237347
28. Gill PS, Wilcox CS. NADPH oxidases in the kidney. Antioxid Redox Signal. 2006 Sep-Oct; 8(9– 10):1597–607. doi:10.1089/ars.2006.8.1597PMID:16987014
29. Asaba K, Tojo A, Onozato ML, Goto A, Quinn MT, Fujita T, et al. Effects of NADPH oxidase inhibitor in diabetic nephropathy. Kidney Int. 2005 May; 67(5):1890–8. doi:10.1111/j.1523-1755.2005.00287.x
PMID:15840036
30. Gorin Y, Block K, Hernandez J, Bhandari B, Wagner B, Barnes JL, et al. Nox4 NAD(P)H oxidase medi-ates hypertrophy and fibronectin expression in the diabetic kidney. J Biol Chem. 2005 Nov 25; 280 (47):39616–26. doi:10.1074/jbc.M502412200PMID:16135519
31. Pickering AM, Linder RA, Zhang H, Forman HJ, Davies KJ. Nrf2-dependent induction of proteasome and Pa28alphabeta regulator are required for adaptation to oxidative stress. J Biol Chem. 2012 Mar 23; 287(13):10021–31. doi:10.1074/jbc.M111.277145PMID:22308036
32. Shay KP, Moreau RF, Smith EJ, Smith AR, Hagen TM. Alpha-lipoic acid as a dietary supplement: molecular mechanisms and therapeutic potential. Biochim Biophys Acta. 2009 Oct; 1790(10):1149– 60. doi:10.1016/j.bbagen.2009.07.026PMID:19664690
33. Herman-Edelstein M, Thomas MC, Thallas-Bonke V, Saleem M, Cooper ME, Kantharidis P. Dediffer-entiation of immortalized human podocytes in response to transforming growth factor-beta: a model for diabetic podocytopathy. Diabetes. 2011 Jun; 60(6):1779–88. doi:10.2337/db10-1110PMID:
21521871
34. Park IS, Kiyomoto H, Abboud SL, Abboud HE. Expression of transforming growth factor-beta and type IV collagen in early streptozotocin-induced diabetes. Diabetes. 1997 Mar; 46(3):473–80. doi:10.2337/ diabetes.46.3.473PMID:9032105
35. Sancar-Bas S, Gezginci-Oktayoglu S, Bolkent S. Exendin-4 attenuates renal tubular injury by decreas-ing oxidative stress and inflammation in streptozotocin-induced diabetic mice. Growth Factors. 2015 Oct; 33(5–6):419–29. doi:10.3109/08977194.2015.1125349PMID:26728502
36. Navarro-Gonza´lez JF, Mora-Ferna´ndez C, de Fuentes MM, Garcı´a-Pe´rez J. Inflammatory molecules and pathways in the pathogenesis of diabetic nephropathy. Nat Rev Neprol. 2011 Jun; 7:327–40. doi:
10.1038/nrneph.2011.51PMID:21537349
37. Rovin BH, Yoshimura T, Tan L. Cytokine-induced production of monocyte chemoattractant protein-1 by cultured human mesangial cells. J Immunol 1992 Apr; 148:2148–2153. PMID:1532001
39. Morri T, Fujita H, Narita T, Shimotomai T, Fujishima H, Yoshioka N, et al. Association of monocyte che-moattractant protein-1 with renal tubular damage in diabetic nephropathy. J Diabetes Complicate. 2003 Jan; 17:11–15. doi:10.1016/s1056-8727(02)00176-9
40. Zhang Z, Yuan W, Sun L, Szeto FL, Wong KE, Li X, Kong J, Li YC. 1,25-Dihydroxyvitamin D3 targeting of NF-kappaB suppresses high glucose-induced MCP-1 expression in mesangial cells. Kidney Int. 2007 Jul; 72:193–201. doi:10.1038/sj.ki.5002296PMID:17507908
41. Kowluru RA, Koppolu P, Chakrabarti S, Chen S. Diabetes-induced activation of nuclear transcriptional factor in the retina, and its inhibition by antioxidants. Free Radic Res. 2003 Nov; 37:1169–1180. doi:
10.1080/10715760310001604189PMID:14703729
42. Cooper ME. Pathogenesis, prevention and treatment of diabetic nephropathy. Lancet. 1998 July; 352:213–219. doi:10.1016/S0140-6736(98)01346-4PMID:9683226
43. Gurley SB, Mach CL, Stegbauer J, Yang J, Snow KP, Hu A, et al. Influence of genetic background on albuminuria and kidney injury in Ins2(+/C96Y) (Akita) mice. Am J Physiol Renal Physiol. 2010 Mar; 298(3):F788–95. doi:10.1152/ajprenal.90515.2008PMID:20042456