Assessing microbial drinking water quality and human-specific contaminants on San Cristobal Island, Galapagos
William Austin Gerhard
A technical report submitted to the faculty at the University of North Carolina at Chapel Hill in partial fulfillment of the requirements for the degree of Master of Science in Public Health in the
Department of Environmental Sciences and Engineering in the Gillings School of Global Public Health.
Chapel Hill 2015
Approved by: Jill Stewart
©2015
ABSTRACT
William Austin Gerhard: Assessing microbial drinking water quality and human-specific contaminants on San Cristobal Island, Galapagos
(Under the direction of Prof. Jill R. Stewart)
Inconsistent drinking water quantity and quality on the Galapagos archipelago has
persisted for decades; however, measurements to elucidate the magnitude and causes of
impairment have been limited. We established a baseline for point-of-use drinking water quality
and examined the effect of a new drinking water treatment plant (DWTP) on San Cristobal
Island, Galapagos. Samples were collected at the freshwater source, immediately post-treatment,
and at 50 sites throughout the distribution system. Samples were analyzed for indicator bacteria
(total coliforms and Escherichia coli), pH, temperature, conductivity, and dissolved oxygen. During the final collection period, human-specific Bacteroides assays were included in the analysis. To our knowledge, this study is the first to apply these microbial source tracking
techniques to assess point-of-use drinking water quality. Point-of-use E. coli contamination was significantly lower after installation of the DWTP (p<0.0001) and post-treatment E. coli
concentration at the DWTP was not-detectable; however, 28% of points-of-use sampled (n=50)
had detectable levels of E. coli contamination during at least one collection period after the completion of the DWTP. Interestingly, one of the sites sampled was found to have detectable
markers of human-specific fecal contamination, which further indicates shortcomings with the
integrity of drinking water distribution or handling. The results of this study suggest the DWTP
has reduced microbial contamination at the points-of-use; however, faults in the distribution
process have allowed the introduction of the fecal indicator organism E. coli to the drinking water supply. This study illustrates the necessity of considering both treatment and distribution
ACKNOWLEDGMENTS
I would like to express my appreciation of the extensive guidance provided by my
supervisor, Dr. Jill Stewart, throughout my undergraduate and graduate careers at the University
of North Carolina at Chapel Hill. This thesis never would have happened without her willingness
to mentor me as I began to realize my interest in public health while studying abroad in the
Galapagos. I would also like to thank the other members of my committee, Dr. Orlando Coronell
and Dr. Jamie Bartram, for providing their perspectives on the intersection of water quality and
public health as they reviewed this work.
I would like to thank the staff of the Galapagos Science Center and its co-directors, Dr.
Stephen Walsh and Dr. Carlos Mena, for providing access to facilities and technical assistance
during my time in the Galapagos. The advice of Denene Blackwood and Dr. Rachel Noble of the
UNC Institute for Marine Science proved invaluable as I explored the qPCR methods used in this
thesis. I would like to thank Shannon Steel for providing all of the geospatial data found herein,
Katie Overbey for her contributions to the water quality data of freshwater sources, and Wan Suk
Choi for performing a statistical analysis of the microbial drinking water quality data.
This project would not have been possible without the support of several university
organizations. The summer of 2013 was made possible by the Center for Global Initiatives
(Vimy Global Team Award). The summer of 2014 was made possible by the Carolina Center for
Public Service (Hyatt Rotary Public Service Award; Sherpa Fellowship) and the Jon Curtis
Student Enrichment Fund (The Jon Curtis Student Enrichment Fund Summer Scholar).
Finally, I would like to thank my family and friends for supporting me throughout this
process. Last but not least, thank you to Alexa Waters for helping me maintain focus on my short
TABLE OF CONTENTS
LIST OF TABLES vii
LIST OF FIGURES viii
LIST OF ABBREVIATIONS ix
THESIS
Introduction 1
Objectives 2
Literature Review 3
Drinking Water Regulations and Monitoring 4
Molecular Methods 7
Water Quality in the Galapagos Islands 11
Materials and Methods 14
Site Selection 14
Sample Collection 15
Total Coliform and E. coli Enumeration 16
Physical and Chemical Parameters 16
DNA Extraction 17
Conventional PCR 17
Quantitative Real-Time PCR 18
Primers and Probes 19
HF183 Prevalence 20
DNA Sequencing 20
Spatial Analysis 22
Results 24
Discussion 31
Conclusion 36
REFERENCES 38
APPENDICES 42
Appendix A -- Microbial drinking water quality data measured as
MPN / 100 mL. San Cristobal, Galapagos (2013-2014). 42
Appendix B – HF183 assay results for points-of-use, source water, and
DWTP. San Cristobal, Galapagos (2014). 43
Appendix C – Physical and chemical drinking water quality data.
LIST OF TABLES
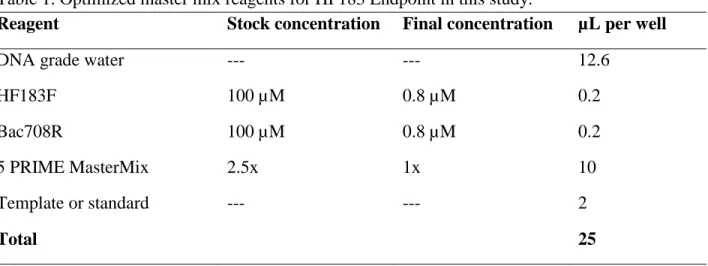
Table 1 – Optimized master mix reagents for HF183 Endpoint in this study 18
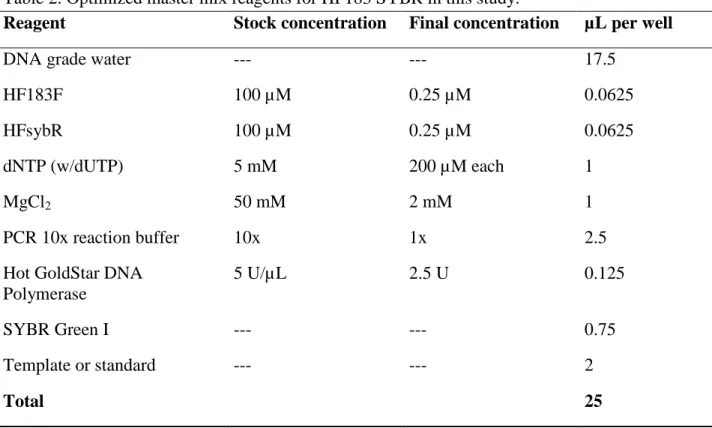
Table 2 – Optimized master mix reagents for HF183 SYBR in this study 19
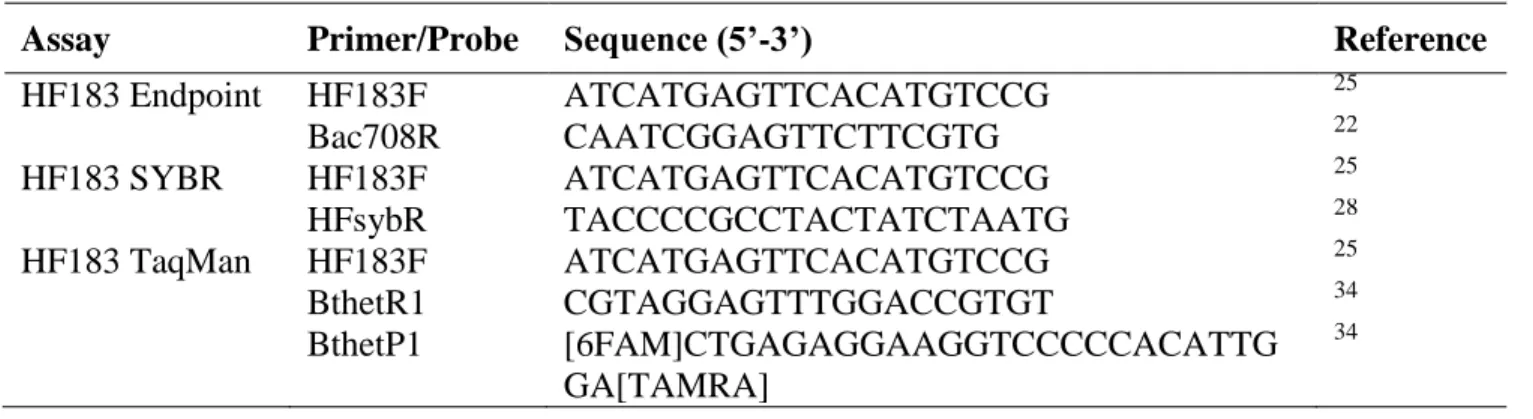
Table 3 – Primers and probes used in this study 20
Table 4 – Health risks of microbial contamination before and after intervention
for all tested sample sites on San Cristobal Island, Galapagos (2013-2014) 27
LIST OF FIGURES
Figure 1 – Inhabited zones of San Cristobal Island 14
Figure 2 – Neighborhoods of Puerto Baquerizo Moreno, San Cristobal Island,
Galapagos 23
Figure 3 – Box plots of Log10 transformed total coliform concentration levels
aggregated by neighborhood. San Cristobal Island, Galápagos (2013-2014) 25
Figure 4 – Box plots of Log10 transformed E. coli concentration levels
aggregated by neighborhood. San Cristobal Island, Galápagos (2013-2014) 25
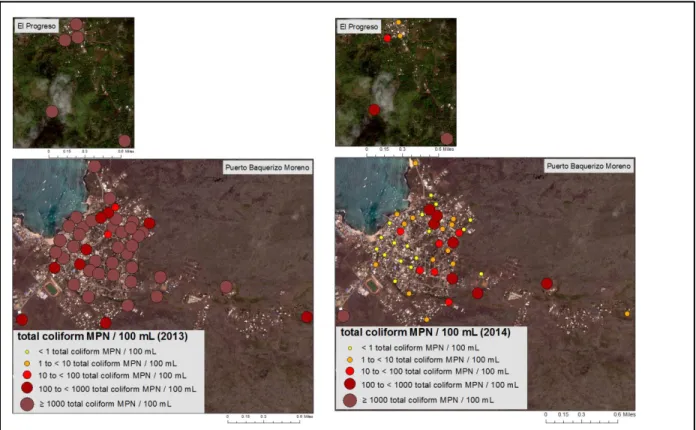
Figure 5 – Spatial representation of total coliform MPN / 100 mL (2013-2014) 26
LIST OF ABBREVIATIONS
BLAST Basic Local Alignment Search Tool
DNQ Detected, not quantified
DWTP Drinking water treatment plant
GNP Galapagos National Park
LLOD Lower limit of detection
MPN Most probable number
MST Microbial source tracking
NCBI National Center for Biotechnical Information
PCR Polymerase chain reaction
qPCR Quantitative real-time polymerase chain reaction
SESA Ecuadorian Service for Agricultural Health
SICGAL Galapagos Quarantine and Inspection System
UNC-CH University of North Carolina at Chapel Hill
UNEP United Nations Environmental Program
UNESCO United Nations Educational, Scientific, and Cultural Organization
USEPA United States Environmental Protection Agency
WaSH Water sanitation and hygiene
WHO World Health Organization
WWTP Waste water treatment plant
INTRODUCTION
The Galapagos Islands of Ecuador are considered a haven for dozens of species found
nowhere else on the planet. Ecotourism to the islands has grown exponentially from 2,000
tourists in the year 1960 to 120,000 tourists in 2005.1 The popularity of ecotourism creates a
framework called the Galapagos Paradox where increasing strain is placed on the “pristine”
environment that many tourists hope to enjoy.2 There have been various attempts to determine
the tourism carrying capacity for the archipelago, but these estimates of carrying capacity have
been repeatedly exceeded by the growth of tourism and the island population.2 Among other
stressors, the strain that this increase in tourism places on the water infrastructure has caused
drinking water quality problems that have persisted for decades.3
Of the five inhabited islands on the archipelago, two have airports that receive incoming
tourist traffic: San Cristobal and Baltra. San Cristobal Island, with a population between 7000
and 8000 people, is the only island to depend primarily on surface freshwater.3 Previously
published research reporting water quality parameters in the Galapagos focused primarily on
Santa Cruz, the island with the highest resident population of about 12000 people. Research
performed on the island of San Cristobal is sparse and incorporated fewer than five sample
sites.3,4 This scale of existing research does not allow researchers to understand the general state
of drinking water quality on the island.
Poor infrastructure design is a concern for water safety throughout the archipelago.3 A
project to replace the drinking water treatment and distribution system on San Cristobal is
underway. Construction of a new drinking water treatment plant (DWTP) began in late 2012, and
the DWTP began operations in September 2013. The infrastructure improvement project is
OBJECTIVES
This study establishes baseline measurements of physical, chemical, and microbiological
parameters of drinking water quality at various points of the distribution system on the island of
San Cristobal over a two year period and provides the most comprehensive spatial representation
of microbial drinking water quality on any island in the Galapagos archipelago to date.
Furthermore, this study examines the effect of a newly constructed drinking water treatment
plant on microbial water quality, both in terms of comparisons between years and in terms of
compliance with established World Health Organization (WHO) Guidelines.
This study also evaluates the sources of observed fecal contamination through microbial
source tracking (MST) methods. Because of spatially widespread microbial contamination
observed during the first year of the study, human-specific assays were used to narrow the list of
possible sources for this microbial contamination. By applying molecular techniques to the
Galapagos Islands, this research improves the ability of local agencies to identify and mitigate
microbial contamination. To our knowledge, this study is the first to apply MST methods to
examine drinking water quality at the point-of-use.
The findings of this study will inform policy and engineering decisions regarding
drinking water treatment and distribution on San Cristobal. The parameters examined herein
provide context to public health data on the island and will allow researchers to determine the
impact of improved drinking water quality on both the resident and transient populations.
Furthermore, the application of human-specific MST assays in the Galapagos will allow
researchers to further examine human-specific fecal contamination of drinking and recreational
LITERATURE REVIEW
Water, sanitation, and hygiene (WaSH) has been estimated to contribute to 4.0% of all
deaths and 5.7% of the total disease burden globally.5 Diarrheal diseases were the
seventh-leading cause of death in low-and-middle-income countries with 1.8 million associated deaths in
2001.6 When measured as years of life lost due to premature mortality (YLL), diarrheal diseases
were the sixth-leading cause of premature death. This places diarrheal diseases above
tuberculosis, malaria, and traffic accidents as a cause of premature death.6
The high disease burden associated with poor WaSH can be largely prevented through
the implementation of various techniques already in use. Some countries, such as those in
sub-Saharan Africa, are affected by poor WaSH because they do not have the resources required for
implementation. Other rapidly developing countries regions may have the resources but lack the
ability to quickly implement WaSH techniques. This area of international development has been
increasingly investigated by the United Nations and the World Health Organization (WHO).
Studies have found that every US$1 investment in WaSH implementation in developing regions
returns US$5 to US$46 in economic benefits.7
There are multiple interventions to interrupt the fecal-oral route of disease transmission
that is generally related to diarrheal diseases and associated with poor WaSH. These include
improvements to drinking water quantity and quality, hygiene and sanitation practices, and waste
water treatment. While these all play an integral part in improving the overall quality of water,
this literature review will examine drinking water quality at the points-of-use in a developing
world setting. This literature review will: (1) Examine drinking water regulations and methods
typically used to monitor the microbial quality of drinking water; (2) Explore PCR methods for
characterizing microbial drinking water quality in the Galapagos, a location facing water
challenges typical of many developing countries.
Drinking Water Regulations and Monitoring
In the United States of America, drinking water regulations are set forth by the United
States Environmental Protection Agency (USEPA). These include primary and secondary
drinking water regulations. Primary drinking water regulations cover contaminants that have
associated health risks and include legally enforceable standards. Secondary drinking water
regulations include non-enforceable guidelines that can be adopted as requirements at the
state-level.8 Contaminants regulated in the primary drinking water regulations can contribute to
chronic and acute illnesses. Contaminants leading to acute illnesses are most often monitored in
developing regions because of resource limitations.9 Acute illnesses are primarily caused by
biological contaminants. For this reason, developing regions often prioritize biological
monitoring of drinking water quality.9 Biological water quality monitoring is accomplished by
using indicator organisms such as total coliforms or fecal indicator organisms such as
Escherichia coli.
Fecal indicator organisms are typically used to determine microbial quality of the
samples.10 The ideal indicator organism for fecal contamination would have the following
characteristics: (1) Applicable to all types of water; (2) Present in feces, sewage, and fecal
contaminated samples in relative concentration to pathogens; (3) No growth in the environment;
(4) Survive longer than or equivalent to pathogens; (5) Easily detected and quantified; (6)
of illness.11,12 An ideal indicator organism would serve as a surrogate for determining pathogen
concentration in a sample.
Among other traits, E. coli does not multiply at the water temperatures and nutrient concentrations observed in most drinking water distribution systems.10 As a result, detectable E. coli concentration within a system is considered sufficient evidence of recent fecal
contamination. The international guidelines developed by the WHO recommend E. coli as the primary fecal indicator bacteria.13 Academics have argued that there is a tendency to
overestimate the efficacy of indicator organisms as models of pathogen concentration.14 A wide
range of indicator organisms with variable characteristics – such as temperature resistance and
disinfection resistance – is useful when developing a monitoring plan in order to reduce the
possibility of miscalculating pathogen levels and water safety.10 Although there is often a
correlation in microbial concentration, it is important to note that an absence of indicator
organisms does not necessarily mean there is an absence of pathogens.
Although an effective monitoring plan would include various indicator organisms,
resource limitations can restrict the ability of agencies to perform comprehensive analyses in the
developing world. In these cases, E. coli is currently the preferred fecal indicator organism.10 This is primarily because E. coli has been extensively examined in the literature and a number of quantification methods with varying advantages exist.
There are many accepted methods of quantification for E. coli, which range widely in their demand on resources and technical knowledge. These quantification methods fall into two
general categories: methods based on direct counts of bacteria and methods based on culture
techniques. Count-based methods use microscopy, Coulter counters, or flow cytometry to
dead, and stressed cells and are rarely, if ever, used in the field of water analysis.15 Culture-based
methods such as plate count, membrane filtration, multiple-tube fermentation, or IDEXX
Colilert® can indirectly count the number of cells in a sample. The former example – plate count
– relies on the assumption that each viable cell will yield a colony, which can be visibly counted
on a specialized agar media; however, these counts can underestimate the true value by omitting
stressed cells.15 The latter two examples – multiple-tube fermentation and Colilert – rely on
multiple dilutions of a sample measured as either positive or negative to determine an estimate
for viable count known as the most-probable number (MPN). Use of a MPN can produce an
imprecise estimate, so the most appropriate use may be to determine microbial quantity in the
order of magnitude.16
The WHO has outlined expected health risks associated with various levels of E. coli
contamination in drinking water. Although the health risk as defined by the WHO is a two-part
consideration of E. coli concentration and sanitary inspection risk score, certain associated health priority levels are dominant at each E. coli concentration level. These correct prioritizations of response are as follows: (1) Low risk which requires no action at <1 E. coli MPN / 100 mL; (2) Intermediate risk which requires low action priority at 1-10 E. coli MPN / 100 mL; (3) High risk which requires higher action priority at 11-100 E. coli MPN / 100 mL; and (4) Very high risk which requires urgent action at >100 E. coli MPN / 100 mL.10 The relative risk from E. coli
contamination increases with each 10-fold increase in bacterial concentration. For this reason,
the MPN methods described above can be effectively used to determine E. coli concentrations and their corresponding risk to public health.
organisms is only possible in environments with high enough levels of nutrients and correct
temperatures, but it has been reported in stressful environments such as in the presence of
elevated mineral content similar to seawater.17 While E. coli is still supported by the USEPA as the primary fecal indicator bacteria in drinking water samples, E. coli is capable of multiplying and establishing significant environmental sources in regions like Hawaii, Puerto Rico, and
South Florida.18 Researchers working in tropical environments have begun to explore the use of
other bacteria as fecal indicator organisms.19 The application of emerging methods such as
polymerase chain reaction (PCR) and quantitative real-time PCR (qPCR) improve the speed and
accuracy of microbial contaminant detection.
Molecular Methods
Alternative methods for determining microbial quality of water have been explored over
the past few decades. Polymerase chain reaction (PCR) was used to determine total coliform and
E. coli concentrations in water samples as early as 199, enabling the number of total coliform and E. coli in a water sample to be determined as accurately with only six hours of processing compared to the 24 hours required by culture-based methods.20 Subsequent research explored
species-specific assays to determine the source of fecal contamination now referred to as
microbial source tracking (MST).
There are two measures by which MST assays are typically judged: sensitivity and
specificity. There is often a trade-off between these as assays that are more sensitive are more
likely to register a false positive, thereby decreasing their specificity. Alternatively, assays that
are less sensitive are more likely to register as a false negative, thereby increasing their
sensitivity came to be favored over specificity; however, researchers tend to aim for an assay
with at least 80% specificity and 80% sensitivity.21
One of the first studies that attempted to determine the host source of fecal
contamination observed in water samples was published by Bernhard and Field in 2000.22 They
created primers used to replicate the 16S ribosomal DNA (rDNA) of fecal anaerobes Bacteroides
and Prevotella (Bac32F-Bac708R) as well as Bifidobacterium (Bif164F-Bif601R).22
Bacteroides-Prevotella DNAs were detected in all samples tested while Bifidobacterium DNA was only detected in 25% of the samples, which led to the conclusion that the Bacteroides-Prevotella group showed more potential as an indicator of choice.22 This conclusion was strengthened by previous findings that Bacteroides populations showed less fluctuation in humans than Bifidobacterium populations and that Bacteroides cells could be isolated from environmental samples for at least several days after introduction to the stresses of an aquatic
environment.23,24The product of PCR was then digested using the restriction enzyme HaeIII to
yield human-specific and cow-specific fragments of 119 base pairs and 222 base pairs,
respectively.22
In order to improve assay sensitivity, Bernhard and Field developed a new set of forward
primers to pair with the Bacteroides-Prevotella reverse primer (Bac708R).25 The combination of HF183F and Bac708R was determined to be the most sensitive and specific primer pairing for
identifying Bacteroides fecal contamination from a human source.25 This assay is subsequently identified in the literature as HF183 Endpoint. Because HF183 Endpoint relies on conventional
PCR techniques and gel-based methods, it can only determine presence/absence of human fecal
HF183 Endpoint remains one of the most sensitive and specific assays for identifying human
fecal contamination.21,26
A new technique called quantitative real-time PCR (qPCR) saw an increasing influence
during the first decade of the 21st century. Although the method was first discussed in 1993 by
Higuchi et al., technology to make the method viable on a large scale did not yet exist.27 The
method was designed to measure the amount of a fluorescent signal between each PCR cycle of
denaturation, annealing, and extension. The measurement of fluorescence reaches a threshold
value after a certain number of cycles and calculations are performed allowing the initial starting
quantity of DNA/RNA to be calculated. These fluorescent compounds may intercalate the
double-stranded DNA (SYBR Green I) or they may attach to the sequence of interest in the form
of primers before being activated.
As technology began to catch up with theory in the 2000s, multiple qPCR assays were
developed for the detection of human-specific fecal contamination. The first of these assays was
developed by Seurinck et al. in 2005.28 This assay (HF183 SYBR) was named for the dye SYBR
Green I. This assay allowed researchers to go beyond the simple presence/absence
characterization of human-associated fecal pollution and determine the amount of Bacteroides in a given sample.
Shorter amplicon length than conventional PCR is required to perform successful qPCR,
so the HF183 SYBR assay developed a new reverse primer (HFsybR) that shortened the length
of the amplicon from over 500 base pairs (HF183 Endpoint) to 82 base pairs.28 The HF183
SYBR assay was an order of magnitude more sensitive than the HF183 Enpoint assay and was
able to amplify samples that were previously determined negative by HF183 Endpoint.28 There
differences between the two assays. Although the studies had the same forward primer
(HF183F), the new reverse primer developed for qPCR shortened the amplicon length and
improved the ability of the assay to replicate the entire amplicon during each cycle. Furthermore,
the HF183 SYBR assay included 40 PCR cycles instead of only 35 PCR cycles included in the
HF183 Endpoint assay. Finally, advances in technology between the publications of these two
studies, especially advances involving DNA polymerase enzymes involved in replication,
allowed for more sensitive results.
In an inter-laboratory study by Layton et al., HF183 SYBR was found to be more
sensitive than HF183 Endpoint; however, HF183 Endpoint was more specific.26 A study by
Boehm et al. found that HF183 SYBR exhibits some cross-reactivity with other species of
animals, including deer.21 Although this study reported some cross-reactivity of the assay, it still
showed high enough specificity to be categorized as human-specific.21 Layton et al. examined
the sensitivity and specificity characteristics of HF183 SYBR in two scenarios, one in which
detectable but non-quantifiable (DNQ) was counted as a positive result (DNQ+) and another in
which DNQ was counted as a negative result (DNQ-). They found 100% sensitivity and 78%
specificity with DNQ+ and 92% sensitivity and 89% specificity with DNQ-.26 Therefore, the
DNQ- approach was in line with the recommendations of Boehm and colleagues.21
A third HF183-based assay was developed by Haugland et al. in 2010.29 This qPCR assay
(HF183 TaqMan) used TaqMan chemistry and a new reverse primer and probe to examine
samples for human-specific contamination. Although the assay still relied on the HF183F primer,
a new reverse primer (BthetR1) was used. The assay also required the use of a marking probe
HF183 TaqMan has proven to be the most sensitive and specific qPCR assay for
human-specific applications.26 As with the HF183 SYBR assay, the HF183 TaqMan assay was tested
under DNQ+ and DNQ- conditions. Under DNQ+ conditions, HF183 SYBR and HF183
TaqMan both had 100% sensitivity; however, HF183 SYBR had a higher specificity (78%) than
HF183 TaqMan (46%).26 These values are both below the 80% threshold previously discussed in
this paper. Interestingly, HF183 TaqMan outperformed HF183 SYBR under DNQ- conditions in
both sensitivity (95% to 92%) and specificity (92% to 89%).26 The same study concluded that
HF183 TaqMan is a consistently excellent assay; however, it added the caveat that other assays
should be run in parallel to compare the results of each.26
Water Quality in the Galapagos Islands
The Galapagos Islands of Ecuador are an interesting site to study conventional and
emerging methods of microbial contamination for multiple reasons, including: (1) The
geographical location of the archipelago; (2) The importance and fragility of the natural
ecosystem of the islands; and (3) The exponentially growing stress placed on existing
infrastructure systems by rapidly growing residential and transient populations that threaten the
island ecosystem.
The remoteness of the archipelago prevented many of the species with cross-reactivity to
human-specific MST assays from naturally inhabiting the islands. Further introduction of foreign
species to the islands by humans has been prevented by the Galapagos Quarantine and Inspection
System (SICGAL), which was made possible by coordination between the United Nations
Environmental Program (UNEP), the Galapagos National Park (GNP), and the Ecuadorian
strictly controlled by the GNP through various programs. These species with the highest
cross-reactivity with HF183 assays were never introduced to the archipelago.21
Furthermore, the archipelago is located on the tropics and may be susceptible to E. coli
multiplication in the environment as was previously mentioned because of favorable nutrient and
temperature ranges.17–19 The use of human-specific HF183 assays have been found to be more
reliable in detecting sewage contamination than conventional E. coli methods in tropical environments.19 The inclusion of both methods allows researchers to test water using E. coli as described in the USEPA Guidelines as well as mitigate the likely limitations of E. coli in this environment by using HF183 assays.19
In 1978, the Galapagos was designated a United Nations Educational, Scientific, and
Cultural Organization (UNESCO) World Heritage Site.31 This designation formally recognized
the uniqueness of the ecosystem and species on the archipelago, including Darwin’s finches,
marine iguanas, and Galapagos tortoises. Known as the birthplace of evolution, the Galapagos
was largely undisturbed by humans for millennia. As the number of pristine environments on
Earth continues to decline, the maintenance of those that remain has increasing importance.
The Galapagos saw exponentially increasing tourism traffic in every decade after the
1970s.1 Much of the tourism to the islands was by boat before 1980, and the growth of foreign
tourism markedly increased as access to the islands via airplane became possible.1 The
residential population of the Galapagos saw a massive inflow of immigrants from the mainland
of Ecuador as the economy of the mainland collapsed with falling prices of Ecuador’s primary
export (oil).1
In the field of ecology, humans are often seen as destructive agents that negatively impact
international agencies, human presence continues to adversely affect the “pristine” nature of the
islands as the residential and tourist populations grow .2 Drinking and recreational water
contamination are tied to failures of treatment and distribution systems that were designed to
serve a much smaller population.1 The ecotourism industry on Galapagos contributed $186
million to the Ecuadorian economy in 2006 and this number continues to grow, thereby creating
a dilemma for legislators.1 The risk of overexploiting this ecosystem to the point of collapse is
increased by the large amount of money at stake.
The Galapagos Islands, like many other natural wonders of the world, are at risk of
human destruction. In order to reduce the per capita impact of humans on the fragile Galapagos
ecosystem, it is imperative to explore the application of relevant tools such as MST to efficiently
MATERIALS AND METHODS
2.1 Site Selection
The study area of San Cristobal Island includes the two main population centers: El
Progreso (population of 500) and Puerto Baquerizo Moreno (population of 5400) (Figure 1).
Figure 1. Inhabited zones of San Cristobal Island.
This study included the freshwater sources (La Toma and Cerro Gato) and the drinking
water treatment plant. During June 2013, 50 sample sites from 15 neighborhoods on the island of
San Cristobal were selected to represent locations throughout the drinking water distribution
system based on regional government information about the distribution infrastructure. Because
all buildings on San Cristobal rely on cisterns of approximately the same size, the buildings with
the highest demand for water would use the stored water faster and have shorter residence time
in the cisterns. Sites that were likely to have the highest demand for water – such as businesses
residence time of drinking water in these cisterns was presumed to be the shortest. The effect of
the drinking water distribution on drinking water quality could be more closely investigated by
reducing the residence time of water in cisterns. It is important to note that storage before use
was required at every site and likely influenced the drinking water quality reported.
2.2 Sample Collection
A total of 143 samples from 50 sites along the distribution system were collected in three
collection periods, which occurred in 7-10 day intervals in June and July 2013. A total of 144
samples from the same 50 sites were collected during three collection periods at the same
intervals during the same months in 2014. Every effort was made to collect a sample from each
site during each collection period, but inconsistent business hours and shifting schedules
occasionally prevented collection from sites within 48 hours of the start of a collection period. In
these instances, the site was skipped for that collection period. The two freshwater sources for
the island (La Toma and Cerro Gato) were included in the study to assess microbial
contamination from the beginning to the end of the treatment and distribution processes. Samples
were collected weekly from the DWTP in 2014.
During 2013 and 2014, 100 mL of water was collected in vacuum sealed, sterile 120 mL
vessels containing sodium thiosulfate from all 50 sample collection sites during each collection
period. The samples were placed in a cooler with ice packs and taken to the Galapagos Science
Center for enumeration of total coliform and E. coli using the IDEXX Colilert® method (Westbrook, ME USA) within 12 hours of sample collection. Permit requirements limited the
number of collection opportunities at the freshwater sources; however, there was one collection
After the 2013 collection period, the lack of detectable microbial contamination using the
Colilert method in the finished water of the DWTP and the high level of contamination observed
at post-distribution sites raised the hypothesis that microbial contamination may be caused by
human fecal contamination between sanitation and drinking water pipelines. To test this
hypothesis, 500 mL of water was collected from each point-of-use during the final collection
period in 2014 in double-washed and autoclaved glass laboratory bottles for MST analysis.
These 500 mL samples were filtered through 0.45 µm polycarbonate filter paper using a vacuum
apparatus. The resulting filter paper was stored in a -20°C freezer prior to transport to the
University of North Carolina at Chapel Hill (UNC-CH) for DNA extraction and molecular
analysis.
2.3 Total Coliform and E. coli Enumeration
Total coliform and E. coli most probable number (MPN) per 100 mL were measured at the Galapagos Science Center using IDEXX Colilert® (Westbrook, ME USA) according to the
manufacturer’s protocol.33
2.4 Physical and Chemical Parameters
All physical and chemical parameters were measured in 2014 using a YSI Professional
Plus handheld multi-parameter instrument. Atmospheric pressure was measured using the
internal barometer and temperature, dissolved oxygen, conductivity, and pH were all measured
using the relevant YSI probe attachments. Calibration of all probes was performed between each
collection period. Data were not collected in 2013 because appropriate instrumentation was not
2.5 DNA Extraction and Storage
DNA extraction was performed on all filtered samples using the MoBio PowerSoil®
DNA Isolation Kit (Carlsbad, CA USA) according to the manufacturer’s protocol during
September 2014, two months after collection. The 100 µL product of elution was transferred into
two single-use aliquots of 20 µL and one reserve aliquot of 60 µL which were stored at -80°C
until they were examined with the HF183 assays beginning in February 2015, seven months after
collection.
2.6 Conventional PCR
Conventional PCR was performed at UNC-CH using the human-specific HF183
Endpoint PCR assay as described by Bernhard and Field with slight modifications.25 These
modifications deviated from the initial study protocol primarily in the development of the master
mix. The HF183 Endpoint assay was performed using the following master mix components
(stock concentrations): HF183F (100 µM), Bac708R (100 µM), and 5 PRIME MasterMix
(2.5x). The optimized final concentration of these reagents and the amount of reagent per
reaction are found in Table 1. Forward and reverse primer sequences for this assay are described
Table 1. Optimized master mix reagents for HF183 Endpoint in this study.
Reagent Stock concentration Final concentration µL per well
DNA grade water --- --- 12.6
HF183F 100 µM 0.8 µM 0.2
Bac708R 100 µM 0.8 µM 0.2
5 PRIME MasterMix 2.5x 1x 10
Template or standard --- --- 2
Total 25
2.7 Quantitative Real-Time PCR
All quantitative real-time PCR (qPCR) was performed at UNC-CH using two
human-specific HF183 assays (HF183 SYBR and HF183 TaqMan).28,29 Both assays were performed in a
Bio-Rad CFX96 Touch Real-Time PCR Detection System (Hercules, CA, USA), which includes
the Bio-Rad CFX96 Optical Reaction Module and the Bio-Rad C1000 Touch Thermal Cycler.
The standard curve was calculated using the DNA sequence of Bacteroides dorei (GenBank reference AB242142).25 This sequence was serially diluted with concentrations ranging in orders
of magnitude of copy numbers from 108 / µL to 101 / µL.
The HF183 SYBR assay was performed using the following master mix components
(stock concentrations): HF183F (100 µM), HFsybR (100 µM), dNTP w/ dUTP (5 mM), MgCl2
(50 mM), PCR 10x reaction buffer (10x), and Hot GoldStar DNA Polymerase (5 U/µL). The
optimized final concentration of these reagents and the amount of reagent per reaction well is
found below (Table 2). The cycling conditions for HF183 SYBR were as follows: (1) 50°C for 2
minutes; (2) Polymerase activation at 95°C for 10 minutes; (3) 40 cycles of denaturation at 95°C
Table 2. Optimized master mix reagents for HF183 SYBR in this study.
Reagent Stock concentration Final concentration µL per well
DNA grade water --- --- 17.5
HF183F 100 µM 0.25 µM 0.0625
HFsybR 100 µM 0.25 µM 0.0625
dNTP (w/dUTP) 5 mM 200 µM each 1
MgCl2 50 mM 2 mM 1
PCR 10x reaction buffer 10x 1x 2.5
Hot GoldStar DNA Polymerase
5 U/µL 2.5 U 0.125
SYBR Green I --- --- 0.75
Template or standard --- --- 2
Total 25
The HF183 TaqMan assay was performed using the following master mix components
(stock concentrations): HF183F (500 µM), BthetR1 (500 µM), BthetP1 (100 µM), Fast
Universal Master Mix (2x), bovine serum albumin (2 mg/mL). The master mix was made in two
steps: (1) Creating a primer/probe mixture from the stock primers/probes; and (2) Combining
this prepared primer/probe mixture with the remaining master mix reagents (Table 2).
2.8 Primers and Probes
Table 3. Primers and probes used in this study.
Assay Primer/Probe Sequence (5’-3’) Reference
HF183 Endpoint HF183F ATCATGAGTTCACATGTCCG 25
Bac708R CAATCGGAGTTCTTCGTG 22
HF183 SYBR HF183F ATCATGAGTTCACATGTCCG 25
HFsybR TACCCCGCCTACTATCTAATG 28
HF183 TaqMan HF183F ATCATGAGTTCACATGTCCG 25
BthetR1 CGTAGGAGTTTGGACCGTGT 34
BthetP1 [6FAM]CTGAGAGGAAGGTCCCCCACATTG
GA[TAMRA]
34
2.9 HF183 Prevalence
Stool samples were collected from 22 residents of San Cristobal Island as part of an
ongoing anthropology study. Using the Omega Bio-Tek E.Z.N.A.® Stool DNA Kit (Norcross,
GA, USA), DNA was extracted from 200 mg of wet stool and eluted to a final volume of 50 µL.
These samples were analyzed using the conventional PCR and qPCR methods outlined above to
determine the prevalence of human-specific Bacteroides in the local population. Six 100 mL samples were collected from the influent to the waste water treatment plant (WWTP) on two
different dates (24 June 2014 and 18 July 2014) to examine the concentration of human-specific
Bacteroides in raw sewage. Of these samples, 10 mL from each waste water sample was filtered and analyzed using the same DNA extraction protocol and PCR/qPCR assays as the drinking
water samples.
2.10 DNA Sequencing
Positive point-of-use samples were confirmed via Sanger sequencing performed by Eton
Biosciences Incorporated (San Diego, CA). The resulting DNA sequences were compared to
sequenced microbial genomes using the Basic Local Alignment Search Tool (BLASTN 2.2.31)
sequences were first searched under Bacteroides in the representative genomes database. If no matches were found, then the complete genome database was searched for matches.
2.11 Data Analysis
All microbial data (total coliforms and E. coli) was logarithmically transformed for data analysis. Microbial data below the lower limit of detection (1 MPN / 100 mL) was assigned the
value (𝐿𝐿𝑂𝐷
√2 ) where LLOD represents the lower limit of detection. Samples above the upper limit
of quantification were assigned the value of this upper limit (2419.6 MPN / 100mL). The
arithmetic mean of the logarithmically transformed data was calculated for each site for 2013 and
2014. These values were compared between the years using a Wilcoxon Ranked Sum Test to
establish the significance of differences. The hypothesis tested included: (1) H0 ∶ 𝜇2013𝑇 = 𝜇 2014𝑇 ,
where 𝜇2013𝑇 and 𝜇
2014𝑇 imply arithmetic mean of ln(total coliforms) of all sites in 2013 and
2014, respectively; and (2) H0 ∶ 𝜇2013𝐸 = 𝜇
2014E , where 𝜇2013𝐸 and 𝜇2014E imply arithmetic mean of
ln(E. coli) of all sites in 2013 and 2014, respectively. The hypothesis testing was performed using a 0.05 significance level (α = 0.05).
A regression analysis was performed to determine if there was any relationship between
microbial contaminant concentration and pH or water temperature. Neither of these explanatory
variables closely correlated to microbial concentration levels and neither had an R2 value above
0.15. These analyses were performed with the SAS 9.4 software package. All figures
2.12 Spatial Analysis
Spatial analyses relied on drinking water distribution system design schematics available
through the San Cristobal Municipality. This data were often incomplete and occasionally
self-contradictory. Because of these limitations, a spatial analysis to determine correlations between
drinking water quality and distribution system characteristics could not be performed effectively.
The neighborhoods included in this analysis are identified herein by their numerical
identifiers: (1) Playa Mann; (2) Central; (3) Barrio Frio; (4) San Francisco; (5) Estacion Terrena;
(6) Algarrobos; (7) Fragatas; (8) Albatros; (9) Cactus; (10) Penas Bajas; (11) Penas Altas; (12)
Divino Nino; (13) Manatial and Isla Sur; (14) Manzanillo; (15) Palmieras; (16) El Progreso; and
(17) Socavon. Neighborhoods 14 and 15 are along the eastern border of the main population
center of Puerto Baquerizo Moreno, which contains neighborhoods 1 through 13 (Figure 2). The
RESULTS
The fecal indicator bacteria E. coli was measured in drinking water on San Cristobal Island at the freshwater sources, immediately post-treatment, and at 50 sites in the distribution
system over the course of two years. The freshwater sources of drinking water had detectable
concentrations of E. coli in every sample and all samples were above the upper limit of
quantification for concentration of total coliforms (>2400 MPN / 100 mL). In 2013, the E. coli
geometric mean concentrations (95% CI) were: La Toma 269 (268,270) MPN / 100 mL (n=2)
and Cerro Gato 893 (892,894) MPN / 100 mL (n=2). In 2014, the E. coli concentrations were: La Toma 82 (80,83) MPN / 100 mL (n=4) and Cerro Gato 154 (151,156) MPN / 100 mL (n=4). The
difference in E. coli concentration at the freshwater sources was not significant (p=0.08), which may be a result of low statistical power resulting from too few samples. The observed difference
(significant at α=0.10) between these freshwater sources may correlate to proximity to human
population or farms; however, analysis of land use is beyond the scope of this study.
Construction of a new DWTP was completed in September 2013, which significantly
lowered microbial contamination levels at the points-of-use between 2013 and 2014 (p<0.0001).
The microbial data indicates a decrease in total coliform (Figure 3) and E. coli (Figure 4) concentration at the neighborhood levels. These trends represent a significant decrease in
concentration of total coliform (two orders of magnitude) and E. coli (one order of magnitude) at points-of-use aggregated throughout the distribution system (p<0.0001). Three neighborhoods
saw a decrease in microbial concentration, yet retained some overlapping data to the upper and
lower extremes of each year (Figure 3 & Figure 4). These neighborhoods were not proximally
located and had no clear infrastructural relationship in regards to the ongoing distribution
Figure 3. Box plots of Log10 transformed total coliform concentration levels aggregated by
neighborhood. San Cristobal Island, Galápagos (2013-2014).
Figure 4. Box plots of Log10 transformed E. coli concentration levels aggregated by
0 1 2 3
1 2 3 4 5 7 8 9 10 11 12 13 15 16 17
Neighborhood T o ta l C o li fo rm Year Year 2013 Year 2014 0.0 0.5 1.0 1.5 2.0 2.5
1 2 3 4 5 7 8 9 10 11 12 13 15 16 17
The total coliform concentrations were quantifiable above the LLOD (1 MPN/100 mL) at
every point-of-use before construction of the DWTP. The concentration of indicator organisms
in the finished water of the DWTP was consistently below the LLOD after construction;
however, 66% of post-distribution sites (n=50) were detectable. This finding indicates that
microbial water quality problems are likely a result of the distribution system rather than
ineffective water treatment.
The total coliform concentration measured at the points-of-use significantly declined after
the construction of the DWTP (p<0.0001). The geometric mean of total coliform concentrations
in water at the points-of-use in June/July 2013 was 1262 (95% CI [1259, 1265]) MPN / 100 mL
and 6.9 (95% CI [0, 18.7]) MPN / 100 mL in June/July 2014 (Figure 5).
The geometric mean of E. coli concentrations in the drinking water of households in June/July 2013 was 40 (95% CI [37, 43]) MPN / 100 mL and 1.6 (95% CI [0, 4.7]) MPN / 100
mL in June/July 2014 (p<0.0001). Before construction of the DWTP, E. coli concentrations were detectable during at least one collection period at every site (100%) included in this study. The
post-construction percentage of sites with detectable E. coli concentrations in at least one collection period dropped to 28% of sites (n=50).
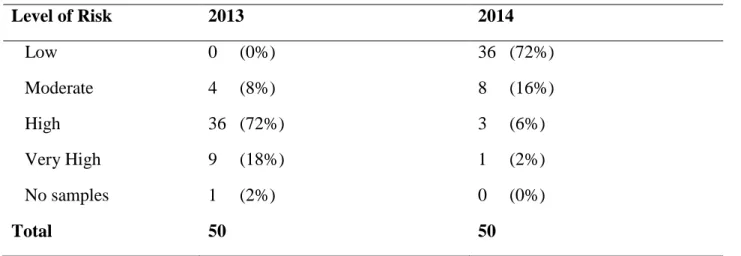
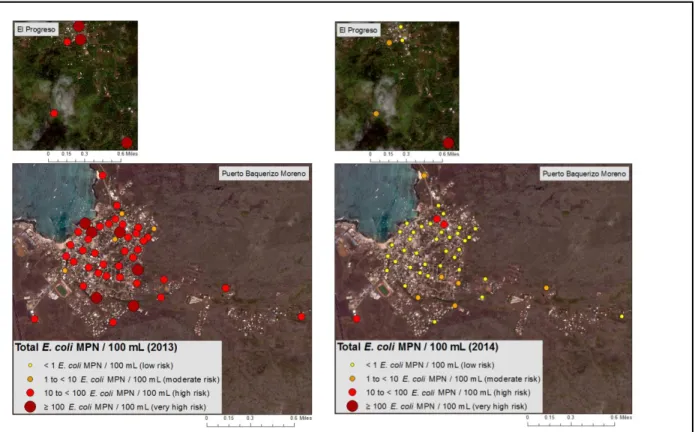
The E. coli concentrations defined in the legends (Table 4, Figure 6) correlate to World Health Organization (WHO) classifications of associated health risk for E. coli concentrations in drinking water.10 Prior to the construction of the new DWTP, 90% of sites had a high or very
high associated health risk, while after construction 8% of sites had E. coli levels that
corresponded to a high or very high health risk. After the completion of the new DWTP, 80% of
sites (n=50) were reclassified to a lower level of associated risk (Table 4, Figure 6). Breakdown
of the sites into risk categories after the completion of the drinking water plant can be found
below (Table 4).
Table 4. Health risks of microbial contamination before and after intervention for all tested
sample sites on San Cristobal Island, Galapagos (2013-2014).
Level of Risk 2013 2014
Low 0 (0%) 36 (72%)
Moderate 4 (8%) 8 (16%)
High 36 (72%) 3 (6%)
Very High 9 (18%) 1 (2%)
No samples 1 (2%) 0 (0%)
Figure 6. Spatial representation of Escherichia coli MPN / 100 mL (2013-2014).
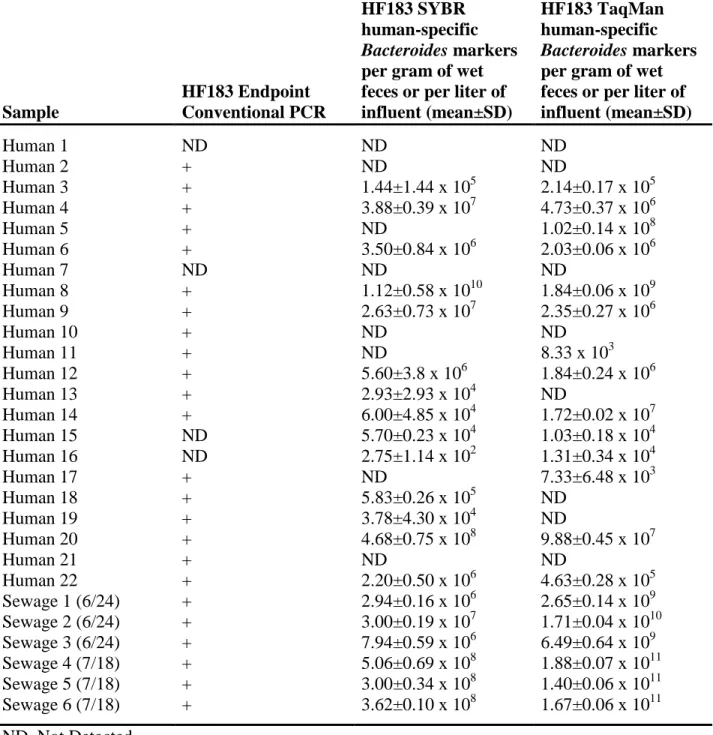
Assessment of the HF183 assays used in this study (HF183 Endpoint, HF183 SYBR, and
HF183 TaqMan) was performed on stool samples to confirm that the Bacteroides HF183 marker is present in the local population (Table 5). Among 22 human fecal samples, 18 (82%) were
positive using HF183 Endpoint, 14 (64%) were positive using HF183 SYBR, and 14 (64%) were
positive using HF183 TaqMan marker. Additionally, 100% (n=6) of the tested waste water
samples were positive for the marker in all three assays. This study found that the prevalence of
Table 5. Human-specific HF183 Bacteroides assay results for human fecal samples of residents and raw sewage samples on San Cristobal Island, Galapagos (2014).
Sample
HF183 Endpoint Conventional PCR
HF183 SYBR human-specific
Bacteroides markers per gram of wet feces or per liter of influent (mean±SD)
HF183 TaqMan human-specific
Bacteroides markers per gram of wet feces or per liter of influent (mean±SD)
Human 1 ND ND ND
Human 2 + ND ND
Human 3 + 1.44±1.44 x 10⁵ 2.14±0.17 x 10⁵
Human 4 + 3.88±0.39 x 10⁷ 4.73±0.37 x 10⁶
Human 5 + ND 1.02±0.14 x 10⁸
Human 6 + 3.50±0.84 x 10⁶ 2.03±0.06 x 10⁶
Human 7 ND ND ND
Human 8 + 1.12±0.58 x 10¹⁰ 1.84±0.06 x 10⁹
Human 9 + 2.63±0.73 x 10⁷ 2.35±0.27 x 10⁶
Human 10 + ND ND
Human 11 + ND 8.33 x 10³
Human 12 + 5.60±3.8 x 10⁶ 1.84±0.24 x 10⁶
Human 13 + 2.93±2.93 x 10⁴ ND
Human 14 + 6.00±4.85 x 10⁴ 1.72±0.02 x 10⁷
Human 15 ND 5.70±0.23 x 10⁴ 1.03±0.18 x 10⁴
Human 16 ND 2.75±1.14 x 10² 1.31±0.34 x 10⁴
Human 17 + ND 7.33±6.48 x 10³
Human 18 + 5.83±0.26 x 10⁵ ND
Human 19 + 3.78±4.30 x 10⁴ ND
Human 20 + 4.68±0.75 x 10⁸ 9.88±0.45 x 10⁷
Human 21 + ND ND
Human 22 + 2.20±0.50 x 10⁶ 4.63±0.28 x 10⁵
Sewage 1 (6/24) + 2.94±0.16 x 10⁶ 2.65±0.14 x 10⁹
Sewage 2 (6/24) + 3.00±0.19 x 10⁷ 1.71±0.04 x 10¹⁰
Sewage 3 (6/24) + 7.94±0.59 x 10⁶ 6.49±0.64 x 10⁹
Sewage 4 (7/18) + 5.06±0.69 x 10⁸ 1.88±0.07 x 10¹¹
Sewage 5 (7/18) + 3.00±0.34 x 10⁸ 1.40±0.06 x 10¹¹
Sewage 6 (7/18) + 3.62±0.10 x 10⁸ 1.67±0.06 x 10¹¹
None of the three HF183 assays detected human-specific Bacteroides in the finished water of the DWTP. Neither freshwater source had detectable human-specific Bacteroides
despite high concentrations of E. coli. Although there was E. coli contamination measured in post-distribution samples, the HF183 SYBR assay did not detect human-specific contamination
at any points-of-use. The HF183 TaqMan assay reported human-specific contamination at one
point-of-use (5.21±0.94 x 10⁶ copies per L).
The HF183 Endpoint assay initially found that five (10%) of post-distribution sites
(n=50) were positive for human-specific Bacteroides; however, a second HF183 Endpoint analysis found reproducible positive results in only two of the five positive sites. This
inconsistency may be caused by target sequence concentrations in the samples near the LLOD.
Of the two consistently positive samples measured via HF183 Endpoint, only one had detectable
levels of E. coli contamination on any of the three sample collection periods in 2014. The two consistently positive samples were examined using Sanger DNA sequencing through Eton
Bioscience Incorporated. Only the site with detectable E. coli contamination in 2014 was confirmed to have a sequence belonging to the genus Bacteroides based on Sanger sequencing results and a search of the BLAST database. The site with confirmed human-specific
contamination through HF183 Endpoint was the same site as reported by the HF183 TaqMan
assay. The sequence amplified at the other site did not match any genomes available through the
BLAST database.
There was no significant relationship between the microbial concentrations and
temperature, pH, dissolved oxygen, or conductivity. The arithmetic averages of these parameters
DISCUSSION
The results of this study indicate that the construction of a new DWTP has improved
drinking water quality but has not brought the quality at the points-of-use to acceptable levels
according to WHO and USEPA Guidelines. Although there was a significant reduction in fecal
contamination measured as E. coli before and after the installation of the DWTP (p<0.0001), any detectable concentration of fecal indicator organisms at the points-of-use carries an inherent
health risk.10 Furthermore, detectable E. coli in a drinking water sample is considered unsafe and results in a boil water advisory. Despite improvements to the infrastructure in the form of a new
DWTP, microbial drinking water quality did not meet WHO or USEPA Guidelines at 28% of
points-of-use.
This study finds that the improvement provided by the DWTP alone has not met
microbial guidelines for drinking water; however, water quality degradation through the
distribution system is likely the main reason for low water quality at points-of-use. This
conclusion is backed by the finding that total coliform concentrations of the finished water of the
DWTP was below the LLOD; however, the geometric mean of total coliforms at the
points-of-use was 6.9 (95% CI [0, 18.7]) MPN / 100 mL, and total coliforms were above the LLOD at 66%
of sites sampled (n=50). This increase in contaminant concentration through the distribution
system may be indicative of potential faults such as broken pipes, accumulated biofilm, or
incorrect free chlorine dosage to provide residual disinfection.
Free chlorine is the only disinfectant used in this system. The half-life of free chlorine in
drinking water distribution systems is less than one day at temperatures above 25°C.37 Formal
analysis of water residence time was not part of this study. Storage times were likely highly
for at least one day. Higher pH hinders the disinfecting capability of free chlorine. Water at the
points-of-use had an average pH of 7.81, which is not out of the recommending operating pH,
and an average temperature of 26.1°C. Both of these measures, especially temperature, are likely
affected by storage in cisterns prior to use. Regression analysis found no correlation between
microbial contamination and pH or water temperature.
Relatively high temperature and dissolved oxygen levels at the points-of-use are likely
caused by storage conditions at each site rather than distribution infrastructure design. The water
is stored in cisterns at every site after distribution and before consumption. These containers
have black lids and absorb heat from the sun raising the temperature of the water. Cleaning and
maintenance of cisterns is the duty of the owners, which can result in inconsistent cleaning
cycles and improper handling of drinking water. This introduces the possibility of
post-distribution microbial contamination at the points-of-use and may contribute to the observed
microbial contamination measured as E. coli and total coliforms.
The HF183 assays indicate no human-specific markers in the freshwater sources for the
island despite high concentrations of E. coli at these reservoirs.The HF183 SYBR assay did not find quantifiable concentrations of human-specific Bacteroides in the drinking water at the points-of-use; however, HF183 TaqMan reported one point-of-use with quantifiable
human-specific Bacteroides. Furthermore, HF183 Endpoint initially reported five positive samples. Further analysis of these five samples found inconsistent reproducibility and only resulted in two
reproducibly positive samples. The inconsistency of these results may be caused by target gene
concentrations near the LLOD. Interestingly, only one of the two positive results was
The MST performed in this study suggests that the majority of microbial contamination
observed at the points-of-use is likely caused by sources other than human fecal contamination.
The positive site measured via HF183 Endpoint and HF183 TaqMan suggests that some human
fecal contamination is present in the drinking water of at least one point-of-use. This point-of-use
was a farm that relied on an open-air storage cistern near muddy soil and grazing animals. These
conditions raise the question of whether the contamination occurred in the drinking water
distribution pipelines or at the use in the cistern. Because there was only one
point-of-use with a positive HF183 result, it does not indicate a systematic problem contributing to
contamination of drinking water. Instead, reported contamination may result from cistern storage
conditions or mishandling water at the points-of-use.
Post-distribution microbial contamination during storage in cisterns should be examined
carefully in future research. The temperature during storage may have played a role in observed
microbial contamination at the points-of-use. The ambient temperature during the period of this
study was typically between 20°C and 24°C and was fairly constant; however, direct sunlight on
the opaque storage cisterns may raise the water temperature. This sunlight would not necessarily
have a biocidal effect within the opaque cistern but could create a favorable environment for
microbial regrowth despite moderate ambient temperature. The microbial contamination at the
points-of-use reported in this study could result from these conditions.
Future work that examines the microbial water quality at the freshwater sources may be
beneficial to clarify the state of microbial water quality. The data included in this study indicates
a higher percentage of source water from the reservoir with lower microbial concentration may
reduce the treatment demands placed on the DWTP.
This study would have been improved by including measurements throughout the year to
account for seasonal variation in precipitation. Because of personnel and funding limitations, the
study could only be performed during the months of June and July in consecutive years. This
time period occurs during the initial months of the dry season, which results in less rainwater
runoff that may contribute to bacterial transport through the environment. Future research could
strengthen the findings of this report by examining drinking water quality differences between
the wet (December to May) and dry (June to November) seasons.
Diagrams of existing drinking water distribution and sewage systems were available
through the local municipality; however, they were occasionally self-conflicting or unclear.
These shortcomings prevented in-depth spatial analysis to examine the relationship between
microbial water quality and distance from the drinking water plant. Clear record keeping should
be a point of emphasis between the municipality, engineering, and construction firms in any
future distribution infrastructure improvement projects.
Another issue with this study was the storage and transport of samples subject to the
MST analysis. The water samples could not be analyzed quantitatively in the archipelago, so
they were filtered on the island then the filters were frozen and transported to UNC-CH for
analysis. The samples were stored at -20°C and were wrapped in insulating material for
transport. This resulted in a total of one freeze-thaw cycle during transport; however, it
minimized the amount of time the samples were in a thawed state prior to storage and
could have caused underestimation of the amount of human fecal contamination in the samples
or even false negatives.
More comprehensive validation of the HF183 assays used herein should be performed.
The species with the highest previously reported cross-reactivity with the HF183 assays are not
found in the Galapagos. This study is the first to examine the prevalence of HF183 assays in the
human population via fecal samples, but we did not examine the specificity of the assays in
regards to animal species of interest such as dogs, chickens, cats, or goats.
Despite these limitations, this study creates a baseline for future studies which can be
used to explore the interplay between drinking water quality, environmental health, and public
health on the island. For example, these results provide context to water quality related health
outcomes at the local hospital.
Furthermore, this study finds that the use of human-specific source tracking markers in
the Galapagos is appropriate given similar prevalence of Bacteroides in the resident population of Galapagos and previous locations of HF183 assay application. These methods confirm some
of the assumptions made by Stumpf et al. about the prevalence of human-specific markers in the
resident population and encourage the use of these assays on the islands as researchers examine
CONCLUSION
This study presents the most in-depth analysis of drinking water quality on any island in
the Galapagos archipelago to date. The DWTP completed in September of 2013 significantly
reduced microbial contamination (measured as total coliforms and E. coli)of drinking water at the points-of-use in June/July of 2014 (p<0.0001). However, fecal contamination measured as E. coli in drinking water was still detectable in 28% of post-distribution sites analyzed (n=50), which would violate USEPA and WHO Guidelines for drinking water quality. Drinking water
handling and storage at the points-of-use likely play a role in the microbial water quality and
may explain some of the observed variation between sites. Handling and storage practices can be
improved by constructing neighborhood cisterns maintained by municipal employees as is
currently planned. Maintaining adequate free chlorine residual for disinfection may be
problematic in this distribution system. The proposed centralized storage sites would allow
municipal employees to re-chlorinate the drinking water nearer to the point-of-use and may
mitigate microbial contamination observed in this study.
This study finds that the majority of post-treatment microbial contamination of drinking
water on San Cristobal Island is not strongly related to human-specific sources of fecal
contamination. This result raises further questions about the source of fecal indicator organisms.
Future research in the Galapagos is required to determine whether environmental regrowth or
non-human fecal contamination is the cause for E. coli detection at the points-of-use. Storage cisterns in the Galapagos should be investigated, as they may provide ideal environments for
microbial growth.
Furthermore, this study shows that the human-specific source tracking assays of HF183
Cristobal Island, Galapagos as they do in the populations for which they were originally
developed. Future use of these assays by agencies in the Galapagos will enable development of a
more complete characterization of microbial contamination sources and transport as researchers
work to analyze the impact of anthropogenic stressors on the environment of the Galapagos
REFERENCES
1. Epler B. Tourism, the Economy, Population Growth, and Conservation in Galapagos. Puerto Ayora, Santa Cruz Island, Galapagos Islands, Ecuador; 2007.
2. Quiroga D. Crafting nature : the Galapagos and the making and unmaking of a “ natural laboratory .” J Polit Ecol. 2009;16:123-140.
3. Liu J, D’Ozouville N. Water Contamination in Puerto Ayora: Applied Interdisciplinary Research Using Escherichia Coli as an Indicator Bacteria. Galapagos Rep 2011-2012. 2013:76-83.
4. Rueda Córdova D, López Medina J, Nakaya S. Monitoreo de Calidad del Agua en la Isla Santa Cruz. 2008:1-31.
5. Prüss A, Kay D, Fewtrell L, Bartram J. Estimating the burden of disease from water, sanitation, and hygiene at a global level. Environ Health Perspect. 2002;110(5):537-542. doi:10.1289/ehp.02110537.
6. Lopez AD, Mathers CD, Ezzati M, Jamison DT, Murray CJ. Global and regional burden of disease and risk factors, 2001: systematic analysis of population health data. Lancet. 2006;367(9524):1747-1757. doi:10.1016/S0140-6736(06)68770-9.
7. Hutton G, Haller L, Bartram J. Global cost-benefit analysis of water supply and sanitation interventions. J Water Health. 2007;5(4):481-501. doi:10.2166/wh.2007.009.
8. From Risk to Rule : How EPA Develops Risk-Based Drinking Water Regulations.; 2003. 9. Gadgil A. Drinking water in developing countries. Annu Rev Energy Environ.
1998;(23):253-286.
10. WHO. WHO Guidelines for Drinking-Water Quality. 4th ed. Geneva; 2011. http://www.ncbi.nlm.nih.gov/pubmed/24286868.
11. Thomann R V, Mueller JA. Principles of Surface Water Quality Modeling and Control. New York: Harper & Row Publishers; 1987.
12. Sloat S, Ziel C. The Use of Indicator Organism to Assess Public Water Safety. Loveland, Colorado: HACH Company; 1991.
13. WHO. Guidelines for Drinking-Water Quality. 3rd ed. Geneva: World Health Organization; 2006.
Indicator Organism Paradigm for Pathogen Reduction in Reclaimed Water and Public Health Protection. Appl Environ Microbiol. 2005;71(6):3163-31.
doi:10.1128/AEM.71.6.3163.
15. Monfort P, Baleux B. Comparison of flow cytometry and epifluorescence microscopy for counting bacteria in aquatic ecosystems. Cytometry. 1992;13(2):188-192.
doi:10.1002/cyto.990130213.
16. Rowe R, Todd R, Waide J. Microtechnique for most-probable-number analysis. Appl Environ Microbiol. 1977;33(3):675-680.
17. Fujioka RS, Unutoa TM. Comparative stability and growth requirements of S. aureus and faecal indicator bacteria in seawater. Water Sci Technol. 2006;54(3):169-175.
doi:10.2166/wst.2006.465.
18. Byappanahalli M, Fujioka R. Indigenous soil bacteria and low moisture may limit but allow faecal bacteria to multiply and become a minor population in tropical soils. Water Sci Technol. 2004;50(1):27-32.
19. Betancourt WQ, Fujioka RS. Bacteroides spp. as reliable marker of sewage contamination in Hawaii’s environmental waters using molecular techniques. Water Sci Technol.
2006;54(3):101-107. doi:10.2166/wst.2006.455.
20. Bej AK, McCarty SC, Atlas RM. Detection of coliform bacteria and Escherichia coli by multiplex polymerase chain reaction: Comparison with defined substrate and plating methods for water quality monitoring. Appl Environ Microbiol. 1991;57(8):2429-2432. 21. Boehm AB, Van De Werfhorst LC, Griffith JF, et al. Performance of forty-one microbial
source tracking methods: a twenty-seven lab evaluation study. Water Res. 2013;47(18):6812-6828. doi:10.1016/j.watres.2012.12.046.
22. Bernhard AE, Field KG. Identification of nonpoint sources of fecal pollution in coastal waters by using host-specific 16S ribosomal DNA genetic markers from fecal anaerobes.
Appl Environ Microbiol. 2000;66(4):1587-1594. doi:10.1128/AEM.66.4.1587-1594.2000. 23. Franks AH, Harmsen HJM, Gerwin C, Jansen GJ, Schut F, Gjalt W. Variations of
Bacterial Populations in Human Feces Measured by Fluorescent In Situ Hybridization with Group-Specific 16S rRNA-Targeted Oligonucleotide Probes Variations of Bacterial Populations in Human Feces Measured by Fluorescent In Situ Hybridization .
1998;64(9):3336-3345.
24. Avelar KES, Moraes SR, Pinto LJF, Souza WDGSE, Domingues RMCP, Ferreira MCDS. Influence of Stress Conditions on Bacteroides fragilis Survival and Protein Profiles.