The availability of statistical data for all users requires that the data be presented in a format that is accessible for multiple users and task purposes. A tabular presentation of statistical data through a Java application called a Table Browser was usability tested for this purpose. Three task types were employed in determining how statistical data is used and worked with in a tabular format and whether there was a difference in use between the Table Browser and a standard PDF presentation of the same data. Users concept of statistical data as presented in a tabular format was assessed and
recommendations for future developments in the Table Browser were made.
Headings:
TABLE BROWSER USABILITY STUDY
by
Laura Chessman
A Master's paper submitted to the faculty of the School of Information and Library Science of the University of North Carolina at Chapel Hill in partial fulfillment of the
requirements for the degree of Master of Science in Information Science
Chapel Hill, North Carolina November, 2000
Approved by:
Table Browser Usability Study
For centuries people have been trying to represent data not only in a language and symbolic (i.e. numbers) manner, but also through visual representations such as graphs. Much research has gone into understanding graphical representations of data, but very little research has explored the use of tables in presenting statistical data.
There are two primary representation categories used for statistical data: tabular representation and graphical representation. Research into the area of which method of representing statistical data is most effective for human understanding of that data has been inconclusive. Results vary based on conditions such as context of the data, purpose of the data, and differences between users of the data. A consistent understanding about the differences between tabular and graphical representations of data is that tabular data gives more detailed and precise information. This research, while providing meaningful information as to what situations different representations of data might be best applied, does not help in designing a statistical information system that is used for a wide variety of purposes and users. Recently, research into user behaviours with tabular data by Hert and Marchionini has generated ideas of new ways to represent tabular data. Based on this work, a new system that can be meaningfully used by the widest group of users possible, has been prototyped.
order to explore the differences between presenting data through a flat table and through the Table Browser application, a usability study was conducted. The Table Browser allows for basic manipulation of table variables in terms of ordering, placement, temporary deletion, and selection as well as providing extended contextual information (metadata) for the variables. (Note that any manipulation performed on the data by the user within the Table Browser is temporary and only applies to the particular user's view.)
Background
The literature on usability of tabular interfaces is very limited, the majority of literature focusing on the display of quantitative information deals with graphical
displays rather than the tabular display of information. When tabular data is dealt with in the literature, it is generally being compared to graphical interfaces. The writings and research in this area tend to come to similar conclusions when comparing these two forms of representation; the result showing that the "better" method depends on the task
(Alonso et al., 1998, Dickson et al., 1986, and Wainer, 1992). Beyond this, it depends on the quality of the representation, whether that be graphical or tabular, that also defines the usability of a dataset and whether one format is superior over another format for the task at hand.
Users
Before going into the ideas of tasks and data usability it is necessary to understand the users of the data. (Allen, 1996 and Hix & Hartson 1993) Knowledge of the users of an information source help in defining design decisions both because of individual difference issues including perceptual abilities, physical abilities, education, technical abilities and comfort level,(Allen, 1996) and because of the social and cognitive context within which the information, and therefore the information system, is being used. (Hix and Hartson, 1993) From this knowledge of users, it is possible to develop a better understanding of the tasks users want and need to accomplish with the specific information. (Lewis and Rieman, 1993)
coming from large organizations such as government, the business sector, and financial institutions, used specifically by users in local government. They found that the users of this data tended to be "naïve users" for whom the current information delivery systems were not designed and for whom the systems were not adequate. Robbin and Frost-Kumpf (1997) took a somewhat different, and more complicated, approach in defining users. Their article focused on determining how errors occurred when users worked with statistical data. In doing this, they focused on both the producers and developers of data along with the end-users of the data. For the end-users of the data, the authors defined one of the major causes of errors as being a lack of an adequate concept on the part of the end users as to what the data output meant.
continue to discuss the importance of social cognition, where cognition is affected by the social context of the information and experiences of the individual. While the authors suggest that concepts and social cognition affect how people can work with datasets, this should be extended to include the concepts and schemas that users have regarding the tools available through the physical interfaces that data is presented through.
Beyond the misinterpretation of data due to difficulties with concepts and
schemas, there are errors as described by Norman(1988) as slips and mistakes. Errors of slip fall into six categories. These include capture errors, description errors, data-driven errors, associative errors, loss-of-activation errors, and mode errors. The commonality between errors of slip is that they originate "from automatic behavior, when subconscious actions that are intended to satisfy our goals get waylaid en route." Mistakes on the other hand are considered to be "Errors of thought." Mistakes occur because of there is an inconsistency between what a person understands or decides, does not fit in with the situation.
Tasks
In developing applications it is necessary to understand the task needs of the user. This should include knowledge and analysis of the task that is independent of any system used in accomplishing the task (Hix & Hartson, 1993). An overall task analysis goes through steps ranging from defining an information need or reason for seeking
1. searching for indicators,
2. encoding the value of indicators,
3. performing arithmetical operations on the values, and 4. making spatial comparisons among indicators.
These steps are not static and can change in order or combination depending on the specific task. Beyond this, Allen breaks down the basic tasks in any information system from "get, select, evaluate, and respond," to a more refined set of steps found by Goh and Coury (1994) when evaluating how people process information in a numerical form. For numerical information processing, the tasks are, "get, divide, compare, add, select, evaluate, multiply, difference, round, respond." (Allen, 1996)
Initial research in representation of statistical information focused on how representation affected decision making with the outcome of the various research culminating in the idea that the "task environment" was the primary predictor of
effectiveness of one representational method compared to another method (Dickson et al., 1986). Specifically, the results in the article indicated that for smaller amounts of data where more detailed information was needed, tabular representation was superior to graphical representation but that when the task required a general overview, a graphical format was superior in decision making. An interesting note made by the authors
Wainer(1992) would agree with the idea that user tasks necessarily define what the representational method should be, yet goes beyond this specific task based method of thinking about how data should be formatted and explains that various methods of
representation can encourage new ways of seeing and understanding the data, and that graphical means of representation are not inherently easier to understand than tabular data. The point that within a dataset, the specific representation style can help the user to find new points or ideas about the data, is particularly interesting to the question at hand in that users have different needs coming from the same data, and flexibility on the user side can increase use and effectiveness of datasets. When the author speaks of this he is not comparing graphical to tabular format, but saying that within either of these formats, representation determines how the user sees and understands the available data. The design of the information can either help or hinder people in specific tasks and within this, the task is really what will determine whether the specific design is one or the other, rather than a design necessarily being inherently bad or good.
Design Concepts
Based on user needs and task requirements, there have been some
recommendations for the design process of tabular data. These recommendation range from the theoretical to specific recommendations in format design. Robbin and Frost-Kumpf (1997) give design recommendations for reducing error by taking the following steps:
1. Designing for Communicative Competence
c. Create a communication network for shared conversations. 2. Designing for Cognitive Competence
a. Provide a good mental model of the data.
b. Create a supported learning environment to encourage the self-detection of error.
Four of the design recommendations are quite relevant to the current question, these are; 1b, 1c, 2a, and 2b. For 1b, prototyping “the data productions and data utilization
process,” the idea is that there needs to be communication between the designers and the users of the system and that this communication process should happen during the design process. Point 1c, “create a communication network for shared conversations,” represents the need for data to be explained to the end user. This includes the use of a type of
standard in how data is described and communicated between the developers and the users.
such as thumbnails or a site-map type structure? Would these relationships be representable through metadata?
Point 2b, to “Create a supported learning environment to encourage the self-detection of error,” heavily relies on the idea of meeting the needs of users, from a standpoint of helping users learn while working with the data. This means presenting the data in an accessible format that does not limit them based on their current state of
knowledge, cognitive, and perceptual abilities. It is necessary to understand these specific limitations in order to come up with guidelines for designing an information system.
Analysts are limited by how much information they can retrieve and evaluate. Because there are severe limitations on memory and attention, systems must be designed to reduce the number and structure of tasks that the user is required to perform on the data. It is therefore essential to simplify what must be remembered.
In this area there are three specific recommendations made by Robbin and Frost-Kumpf: 1. metadata should be developed to make the background assumptions and
contexts of the data explicit
2. Systems should be designed with extended browsing capabilities. 3. Help systems should be employed because they can extend the user’s
memory.
The previous recommendations were made in relation to user needs analysis, but Robbin and Frost-Kumpf also bring up the data driven idea that sequential representation of data in a flat file can obscure the relationship between some variables and can also essentially cause the loss through representation of relationship integrity between variables in the data that were available at the time of collection. While the authors are referring to this through a data storage issue, the same idea is also relevant when thinking about ways to represent data and data relationships to an end-user. Both the issues of how data is communicated between the developer and the end user and of how the data
concept is made available are represented by this concern.
In an article by Spenke, Beilken, & Berlage the development process of a table consisting of non-statistical data was described. There is no description of the users or tasks, but there are descriptions of some interesting techniques used in developing the table interface. Some interesting ideas in the development of this table are that users should be able to make “global observations.” Specific details of the design include an overview mode in which users can get an idea the type of information covered by the system. Beyond this users are able to inspect compact tables, where some of the information is hidden from view. Specific capabilities include; sorting, constant
her view of the information to help in finding the desired information by letting the user sift through the data in a format that meets the user’s needs. The need of user’s to manipulate their information interface is really an integral need for all information interfaces and not just tabular interfaces. This is addressed by Dillon (1994) when comparing paper-based to electronic sources of textual information. According to Dillon a specific issue with electronic text over paper based text is that electronic text is not as easily manipulated. The type of manipulation that Dillon refers to is manual manipulation such as keeping your place in a book or on the page while looking for related
information.
While all of the above recommendations are interesting and seem to be well thought out, they are not based on specific empirical research. Wainer gives a description of how, in the past, the testing of human's understanding of statistical data has been flawed due to the selection of tasks in various testing scenarios and goes on to describe more appropriate goals in developing appropriate testing scenarios. Wainer claims that test items involving tables tend to increase in difficulty by requiring the participant to extract more variables and to perform computations upon these variables rather than to require inferences and a deeper understanding of the body of data. The suggestion made is for a measurement of numeracy that includes, "firstness" where single bits of
information are extracted, "secondness," where trends and groupings are looked for, and "thirdness," comparisons of groups are required. These guidelines for developing testing scenarios in statistical data information systems are reasonable and necessary to make further recommendations in design issues.
The Table Browser
Development of the Table Browser stems from research carried out by Hert & Marchionini (1998). The goal of the initial study was to explore who uses statistical websites provided by the federal government, what tasks these users are trying to accomplish with the information at the websites and what are the strategies used in accomplishing these. From this, the development of ideas on ways to better design this type of information for websites emerged. To obtain this information, multiple
Hert & Marchionini are of particular interest, specifically; user tasks and strategies. Tasks were broken down so that each could be characterized in terms of three primary
categories that were identified and broken down further to create a "Query-Based Taxonomy of User Tasks." See Hert & Marchionini (1998) for a full listing. Strategies employed by users were explored primarily through interviews and transactions logs with interviews providing the deeper information, and resulted in the development of ways to support various tasks and a system to encourage specific strategy and help seeking behaviours. It is primarily from the results of this research that the guidelines for development of the Table Browser came about.
More specific guidelines for the development of the Table Browser are given in Marchionini et al. (1999) where the idea of broadening the range of possible users of federal statistics available on the Web are introduced. This has been incorporated into the development of the Table Browser. There are three primary concepts introduced in the paper that have been guides for development of the Table Browser: broadening views, explanations through metadata, and availability of tools.
but rather that a basic understanding of the data will make it possible to develop a graphical representation that will further develop an understanding of the data. To go further with this idea, a system that to truly makes information available to a wide variety of users with varying backgrounds and needs, it is essential to provide data in a system that can truly represent the body of data so that a concept of what the data encompasses, what the relationships with the data are, and how to access these are available to all users so that the data can be manipulated by the individual for further use.
Methods
Participants
Twelve participants were recruited to participate in a usability test of the Table Browser. To understand participants backgrounds with statistics, initially participants were given a short survey in which they were asked questions regarding their past experiences with statistics as well as looking for statistical data on the Web. The
questions were designed to encourage participants to develop an understanding of what a table is and to determine accurately from this how much experience participants actually had using tables.
Systems
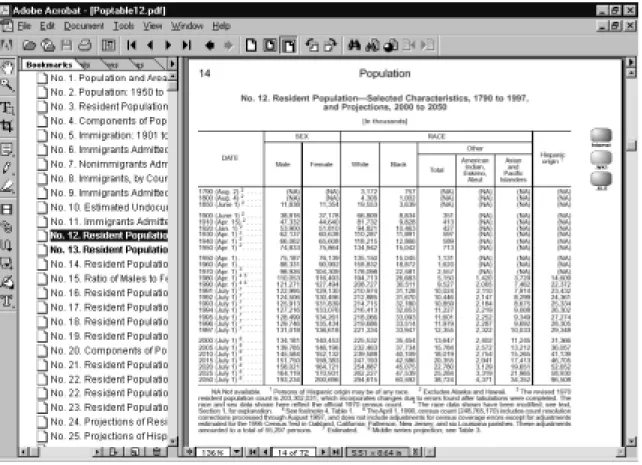
description of the Table Browser capabilities immediately prior to their use of that system in completing tasks. Before completing the tasks in the experimental condition,
participants were given the opportunity to explore both the PDFs and the Table Browser in order to gain further familiarity with the systems.
Figure 2 – PDF displaying Table 12 of the Population Tables
Tasks
Each list was also represented equally as to whether it was in the first or second
presentation group (see Table 1.) Tasks on the list were ordered within each list so that the simplest tasks appeared first and the more complicated tasks appeared last. The ratings of complicity were based on the task type. There were three task types, the first being a simple find of a single variable, the second being a manipulation on two found variables, and the third being a task that required comparing across groups using variables such as time or seeking trends. For examples of tasks, see Appendix A.
Table 1
List 1 List 2
Browser Flat
List and system method for each group for first presentation of tasks by user group.
List 1 List 2
Browser Flat
List and system method for each group for second presentation of tasks by user group.
Group 1 Group 2
Group 3 Group 4
Group 4 Group 3
Procedure
During completion of the tasks there were two primary measurements taken. The first of these was a time measurement starting after the initial presentation of the question when the participant proceeds to the table and ending when a participant submits his/her response. The second measurement type was performance. This were evaluated by the response of the participant, whether responses were either correct or incorrect.
After completion of the tasks participants were given a brief post-interview to determine what preference he or she had in using the Table Browser versus the PDF files. They were then asked to fill out a post-survey primarily derived from a selection of questions from the Questionnaire for User Interaction Satisfaction (QUIS™) and also including two other questions about table interface preference. For the QUIS, participants were asked to answer each set of questions twice. Once while considering the Table Browser and once while considering the flat presentation of the tables. Sessions took approximately one hour, although they ranged in length by user between forty-five minutes and one hour and fifteen minutes.
Results
Tasks
There was no significant difference between the number of errors made between the two different interfaces, nor was there a significant difference in the time spent completing tasks between the two different interfaces. Of the total thirty-seven errors made by all participants, twenty-one were made using the Table Browser interface and sixteen were made using the PDF interface.
Table 1 - Errors made within each interface
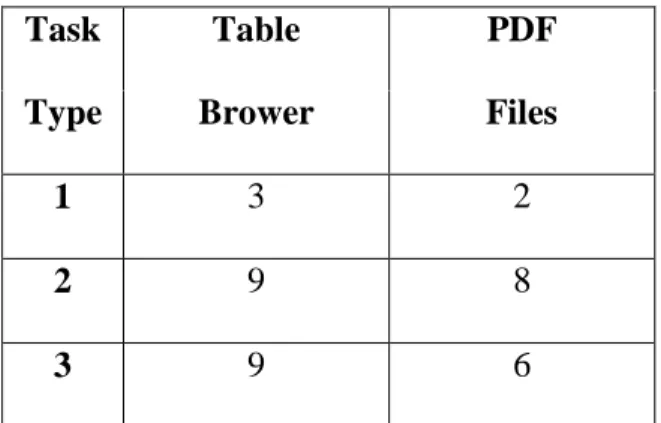
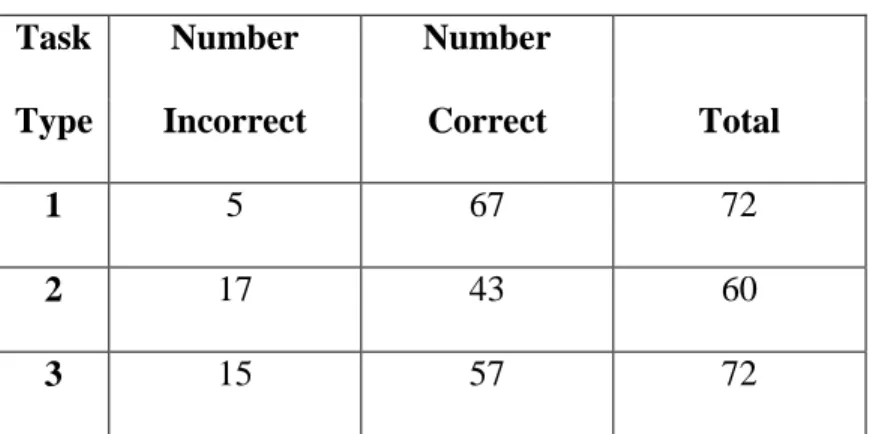
Participants performed the most errors with task type 2 with a total of seventeen errors out of sixty scorable tasks in type 2. (See Table 2) Errors were marked when the response given was correct either completely or if the number would have been correct if multiplied by 1000. The issue of correctly interpreting the actual quantity, in terms of the numbers being represented in the thousands, will be addressed below. There was one task that was not scorable, reducing the number of scorable tasks of type 2. The task that was not scorable asked "By how much did the overall population increase between the years 1970 and 1990?" While this seems like a relatively simple task, users found information that could conceivably answer this question in multiple different tables, each of which gave a different answer. Because the question did not specifically ask users to use Table
Task Table PDF
Type Brower Files
1 3 2
2 9 8
26 of the U.S. Census Bureau's Population Statistics 1996, the errors cannot be attributed to a usability issue of either format, but rather an issue with the way that the specific question was asked.
Table 2 - Errors by task type
Participants also spent the most amount of time on task type 3. (Table 3) This is not surprising in that task type 3 required a greater amount of cognitive processing in finding statistical trends or broad comparisons.
Table 3 - Average time spent on each task type
Task Type Mean Time PDF Mean Time TB Mean Time Total Standard Deviation for Total
1 114.17 99.33 106.75 63.47
2 104.56 155.22 129.89 99.26
3 156.44 200.56 178.50 128.40
Total 125.06 151.70 138.38 104.53
Task Number Number
Type Incorrect Correct Total
1 5 67 72
2 17 43 60
User Action Patterns
In observing users interact with the tables it was possible to see patterns users exhibited in searching for statistical information. The initial step the participants had to take was to determine which table the appropriate information is in. Doing this was difficult for some users. In the PDF format, users frequently did not realize that they could enlarge the size of the frame that contained the titles of each table and went back and fourth between the tables to discover what was in each table. In the Table Browser format, users frequently used the meta-context window to determine what the title of the tables were. This was limited however because when the information came into the window, the user had to scroll up to get to the title. Beyond this, users had difficulty determining whether the table opened was indeed the table with the necessary
information. The scope of the information was misunderstood in some tables and once a user began to doubt whether they were on the right table, they conducted back and forth checking with both the different tables and going back to the wording of the task several times. The doubt expressed here led to errors. At least one participant had the correct answer initially and then changed his/her answer to an incorrect answer. In both interface types several participants attempted to use the wrong table to find their answer even after having looked at the correct table, but giving an incorrect rejection of this table, when trying to complete a task. This second scenario was less likely to outcome in an error as participants would eventually go to the correct table, however, time was lost. This error occurred in all three task types.
where this was the case was with the Table Browser when the information being looked for was part of a grouping of information and there was a “parent” row with “children” rows. Participants occasionally read from the wrong cell in this scenario, either
mistakenly looking at the child row when it was the parent row that was needed or vice versa. While this scenario did not frequently cause an error, it did occasionally slow participants down and cause some confusion. When scrolling occurred, there was some difficulty keeping track of the correct row or column, but this was a difficulty that users were mostly aware of and therefore did not make as many mistakes in doing. The PDF interface was described by users as being difficult to keep track of the column and row headings. Six of the twelve participants mentioned that they liked the ability within the Table Browser to highlight a row or column or they mentioned that they liked the ability to lock row headings. In observing participants, this proved to be the most useful type of tool that was available in the Table Browser, but not available in the PDF format.
The “shape” of the information (i.e. horizontal vs. vertical) proved to be a difficulty for participants. People did not want to scroll to the right to find the necessary information. This falls into the schema/concept issue in that people do not realize what information is available to the "right." People are used to paper or word processing programs in which information goes down (i.e. down the page until you have to go to the next page or requiring you to scroll down the page in a word processing program.) In the PDF interface, users dealt with this by zooming out. This was particularly relevant to tasks using Table 14, which in the PDF files was laid out in a landscape view.
the Table Browser interface. Users reacted to the zoom in and zoom out functions in the Table Browser with initial interest, but this was not found to be useful. The Table
Browser zooming functions do not provide users with a view of the layout of the data in a form that they recognize the way the PDF format does. No user attempted to use the zooming function more than once with the Table Browser.
As mentioned above, a frequent error in reporting responses to various tasks, was the error of misinterpreting the magnitude of the numbers. Only two of the twelve participants did not make this error, and only three of the twelve participants made this error consistently in that with every task where this error could be made, it was made. Seven of the twelve participants made this error at some level. Four of these twelve made the error after having previously realized that the numbers were represented in the
thousands and had altered their responses to represent that, yet did nor represent that consistently. This error was made with both interfaces, nineteen times with the Table Browser and seventeen times with the PDF interfaces.
Of the tools available in the Table Browser, the only tool used by all participants, was the ability to highlight a row or column. Using the tools in the Table Browser was limited by the level of development of the tool, by the users’ understanding of the tool, the way that the tool worked, and by what the tool did. One participant used every tool except the create a new table tool, but this participant did use the tool to create a sub-table. This tool was helpful in removing the extraneous information for this participant, but the idea of creating a sub-table in order to reduce the amount of extraneous
Eleven of the twelve participants used the ability to move a column when comparing data. This proved to be very helpful with task 3.5 (Appendix ) where participants were asked to compare data between columns that were separated by nine columns of data. This ability did cause an error by at least one participant who moved the column that was, of the two columns being compared, originally on the right hand side of the screen, to the left hand side of the comparison column, and began comparing the incorrect columns with each other, therefore causing an error in response. Even though participants were told during instruction on use of the Table Browser that there was not a parallel ability to move rows, some participants did want to do this. To make up for the lack of doing this, some participants attempted to delete rows. Unfortunately this functionality did not work properly in the Table Browser so this did not always work as desired; data either being not deleted when the participant tried to delete it, or data that was not selected for deletion getting deleted because of a problem with the program.
While this function was useful to users, it did pose problems when users went back to the tables that had an altered view and tried to complete a task without closing the table and reopening it with the information in its original arrangement and content.
User Preferences as measured through the Post Tasks Survey
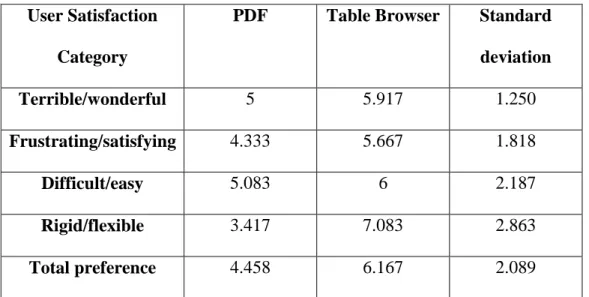
Table 3 - User Satisfaction Ratings
User Satisfaction
Category
PDF Table Browser Standard
deviation
Terrible/wonderful 5 5.917 1.250
Frustrating/satisfying 4.333 5.667 1.818
Difficult/easy 5.083 6 2.187
Rigid/flexible 3.417 7.083 2.863
Total preference 4.458 6.167 2.089
Average ratings based on a scale of 1 through 9, 1 relating to the negative rating as displayed on the left of the two adjectives acting a row headings, 9 being the positive score, or the right of the two options.
User comments
Comments about the Table Browser included: (Italicized words inside parenthesis are inserts made by the author.)
• "They're both good but … I like the (the) Table Browser's capacity to isolate information."
• "I was more comfortable at first with the PDF, but I would prefer to use (the) Table Browser in the long run."
• The "Table Browser gave you capabilities to move columns and rows… (the) PDF liiked nicer on the page, but … you couldn't manipulate the rows or columns."
programs for a long period of time, I would probably invest the small amount of time it would take to learn the Table Browser format."
• "I think the Table Browser has a lot of potential - My ratings of it would be higher (most likely) if I were more familiar with it (i.e. this were not the 1st time I'd seen it)."
• "PDF appears as a paper document but is not as easy to use. Table Browser is more flexible and seems more suitable to the computer environment."
• "With PDF tables it's difficult to keep place after you scroll. You have to be aware fo the row counts to get accurate info. The Table Browser has 'permanent labels' (for columns) that don't disappear after scrolling."
• "Easy to locate the cell which contains the info I need. Brief description helps to get a big picture. Functions can make computation process easier."
• "The format and features are common to a lot of currently used software so I could adapt to the system quickly (if used regularly)."
• "It was easier for me to use the PDF files because I am used to using the statistical Abstract - The PDF files look the same as the page."
• Would like browser to sort by row.
• Would like to be able to copy and paste data.
Overall, participant thought the table browser had a lot of potential and would have given higher preference ratings if there were higher familiarity.
• The PDF appeared to look very similar to a paper document but it was not as easy to use.
Overall, participants felt that the simplicity of the PDF tables was preferred because it was easier and quicker. If participant needed to use these tables for a long period of time, he/she "would probably invest the small amount of time it would take to learn the Table Browser format." Familiarity was also a commented on factor. One participant said that the Table Browser format did have some similarities in functionalities and look so that it was possible to use more easily because of this, while another participant said that the format of the PDF tables was easy to use because of the similarity to the paper based statistical abstracts. The appearance of simplicity offered by the PDF format was attractive to participants, but the possibilities of the Table Browser appealed to users if they felt that the tools would help them in tasks, but only if they had to spend either a lot of time or effort on those tasks.
Conclusion
The Table Browser formatting of statistical data allows users to have more control over the way they see their data organized than the PDF format. While this is helpful to users, there are changes that could be made to the Table Browser that would increase its usability.
Recommendations
difficulties with the delete option including both a lack of deleting the selected columns or rows as well as data that has not been selected getting deleted, or problems with the highlighting of rows or columns, either not highlighting the selected row, column, or grouping, or not un-highlighting as appropriate. Beyond fixing the bugs in the program, the following recommendations are made.
• The meta-context table should open with the title of each table showing rather than the information from the "bottom" of the file.
• Making column and row headings differentiated from other text, such as bolding or making a larger size font.
• Distinguish between parent groupings and child groupings (i.e. Totals columns and columns split by gender and/or age.) This is done very clearly in the PDF files where the “child” groups are indented and the “parent” group is a different color. In the Table Browser, using a background color change to indicate relationships in the data might prove to be helpful.
• Maximum function should find the maximum, and then the next highest value, and so on. This functionality, along with the Minimum and Average
functionalities should be extended to work with rows as well as with columns. Ideally a user should be able to make a selection of any group of cells and use one of these tools with just that selection.
• Resizing functions (zooming functions)
to look for further information in the same table, they are reminded that the current table view has been altered.
• Instead of a delete function, call the same function "hide" in order to get across to the user that they are not permanently changing the data.
• Further basic manipulation tools such as the ability to find the difference between data in one column with data in another column.
• Error messages when using the New Table and Sub-Table tools were difficult for users to interpret.
• Instructions in writing on how to use the New Table and the Sub-Table tools would make these more accessible to new users. Also possibly changing the name of the Sub-Table tool to give users the idea that they can extract information for viewing, such as “Extract Selected Data” could give participants the idea that this tool can pull out just the information that they are interested in looking at.
Bibliography
Allen, B. L. (1996). Information Tasks: Toward a User-Centered Approach to
Information Systems. San Diego: Academic Press, 163.
Dickson, G.W., DeSanctis, G., & McBride, D. J. (1986) Understanding the effectiveness of computer graphics for decision support: A cumulative experimental approach.
Communications of the ACM vol. 29, num.1, 40-47.
Dillon, A. (1994). Designing usable electronic text: Ergonomic aspects of human
information usage. London: Taylor and Francis.
Gillan, D. J. (1994). A componential model of human interaction with graphs: 1. Linear regression modeling. Human Factors, 36(3), 419-440.
Goh, S. K., & Coury, B. G., (1994). Incorporating the effect of display formats in cognitive modeling. Ergonomics, 37(4), 725-745.
Hert, C. A. & Marchionini, G. (1998) Information seeking behavior on statistical websites: Theoretical and design implications. Proceedings of the American Society for
Information Science Annual Meeting (Pittsburgh, PA, Oct 25-29, 1998) 303-314.
Hix, D., & Hartson, H. R. (1993). Developing User Interfaces: Ensuring Usability Through Product & Process. New York: Wiley.
Hyland & Gould (1998) External statistical data: Understanding users and improving access. International Journal of Human-Computer Interaction vol. 10, num. 1, 71-83. Marchionini, G., Hert, C., Liddy, L., & Schneiderman, B. Extending understanding of federal statistics in tables (to appear in Conference on Universal Usability with Carol Hert, Liz Liddy, and Ben Schneiderman). http://www.ils.unc.edu/~march/CUU/tables.pdf
Norman, D. A. (1988). The psychology of everyday things. New York: Basic Books. Robbin, A. & Frost-Kumpf, L. (1997) Extending theory for user-centered information services: Diagnosing and learning from error in complex statistical data. Journal of the
American Society for Information Science vol. 48, num. 2, 96-121.
Appendix A - Tasks
Task level 1:
These are simple find tasks:
1.1 - In 1996, how many more years was a 50 year old woman expected to live? 1.2 - What was the resident population of males in 1940?
1.3 - In 1997 what was the resident population of all females?
1.4 - In 1988 what was the resident population of the 15-19 years age group? 1.5 - What was the population of Utah (UT) in 1994?
1.6 - What was the population of Dallas in 1990? Task level 2:
This task is designed to require the user to perform a calculation:
2.1 - In 1996, what was the difference in life expectancy between 30 year old white males and 30 year old white females?
Understanding information available in the tables:
2.2 - In what year do population statistics on race, beyond Black and White, begin to be taken by the census?
These tasks are designed to require the user to perform a calculation:
2.3 - By how much did the population of Iowa(IA) go up between 1970 and 1997? 2.4 - In 1997, how many more males than females are there in the resident
population under 5 years of age?
The task is to compare information from two different columns that are separated by nine columns:
2.5 - Compared to the population information from 1997, which two states or districts have decreased in population size since 1970?
This task is designed to require the user to perform a calculation:
Task level 3:
These are trend analysis tasks:
3.1 - Across all groups, what happens to the difference in life expectancy between males and females as people age?
3.2 - What happened to the difference in age expectancy of males and females between 1900 and 1996?
This task is designed to have the user determine trend differences over time:
3.3 - Between 1850 and 1950, what change occurred in the population distribution between males and females?
This task is to see trend differences in the data:
3.4 - For the following task, please look at table 14 and the data for the population statistics at five year increments only (this excludes the totals column as well as the last five columns in the table). For both 1980 and 1990 find the age groups that have the largest populations. Which age group or groups are these? Please explain any consistencies or inconsistencies with your finding.
The task is to see themes and/or trend analysis in the data:
3.5 - Previously you were asked to determine which two states (DC and NY) had a population decrease from 1970 to 1997. Which of these states shows an inconsistent pattern in its population decrease between 1970 and 1997?
This task is designed to have the user analyze the available data in the table:
Appendix B - Consent Form for Table Browser Interfaces: Usability Study
Purpose of this Study
We are inviting you to take part in a research study of Table Browser interfaces. This study will test the usability of Table Browser interfaces. The study is being conducted by Laura Chessman, a student in the School of Information and Library Science, as Master's project in conjunction with Dr. Gary Marchionini.
What Will Happen During the Study
As a participant you will be asked questions regarding your experience with statistics and searching for statistical information in an electronic environment. After this you will be asked to complete a series of information finding and question answering tasks. To accomplish this you will be presented with two different presentation formats, both being on a computer screen. You will only be presented with one format at a time and will have access to only one format for each question. Once you have completed that tasks, the investigator will ask you a few more brief questions regarding your experience with the tasks.
Your Privacy is Important
We will make every effort to protect your privacy. Any information obtained in the study will be recorded with a participant number, not your name. Since we will be making efforts to protect your privacy, we ask you to agree that we may use any information we get from this research study in any way we think is best for publication or education. If you have any questions regarding this study, please contact Dr. Gary Marchionini (966-3611, [email protected]).
Risks and Discomforts
Your Rights
You will be paid $15 for your participation in the usability study which should last approximately 1 hour. You are free to refuse to participate or to withdraw from the study at any time without penalty and without jeopardy. You will be paid for the time you have completed.
Institutional Review Board Approval
The Academic Affairs Institutional Review Board (AA-IRB) of the University of North Carolina at Chapel Hill has approved this study. If you have any concerns about your rights in this study you may contact the Chair of the AA-IRB:
David A. Eckerman, Chair CB# 4100, 201 Bynum Hall UNC-CH
Chapel Hill, NC 27599-4100 962-7761
I have had the chance to ask any questions I have about this study, and they have been answered for me.
I have read the information in this consent form, and I agree to be in the study. I understand I will get a copy of this consent form after I sign it.
___________________________________ ________________________
Appendix C - Pre-Test Demographic Questionnaire
Your answers to the following questions will help the study researchers to analyze the test results.
Participant ID ____________
Age ____ Gender Male _____
Female _____
To control for different levels of computer/software and statistical literacy, please help us with the following information:
1. How often do you use a computer?
Never Occasionally Monthly Weekly Daily 2. What application do you use? (please check all that apply)
Email Word Processing Web Surfing Games Database Multimedia Programming
3. Have you ever taken a statistical course? Yes No
If yes, when did you take it, choose all that apply:
High School College Graduate Study Professional Training 4. Please select any statistical software package(s) you have used:
We’d like to know how often you use statistical tables. Please check the response that best represents your experience.
5. Please tell us the how many times you have used the following tables (including both paper and electronic formats) :
Stock market tables/listings
None 1 - 5 6 – 15 >15 Time schedule tables (e.g. bus, airline, class schedule)
None 1 - 5 6 – 15 >15 Consumer information tables (e.g. cost comparaison tables)
None 1 - 5 6 – 15 >15 Nutritional labels (e.g. cereal box)
None 1 - 5 6 – 15 >15 Research results in articles
None 1 - 5 6 – 15 >15 Government statistics on the Web (e.g. health, demographic tables)
None 1 - 5 6 – 15 >15 Tax tables
None 1 - 5 6 – 15 >15 6. Have you used Fedstats (www.fedstats.gov)?
Yes No
7. How often have you used data in tables from government Web sites? Never Occasionally Monthly Weekly Daily 8. How often have you used statistical tables on the Web?
Appendix D - Post-Tasks Survey
1. Please circle the numbers which most appropriately reflect your impressions about using the PDF tables. Not Applicable = NA. a. Overall reactions to the PDF tables: terrible wonderful
1 2 3 4 5 6 7 8 9 NA
b. frustrating satisfying
1 2 3 4 5 6 7 8 9 NA
c. difficult easy
1 2 3 4 5 6 7 8 9 NA
d. rigid flexible
1 2 3 4 5 6 7 8 9 NA
2. Please circle the numbers which most appropriately reflect your impressions about using the Table Browser.
Not Applicable = NA. a. Overall reactions to the Table Browser terrible wonderful
1 2 3 4 5 6 7 8 9 NA
b. frustrating satisfying
1 2 3 4 5 6 7 8 9 NA
c. difficult easy
1 2 3 4 5 6 7 8 9 NA
d. rigid flexible
1 2 3 4 5 6 7 8 9 NA
Which presentation format did you prefer to use, PDF or Table Browser?
Please write your comments about the tables here: