ABSTRACT
TIMOTHY J. MUKODA. A Feasibility Study for the Detection of Airborne
Legionella pneumophila Using the Polymerase Chain Reaction, (Under The
Direction of Dr. LORI A. TODD)
Current methods to sample and analyze bioaerosols require that
organism viability and culturability be maintained. This can lead to an
underestimation of airborne bacterial concentrations when the sampling method has inherent qualities which damage or kill fragile microbes.
The polymerase chain reaction (PCR) and associated ajialytical techniques
require only intact cellular DNA to identify organisms contained in asample; thus eliminating the requirement to maintain viability and
culturability. This investigation has shown it is feasible to capture airborne Legionella pneumophila using either an AGI-30 impinger or a polycarbonate membrane filter, and identify and quantify the organism using PCR coupled with reverse dot-blot hybridization analysis ajid/or gel electrophoresis. In addition, the comparison of plate counts with acridine orange direct counts (AODCs), underscored the fact that tradi¬
TABLE OF CONTENTS
List of Figures, Equations, and Tables ... i
List of Appendices... ii
Introduction ... 1
Background
The Polymerase Chain Reaction ... 6
Materials and Methods
Target Organism ... 13
Bacterial Growth and Count Determination... 14
Chamber Design and Bacterial Aerosoliaztion... 14
Sampling Methods and Protocol ... 17
Detection of Legionella pneumophila by PCR... 17
Sample Preparaton for Bacteril Count
and PCR Analysis... 18
Analysis by Reverse Dot-blot Hybridization ... 18
Analysis by Gel Electrophoresis... 19
Results
Detection and Quantification using PCR... 22
Detection and Quantification by Plate Count and AODC... 23
Comparison of Count and Reverse Dot-blot Results... 28
Discussion ... 29
List of Figures, Equations, and Tables
Figure 1. Segment of Target DNA Prior to Cycle 1 ... 6
Figure 2. Hydrogen Bonds Broken in Target DNA
During Denaturation in Cycle 1 ... 8
Figure 3. Primers Annealing to Denatured Target
DNA in Cycle 1 ... 8
Figure 4. Extension of Target DNA and Formation of
Long Product in Cycle 1... 9
Figure 5. Denaturation of Long Product in Cycle 2 ... 10
Figure 6. Annealing of Primers to Denatured Long
Product in Cycle 2... 10
Figure 7. Extension and Formation of Long and Short
PCR Product in Cycle 2 ... 12
Equation 1... 14
Figure 8. Experimental Set-up ... 15
Table 1. Estimates of Bacterial Concentration in the
Nebulizer Solution for Plate Count and AODC ... 16
Figure 9. Interpretation of Reverse Dot-blot
Hybridization Detection Strips ... 20
Table 2. Results of Gel Electrophoresis and Reverse
Dot-blot Hybridization Analysis ... 22
Figure 10. Mean Bacterial Concentrations per mlEstimated by Plate Count ... 24
Figure 11. Mean Bacterial Concentrations per mlEstimated by AODC ... 25
Figure 12. Ratios of AODC to Plate Count Results,Mean Bacterial Recovery per Trial ... 26
Figure 13. Ratios of AODC to Plate Count Resultsfor Bacterial Stock... 27
Table 3. Comparison of Plate Count, AODC, and
Reverse Dot-blot Hybridization EstimatesList of Appendices Appendix I. Appendix II. Appendix III. Appendix IV. Appendix V. Appendix VI. Appendix VII. Appendix VIII. Appendix IX. Appendix X. Appendix XI. Appendix XII. Appendix XIII. Appendix XIV. Appendix XV. Appendix XVI. Appendix XVII. Appendix XVIII. Appendix XIX. Appendix XX. Appendix XXI.
Protocol for Preparing Yeast Extract Broth... 36
Protocol for Preparing Charcoal Yeast Extract Plating Agar ... 37
Protocol for the AODC Epifluorescence Microscopic Method... 38
Stock Culture Bacterial Concentration Determined by Plate Count and AODC ... 40
Summary of High Volume Pump Calibration Data ... 41
Summary of Sampling Parameters ... 42
Equipment List... 43
Sequence of gene, primer, and Primer Binding Sites for the 5S rRNA gene of L. pneumophila ... 44
Sequence of gene, primer, and Primer Binding Sites for mip gene of L. pneumophila... 37
Summary of Plate Count and AODC Data Determined by Air Sampling... 46
Protocol for preparation of L. pneumophila air samples for PCR amplification ... 47
Protocol for preparing Legionella PCR Reaction Tubes ... 48
Protocol for PCR Amplification of L. pneumophila air samples ... 49
DNA Thermal Cycler Program ... 50
Sequences of Probes for the Legionella 5S rRNA gene and the L. pneumophila mip gene ... 51
Protocol for preparing buffers for reverse dot-blot analysis... 52
Protocol for reverse dot-blot analysis ... 54
Protocol for color development procedure ... 56
Protocol for preparing gel electrophoresis buffers ... 57
Protocol for preparing DNA marker and PCR product for analysis be gel electrophoresis ... 58
Introduction
The term "Sick Building Syndrome" (SBS) has been used to describe
a phenomenon related to indoor air quality that is characterized by
symptoms including runny nose, eye and sinus irritation, sore throat,
headache, fatigue, and dizziness. Complaints related to SBS usually
originate in buildings that were designed to be energy-efficient and
have climate control systems and permanently sealed windows. Many
different indoor air pollutants have been implicated as causes of SBSincluding volatile organic compounds, combustion products, and
bioaero-sols. (13) In many instances, it has been difficult to link specific
pollutants to the complaints; this is in part due to the fact that
concentrations are usually orders of magnitude below documented adversehealth effects and occupational exposure limits. For a given SBS
episode, identification of a specific cause is complicated by the pres¬
ence of many pollutants at very low concentrations in air.
In particular, specific bioaerosols can be difficult to identify
and link to symptoms. Bioaerosols are known to elicit a variety of
acute and chronic adverse health effects at low concentrations, they are
always present in ambient air, and there are no widely accepted methods
for detecting and quantifying low concentrations that may be contribut¬
ing to SBS complaints. Bioaerosols, defined as vegetative microbial
cells with reproductive units and metabolites that can be dispersed in
air, include bacteria, viruses, fungi, algae and protozoa. (13) Bio¬
or as infectious agents causing disease in the affected individual. (13) Indoors, there may be an even greater risk of infection as a result of reduced dilution by air or inadequate ventilation, which increases the concentration of bioaerosols. (23) Factors such as crowding and degree of activity in an indoor environment may also con¬ tribute to levels of airborne bacteria , and any subsequent infectious risk. (26) An excess of airborne microbes, including bacteria, can
have either little to no adverse health effect or a marked increase in
adverse health effect. In the case of an innocuous bacterium, such as a member of the genus Micrococcus, increased airborne concentrations would not cause building occupants to suffer adverse health effects. However, when a bacterium is an agent of infectious disease, an airborne presence can have a markedly different effect. This can occur when bacteria normally found in air are present in excess, or when infectious bacte¬ ria, not normally present, are found in air. This would be the case for Legionella pneumophila (L. pneumophila).
Airborne bacteria usually exist in droplets of respirable size as
droplet nuclei. (39) It is extremely rare that they exist naturally as
an aerosol of single cells; it is more likely they exist as aggregates
of individual cells. (32) In many cases aerosols containing bacteria
originate from liquid splashes or sprays, agitation of dusts, or coughs
and sneezes. (27) Individual biological particles usually range in size from 1.0 to 50 microns. (21) Therefore, in most cases a droplet must have an aerodynamic diameter of at least 1.0 micron to contain an indi¬ vidual bacterium. (23)
mental reservoir that contains adequate moisture. (13) Therefore, any appliance or mechanical system with a water reservoir or drip pan is a potential source for microbial growth. (13) Devices such as humidifi¬ ers or vaporizers are especially problematic since they actively spray water droplets into the air, some of which may contain microorganisms. Any disruption of such a microbe-rich environment can cause the organ¬ isms to become airborne. In most cases, they will only survive a short time in the airborne state; however, many are opportunistic and, in some instances, parasitic, requiring a host organism for growth and reproduction. (13) Therefore, those microorganisms which are inhaled by a living host and are of respirable size stand some chance of sur¬ vival. An inhaled dose of an aerosol, which is a non-infectious type or quantity, can be neutralized by the host organism's intrinsic defense mechanisms. However, if the dose exceeds an infectious level, and the defense mechanisms are overwhelmed, disease may result. It has proven difficult to determine precise levels at which disease results from exposure to an airborne agent. This underscores the need to develop techniques to sample and detect bioaerosols at the lowest possible detection limits.
The ubiquitous nature of bioaerosol, and the fact that there are no official exposure limits such as Threshold Limit Values (TLVs),
microbes in air. In addition, traditional bioaerosol sampling and analyses methods are not always sensitive enough to detect and quantify the low-levels of microorganisms in air that may be contributing to SBS related complaints.
At present, there are no direct-reading instruments to detect or measure airborne microorganisms, and few standardized integrated sam¬ pling methods. (15) Current sampling methods involve collecting organ¬
isms in a liquid medium or onto solid or semi-solid media (2) and
culturing the cells to achieve observable numbers. If collected cells are not culturable, there can be significant underestimation of airborne microbial concentrations, or false negative results. The reliance on viable, culturable cells, dictates that collection and plating tech¬ niques result in minimal cell damage. (15) Obtaining accurate counts
of organisms which can be cultured by plating may be complicated by a)
specialized growth requirements of an organism which are absent in the culture media, b) metabolic byproducts formed by one organism which serve as growth inhibitors to another organism being cultured on the same plate, or c) contact suppression by adjacent growth points in neighboring colonies preventing further colony development. (31) An underlying assumption of quantifying viable, culturable organisms, is that non-culturable, viable or non-viable organisms do not cause dis¬ ease; for many organisms this assumption is false. Viability, not culturability, is the measure of infectious potential for a bacterium such as L, pneumophila.
new bioaerosol analysis method that may provide the ability to accurate¬
ly quantify microorganisms at much lower levels of detection than is
possible by current techniques. This technique, which is a major depar¬
ture from current methods, uses deoxyribonucleic acid (DNA) sequences
ajnplified by the polymerase chain reaction (PCR), and subsequent nucleic
acid hybridization with DNA probes, to identify and quantify target
microorganisms. PCR used with probe hybridization could provide an
analytical option for use with current bioaerosol sampling methods. In
theory, under optimum conditions of sampling and analysis, intact DNA
from only a single organism could provide a template for DNA amplifica¬
tion. PCR has been used extensively as a research tool for the identi¬
fication of microorganisms from environmental water samples.
(5,6,7,8,9,10,11,40) This is the first report investigating the fea¬
sibility of adapting PCR to microbial cells captured from air.
For this study, L. pneumophila was selected as the target organ¬
ism, and three different airborne concentrations of I. pneumophila were
generated using a Collison 3-jet nebulizer in an airtight chamber.
Chamber air samples were collected at each concentration using AGI-30
impingers and membrane filters. These methods were selected in the hope
they would not interfere with subsequent PCR amplification. Samples
were analyzed by PCR, and amplification was determined to be successful
using gel electrophoresis and reverse dot-blot hybridization. The
samples were also analyzed for culturable colony forming units (CFU) by
the plate count method, and for total microbial counts using the
acrid-ine orange direct count (AODC) method. Results obtaacrid-ined by these ana¬
Background
The Polymerase Chain Reaction
The Polymerase Chain Reaction, developed in 1987, is a procedure
used to rapidly amplify specific DNA sequences. PCR mimics the natural DNA replication process to produce accurate copies of DNA sequences from single-stranded template DNA. (33) Assuming 100% efficiency, a succes¬
sion of repetitive PCR cycles generates an exponential increase of a particular DNA sequence, with twenty cycles potentially yielding an
approximate million-fold amplification of a given sequence. (4)
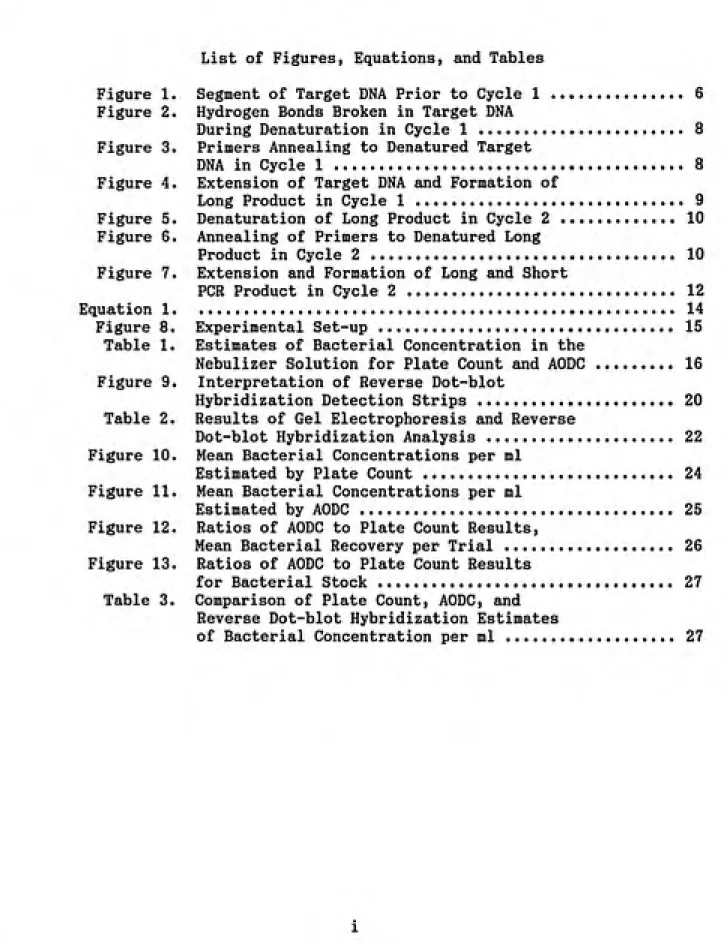
To use PCR, sequence information must be identified for a specific
target DNA segment, see Figure 1. (3) For amplification to be
effec-5'tttttttttttttttttttt 3'
--- <--- Hydrogen Bonds
3'I I I I I I I I I I I I I I I I I I I I 5»
Target DNA
Figure 1. Segment of Target DNA Prior to PCR Cycle 1
sequence of interest is between 100 to 500 base pairs (bp) in length.
(29,37)
Once an appropriate DNA sequence has been identified, primers must
be generated that are specific to the sequence of interest. Primers are
oligonucleotides or short, single-stranded chains, made up of some
combination of nucleotides (adenine, thymine, cytosine or guanine).
They attach to a single-stranded DNA segment and provide a free 3' end
to initiate the addition of nucleotides. The sequence of a particular
primer is determined by the sequence of the DNA template at the bounda¬
ries of the region to be amplified. (33) The primers attach to comple¬
mentary sites on the DNA template immediately flanking the sequence on
which amplification is desired.
FOR consists of three steps, denaturation, annealing and exten¬
sion, that are collectively known as a cycle. A typical PCR mix con¬
tains: a) target DNA, the template identified for amplification; b)
extension primers which attach to sites flanking the target DNA se¬
quence; c) DNA polymerase, an enzyme which performs the copying process;
d) magnesium chloride which enhances the reaction; and e) an overlay of
mineral oil which prevents evaporation of the reaction mix. (19) PCR
is performed in an automated thermal cycler because rapid temperature
changes are necessary at each step in a PCR cycle.
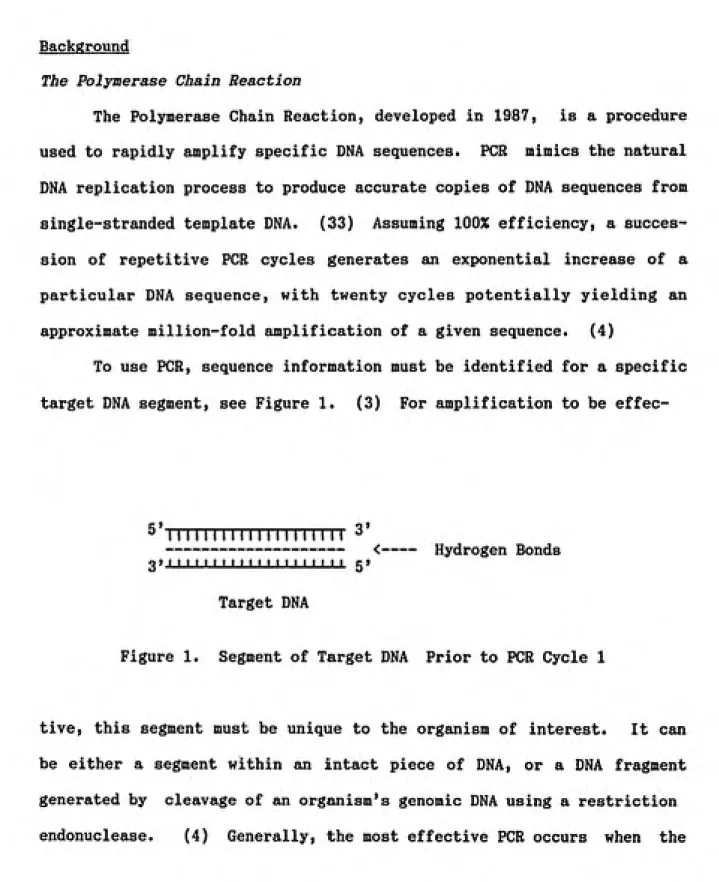
Denaturation, the first cycle step (Figure 2) involves high tem¬
perature incubation of double-stranded sample DNA, typically at 95° C.
(33) The high temperature causes the hydrogen bonds between the indi¬
vidual DNA strands to break, creating separate, single strands of DNA,
Template 1
^'llltllllllllllilllll 3'
3> 11 11 11 11 I 111 1111 I > I I 5» Template 2
Figure 2. Hydrogen Bonds Broken in Target DNA
During Denaturation in Cycle 1
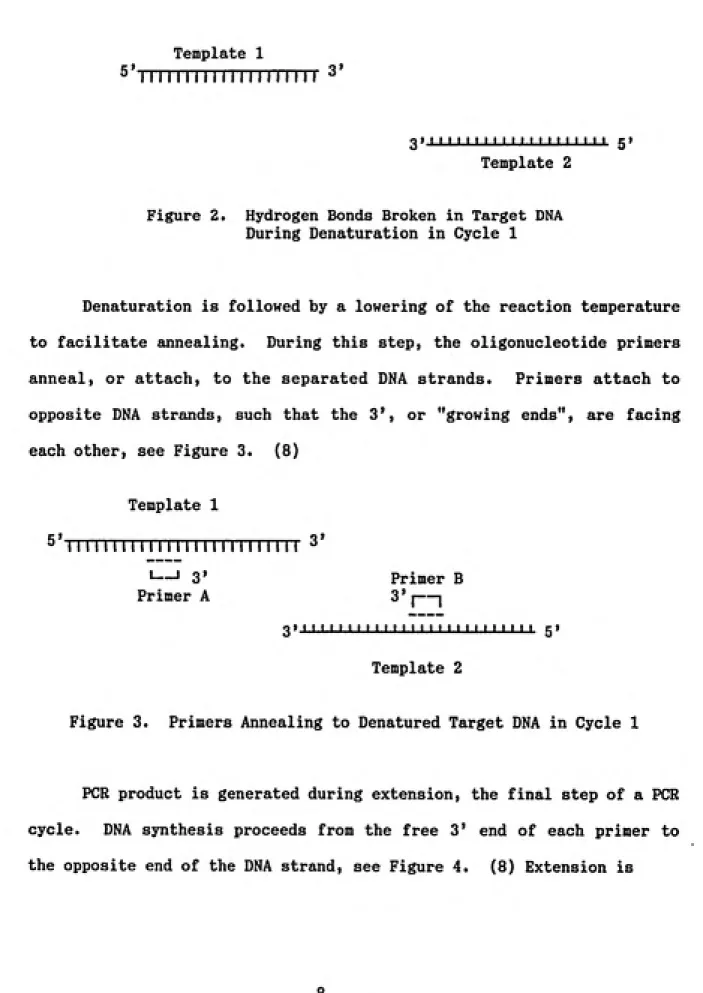
Denaturation is followed by a lowering of the reaction temperature
to facilitate annealing. During this step, the oligonucleotide primers
anneal, or attach, to the separated DNA strands. Primers attach to
opposite DNA strands, such that the 3', or "growing ends", are facing
each other, see Figure 3. (8)
Template 1
^'iMIIIIIIIIIIIIIIIIIIIIIII ^'
•—J 3' Primer B
Primer A 3' |—|
3»' I ' ' I »' ͣ »' I ͣ I ͣ ͣͣI'I I''I ͣ t I 5' Template 2
Figure 3. Primers Annealing to Denatured Target DNA in Cycle 1
PCR product is generated during extension, the final step of a PCR
cycle. DNA synthesis proceeds from the free 3' end of each primer to
Template 1
^'llllllllllllllllllllllllll 3'
I____J I I 11 I I I I I I I I
Primer A
Primer B TTTTTTTTTTTTrn
3> I 11 I' I '' '' I '' ' ' ''' ' '...I' 5> Template 2
Figure 4. Extension of Target DNA and Formation of Long Product
in Cycle 1catalyzed by Tag DNA polymerase, an enzyme which initiates the copying
process and sequentially adds individual nucleotides at the free 3' end
of the primer/template complex. In Cycle 1, only long product is gener¬
ated. This is double-stranded DNA which is made up of one complete and
one shortened DNA template.
Denaturation of the double-stranded DNA formed in Cycle 1 creates
two shortened single-stranded templates (Templates 3 and 4) having
primer at one end, as well as complete single-strands of DNA (Templates
Template 1
^'lltltillllllllllllllllllt 3'
Template 4 Primer B III III 11111 rn
L___I '...'II'
Primer A Template 3
3M I I I I ' I 'I ''ͣ''ͣ' I 'ͣ''ͣ'' ' 5»
Template 2
Figure 5. Denaturation of Long Product in Cycle 2
When annealing occurs in Cycle 2, primers bind to both the intact
single strands of DNA and the abbreviated template strands, see Figure
6.
Template 1
5'-TT T7TT 3'
L—J 3' Primer A
Template 4
Primer B
I 111 M1111111 rn
I—I 3»
Primer A
Primer B
3' rn
L____I I I I I 'I I I ' I ' 5»
Primer A
Template 3
Primer B
3» I I I I I 1 I I I I I I I I I I I I I I I I I M I I 51
Template 2
During extension in Cycle 2, long product is again formed, but in
addition, short product is generated. In forming short product, DNA
synthesis is initiated at the free 3' sites and terminates at the primer
sites, see Figure 7. Short product is comprised of the lengths of the 2
primers plus the distance of the target DNA between the them. (20) This
length is known as the target sequence. (14) Throughout the
ajnplifica-tion process the quantity of original template remains constant because
long product increases arithmetically, as opposed to exponentially.
(33) In theory, following denaturation and reannealing in successive
PCR cycles, all denatured strands of short product are available to
act as substrates for further DNA synthesis. (41) Ideally, the amount
of short product will double after every cycle leading to an exponential
accumulation, so short product will be overwhelmingly abundant in com¬
parison to long product. The PCR product can be analyzed using gel
electrophoresis and/or nucleic acid probe hybridization to determine if
the DNA target sequence was present in the sample and successfully
amplified.
5'
long product Template 1
MIIMIIIMIIIIIIIItllill 3'
L____...I I I I I I
Primer A
short product
Template 4
Primer B
M I III 11 I 11 r~i
L___J I I I I I M t I I I
Primer A
Primer B 11111111111 rn
L___' ͣ ' '...
Primer A
Template 3 short product
Primer B
11111111111 r~\
3» ' I ' » I I ' ' ͣ ' ͣ I ͣ ' ' ' ' ͣ ' ͣͣͣ ' Iͣ 5»
Template 2 long product
Figure 7. Extension and Formation of Long and Short PCR Product
Materials and Methods
Target Organism
L. pneumophila was selected for this study because it is both an
important agent of human disease and inhalation of contaminated aerosols
is the suspected route of infectivity for this organism. (25) Legio¬
nella species are ubiquitous in all aqueous environments, including
potable water supplies, and have been positively identified as the
causative agent of Legionellosis, a respiratory disease afflicting
humans. Several species of Legionella have been identified as causing
respiratory disease, but approximately 85% of all documented cases are
attributed to L. pneumophila, (30) The assumption that inhalation of
aerosols generated from contaminated water is the route of transmission
is based upon particle size analysis performed on aerosols containing
Legionella, which have clearly shown the bacteria are contained in
droplets of respirable size (16,24), and epidemiological studies that
have associated presence of contaminated aerosols with outbreaks of
disease. (17) The EnviroAmp*'" Legionella Sample Preparation, PCR Am¬
plification and PCR Detection Kits were developed to detect Legionella
directly from water, the environmental source of contamination. L.
pneumophila was a natural choice for this investigation because of its
airborne route of transmission and the existence of a kit to detect its
Bacterial Growth and Count Determination
A freeze dried culture of L. pneumophila, subsp. pneumophila was
obtained from American Type Culture Collection. A yeast extract broth
(YEB) medium was used to rehydrate and grow the bacteria, as described
in Appendix I. Approximately forty hours were allowed for exponential
cell growth, after which time serial dilutions of stock culture were
used to determine the number of colony forming units (CFU) and total
organisms per milliliter of broth by plating (Appendix II) and AODC
analysis (Appendix III) (28), respectively. Each serial dilution was
plated on charcoal yeast extract (CYE) agar. 5.0ul aliquots at each
dilution were plated and the cultures were incubated at 35° C and 2.5%
CO2. (38) Growth was allowed to proceed for 1 to 3 days, after which
time CFU counts were made and CFU per ml quantities were estimated using
equation 1:
Equation 1.
(CFU) (1 X 10^ ul)
CFUX --- X
(5.0ul) ml dilution
ͣ
!
factor
CFU and total organism per ml bacterial stock count results are located
in Appendix IV.
Chamber Design and Aerosolization
Aerosolization experiments were performed in a plexiglass glovebox
with an interior volume of approximately 253 liters, see Figure 8. Air
entering and exiting the glovebox passed through HEPA filters with a
Exit to LEU Ssftstem
T
Exhaust
HEFO Filter
Supply HEPA Filtei>
m
nxxing FanSxde
Entry
AGI-3B
Impinger
0
Nebulizer
ttenbrane
Filter
Line to Pressure Gauge and Air Supply
High Uolune
Sanpling Punp
Figure 8. Experimental Set-up
HEPA filter was connected to an existing local exhaust ventilation (LEV)
system operated at a flow rate of approximately 100 cubic feet per min¬
ute. Prior to each sampling period the glovebox was purged for 10
minutes (approximately 10 air changes) using the LEV system to provide a
clean sampling environment. To provide adequate mixing of the air a
small fan was mounted to the top of the glovebox. Two side portals
with removable covers provided «iccess to the interior of the glovebox.
Aerosols containing L. pneumophila were generated using a Collison 3-jet
nebuli;&er. Air was supplied to the nebulizer at 20.0 psig; at thispressure the nebulizer is reported by the manufacturer to generate
droplets with a mass median diameter of 2.0 um and liquid at a rate of
9.0 ml/hour. (12) Dilutions for aerosolization were prepared by mixing
varying amounts of stock culture with distilled water; three trials were
conducted, each at a different dilution. The nebulizer was run for 15
minutes prior to each sampling period. Table 1 lists bacterial concen¬ tration per ml in the nebulizer solution for trials 1, 2, and 3, asestimated by plate count and AODC.
Trial
Bacterial Stock Vofcjme
(ml)
Diluert Vnfcjme
(ml)
Banterial Corcsntr?*ion
by PlatB Court
(CFUperml)
Bacterial 1 CoTcentration
by AODC
(or^isms per ml)
ͣ
1 10ml 10ml 3.38 E+08 2.90 E+09
2 5 ml 15ml 1.88E+08 1.45E+09
3 2.5 ml 17.5 ml 9.69 E +07
6.75 E+08 1
Table 1. Estimates of Bacterial Concentration in the NebulizerSampling Methods and Protocol
Chamber air samples of L. pneumophila were captured into AGI-30 impingers and onto Costar polycarbonate, 47mm diameter, 0.45um pore
size membrane filters. AGI-30 impingers were used since they serve as
reference samplers in the development and testing of new bioaerosol samplers. (2) Each impinger contained 50 ml of distilled water as the capture medium. Polycarbonate filters were selected because their smooth filter surface should maximize release of the bacteria into solution following collection. The filters were held in place during
sampling by a 47mm diameter, open-faced filter holder.
Air was drawn into the impinger or across the filter face at a
target flow rate of 12 1pm using a high-volume air sampling pump. The pump was calibrated using a Gilabrator ; calibration data are listed in Appendix V. Calibration was performed prior to and following each sampling period. Each sampler was run for 22 minutes, with duplicate
samples collected for both the impinger and membrane filter at the three
different aerosol concentrations. Following sampling, exposed filters were placed into individual, sterile polypropylene bottles containing 50 ml of distilled water. The bottles were capped and shaken vigorously to release any bacteria trapped on the filter. Sampling parameters are listed in Appendix VI. A detailed listing of equipment used in this
investigation is listed in Appendix VII.
Detection of Legionella pneumophila by PCR
PCR sample preparation, amplification, and detection were accom¬
plished using the three part Perkin-Elmer Cetus EnviroAmp Legionella
PCR Kit. The specificity of the kit is based upon DNA sequences unique to the organism L. pneumophila. The genus Legionella is identified by
amplifying a DNA sequence in the 5S ribosomal RNA (rRNA) gene. (35)
Identification of the species pneumophila is dependent on the presence of a macrophage infectivity Botentiator (mip) gene specific for L. pneumophila. (35) Other species of Legionella contain aiip-like genes,
but the one used in the kit is unique to L. pneumophila. (35) The
specific sequence of the 5S rRNA and mip gene, and their respective primers and, are listed in Appendices VIII and IX.
Sample Preparation for Bacterial Count and PCR Analysis
Sample analysis was performed in a Class II biological safety hood. A 9 ml aliquot was removed from each membrane filter and impinger sample for later analysis by AODC. Serial dilutions of the membrane filter and impinger solutions were plated on BCYE agar. This was done to determine the culturable concentrations in each sample. Each plate
was incubated at 35° C and 2.5% CO2 for 1 to 3 days. The serial dilu¬
tions used were as follows:a. 1 X 10 (undiluted sample)
b. 1 X 10"^ (0.10 ml of sample, 1.0 ml of distilled water)
c. 1 X 10"^ (0.10 ml of dilution a, 1.0 ml distilled water)
Plate count and AODC data are listed in Appendix X. PCR amplification
of prepared samples was performed using the protocols outlined in Appen¬
dices XI, XII, XIII, and XIV.
Analysis by Reverse Dot-blot Hybridization
' '^-lA^Wg.'
quantify PCR products using DNA probes immobilized on a nylon strip.
(35) DNA probes are single-stranded, synthetic oligonucleotides which
are complementary to a portion of the DNA sequence contained within the
PCR product. Double-stranded PCR product was denatured and hybridized
to a specified probe. Sequences for the 5S rRNA and mip probes are
1*111
located in Appendix XV. The primers used in the EnviroAmp Legionella
PCR Kit were chemically marked with Biotin to allow for detection of
the target sequences. (35) The biotinylated PCR products were incu¬
bated with streptavidin-horseradish peroxidase conjugate, washed, and a
substrate for the horseradish-peroxidase was added. (35) A series of
blue dots appearing on the nylon membrane indicated quantity and pres¬
ence/absence of the target organism, see Figure 9. Blue dots appearing
next to the "L" or "p" symbols indicated detection of genus Legionella
and species pneumophila, respectively. The color intensity of the dots
quantified organisms detected per ml of sample fluid at the following
concentrations: a) > 1000 per ml, b) approximately 1000 per ml, and c)
100 < x < 1000 per ml. A blue dot appearing next to the "positive"
symbol indicated that PCR was performed properly, based on an internal
positive control contained in the reaction mix. A blue dot appearing
next to the "negative" symbol indicated PCR had not been performed
properly, or inhibitors to PCR were present in the reaction mix. Re¬
verse dot-blot and color development analysis were performed using the
protocols outlined in Appendices XVI, XVII, and XVIII.
Analysis by Gel Electrophoresis
Gel electrophoresis was used to verify that PCR product was
JLsifimaitllM
£ # JF# - / #
L. Pnuenophila detected at > 1000 organisms per ml
* ii " iii - ' •
L pneunopliila detected at approxinately 1000 organ isns per nl
L. pneunophila detected at > 100 but < 1000 organisms per ml
indeed present, and that the DNA fragments were the correct size. To use this technique, PCR product mixed with loading buffer was pipetted into individual wells in an agarose gel, and a standard molecular weight marker was inoculated into a separate well. The gel was immersed in a buffer solution and electric current was passed through it. DNA, being negatively charged, moved through the gel toward the positive electrode. The distance a fragment traveled was determined by its length, with smaller fragments moving farther than long ones. After a predetermined time, the current was interrupted and the gel was stained with a solu¬ tion containing ethidium bromide. Following repeated washings with distilled water the DNA fragments in the gel remained stained. DNA fragments in the gel fluoresced when viewed under ultraviolet light, and fragments of the desired length were identified by comparing them with the lane containing standard DNA marker. The size of the PCR products for the 5S rRNA and mip gene are 108 and 168 base pairs, respectively.
(35) Gel electrophoresis was performed using the protocols outlined in Appendices XIX, XX, and XXI.
Results
Detection and Quantification using PCR
L. pneumophila was successfully detected and quantified in chamber air samples using AGI-30 impinger and membrane filters. As shown in Table 2, PCR product was positively identified for eleven out of twelve samples by both reverse dot-blot hybridization and gel electrophoresis,
for all three trials.
Trial
Sampling
IWelhod
Gel
Eiectroplnoresis
Result
Hybridization
Analysis
Result
1
impinger
+ +1
l^ilter
+ +1
Impinger
+ +1
loiter
+ +2
Impinger
+ +2
Flter
+ +2
impinger
+ +2 Filter — —
3
Impinger
+ +3
Filtfir
+ +3
Impinger
+ +3 Filter + +
Reverse dot-blot hybridization analysis showed specific detection of organisms in the genus Legionella and species pneumophila for all positive samples. Bands corresponding to the 108 and 168 base pair DNA fragments were visible by gel electrophoresis analysis for all positive samples. There was no consistent relationship observed between the intensity of the band present in the gel and the estimated recovery concentration. The single negative result was expected; during the DNA extraction protocol the filter being used to concentrate the sample became unseated in its holder, resulting in loss of most of the cells.
Detection and Quantification by Plate Count and AODC
L, pneumophila was detected and quantified by both plate count and AODC analysis methods using impingers and membrane filters. Figure 10 is a plot of estimates for the mean bacterial CFU count per ml of sample fluid versus trial number for the impinger and filter results. As the concentration in the chamber decreased from trial 1 to 3, the
mean count decreased.
Figure 11 is a plot of the mean total count estimated by AODC versus trial number for impinger and membrane filter results. In con¬ trast to the CFU count results, there was no consistent relationship
between AODC results and chamber concentration; in fact, trial 2 result¬
ed in the greatest mean recovery by AODC, not trial 1, in which the
highest chamber concentrations were generated.
3000
2500
ͣ
*ͣ
aooo
E
O
a
=) U
1000
500
o L_J_ ____I____
s
Trial
^ AAean Recovery per Trial
2.5
'=1 '
v>
1.5
II
i
2
Trial
^ AAean Recovery per Trial
Figure 11. Mean Bacterial Concentrations per ml Estimated by AODC
As shown in Figures 10 and 11, counts recorded by the plating and AODC analysis methods, respectively, were orders of magnitude different from one another. A ratio of the AODC to plate count results was over a thousand and, as the bacterial concentration in the chamber decreased, the magnitude of the discrepancy between the methods increased, see Figure 12.
I
o <
I
S 10.00
«.c»
I.T2e+04
a-iPE+os
Trial
Figure 12. Ratios of AODC to Plate Count Results, Mean Bacterial Recovery per Trial
Figure 13, a plot of the ratio of AODC to plate count results for each trial, shows only about a two-fold difference between these count¬ ing methods; for the stock solution, as the concentration in the stock decreased, there was no difference in the ratios for the different solutions. One reason for this difference is that some fraction of organisms contained in the stock will always be non-culturable. Differ¬
ences in the ratios of plate count to AODC results before and after aerosolization may indicate losses of viability and culturability oc¬ curred as a result of aerosolization and/or collection.
3
<S> 2.50
aC
U a.00
J
a.
ͣ
a
\.sa
W
M
u 1.00
a O
<
1.P«*00
1.746+00
0.00
Triaf
Figure 13. Ratios of AODC to Plate Count Results Prior
to Aerosolization
Comparison of Bacterial Count and Reverse Dot-Blot Results
A comparison of results obtained by plate count, AODC, and reverse dot-blot hybridization analysis is shown in Table 3.
Trial Sampliriy Method
Bacterial
Coxenlration
byPlaleCoLrt (CFU per ml)
Bacterial
Concentratbn
by AODC (organisms per ml)
Ooncentrattan Estimate
Based on Hybridization Results
(organisms per ml)
1
ImpingBr
1970 2.12 E+06 > 10001 Filtsr %00 1.94E+0e > 1000
1 Impinger 433 2.02 E+06 > 1000
1 Filter S67 1.66E+06 > 1000
2
Implnqer
800 1.19E+06 > 10002
filter
533 2.51 E +06 > 10002 Impinger 800 2.32 E+06 > 1000
2 Filter 767 2.47 E+06 None Detected 3 Irrpinger 133 1.82 E +06 > 1000
3 FiltBr 567 1.23E+06 > 1000
3 lnnph"yer 66 1.73E+06 > 1000
3 Filter 86 1.84E+06 > 1000
Table 3. Comparison of Plate Count, AODC, and Reverse Dot-blot Hybridization Estimates of Bacterial Concentration
per ml
The hybridization and AODC results both estimated counts to be
^^9***^
Discussion
Detection of airborne Legionella pneumophila was accomplished
using a combination of traditional bioaerosol sampling devices, PCR for
amplification of extracted cellular DNA, and gel electrophoresis and
reverse dot-blot hybridization as analytical techniques. Stresses placed on the organisms during aerosolization and collection did not
prevent DNA amplification by PCR or subsequent detection of PCR product
at the airborne concentrations tested.The primary concern in selecting a sampling methodology for use in conjunction with PCR was capture of the target organism while preserving the integrity of the cellular structure and DNA. Organism viability and culturability were secondary considerations because an assumption was made that any organisms captured could have potential viability, and thus could be considered an infectious risk. This investigation showed
that impingement and membrane filtration are capable of recovering L.
pneumophila with its cellular DNA intact and in adequate quantities for
amplification by PCR.The main advantage offered by PCR is extreme specificity, which
gives it potential as a powerful analytical tool for use in air sam¬
pling. (4) This specificity allowed precise positive identification of
L. pneumophila in this study. Even though a single organism was exam¬
ined in this investigation, PCR has no requirement to rigorously purify
IP*., 4ti
as one copy of the target sequence is unbroken in the region of inter¬
est, and the sample does not contain inhibitors to PCR, amplification
should occur. (14) Other benefits of using PCR include its ability to
amplify target DNA at picogram quantities or less (33) and the commer¬
cial availability of automated equipment which can readily synthesizeoligonucleotide primers. (34) A final strength of PCR is that it can
be fully automated, and 30 cycles of PCR can usually be completed in just a few hours, making it possible to perform sample collection, preparation, and analysis in a single day. This provides an advantage over analysis by plating, which usually take 24 hours or more for ade¬quate incubation of samples.
The extreme sensitivity of PCR proves to be a drawback; contami¬ nation of samples with minute quantities of DNA can lead to false posi¬
tive results. (36) Therefore, to prevent carry-over of PCR product
into sample preparation areas, laboratory areas used for PCR reaction
preparation must be maintained separately from areas used for PCR pro¬ duct analysis.The use of PCR is constrained by the requirement for pre-existing
knowledge of DNA sequence information, such as the mip gene sequence.
(8) Only organisms which have been characterized for wholly unique DNA
sequences can be used for the design of primers. In addition, primers
must be homologous to all known examples of a particular DNA sequence.
(14) If only a single example of a particular organism has been
se-quenced, a high probability exists for false negative results. The
choice of a target sequence for amplification by PCR requires extensive
ͣ
yi.w ͣi^l^tJ^^^p'^fc+iAi'i
4^j;^ap^««s-the nucleic acid of unrelated organisms, and both 4^j;^ap^««s-the target and unre¬
lated organism exist in a given sample, analysis by PCR may give false
positive results. (14)An important issue in the use of PCR which has not been resolved is precise quantification of the amount of target sequence in the ini¬
tial sample based on the amount of PCR product. (14) It is often
desirable, especially in environmental sampling, to have knowledge of the concentration of organisms present in a given sample, as well as a test of presence/absence. To date, their are no methods which can
precisely relate the amount of PCR product generated to the number of
organisms contained in the original sample.
Bacterial counts obtained by AODC were consistently greater than those obtained by plate counts. However, the AODC method is a non¬ specific technique. Even in an investigation such as this, where a predetermined concentration of a known bacterial species was introduced into a controlled, HEPA filtered environment, an assumption was made
that all cells identified by AODC were, in fact, the target organism.
Ambient air can contain numerous different species, ranging in concen¬
tration from thousands to millions of viable microorganisms per cubic
meter (15). The utility of AODC is not in its ability to differentiate
organisms or determine viability, but to provide accurate information on
total counts. Some other type of assay, such as culture on a selective
media, must be performed if positive organism identification is desired,
giving the AODC method limited utility in a field investigation. Re¬
sults from this study indicated that the AODC method was not sensitive
to the changes in chamber bacterial concentration introduced in the
three trials. This may have been related to the high bacterial concen¬
trations generated for this study.
Comparison of plate count and AODC results indicated that plating
may underestimate the actual number of bacteria contained in a given
sample. In addition, as airborne concentrations of bacteria decreased,
plate count results became increasingly less accurate. It is widely
accepted that, due to a number of factors, culture plate assays often
underestimate actual levels of microorganisms collected during air
sampling. (31) In this investigation some factors which may have led
to plate count underestimation were: a) limited viability of an organ¬
ism in an airborne environment (31), b) desiccation of, or damage to
an organism during collection (31), c) choice of nebulizer diluent
and/or impingement collection medium, d) choice of growth medium used to
plate sample solutions. L. pneumophila is found naturally in water, not
air. It is possible that some culturable counts were lost during
aero-solization as the bacteria were rapidly transferred from a natural
liquid environment to the air. Both collection methods have inherent
qualities which make loss of culturability likely. Rapid deceleration
of the organisms in the liquid collection medium may have damaged some
organisms and contributed to lower recovery by plating. Bacteria col¬
lected on membrane filters are susceptible to desiccation from the large
volume of air passing across the filter face. Distilled water was not
an ideal choice as a diluent or as the impinger collection medium.
Bacterial survival and recovery may have been enhanced had a buffered
(buffered charcoal yeast extract) for plating may have decreased count
results by inhibiting repair of minimally damaged cells. A less selec¬ tive plating medium, such as trypticase soy agar, may have promoted better growth and recovery results. All of the plate counts results observed in this investigation were within documented CFU detection limits for both impinger and membrane filter sampling methodologies.
(1)
The count underestimation by plating is significant because some fraction of the bacteria in the aerosol can be viable, yet non-cultur-able. This is of clinical significance for a bacteria such as Legionel¬ la pneumophila where viability, not culturability, is the measure of infectious potential. Underestimation by plate count can have serious consequences when false negative results are reported, because the volume and mass of material in an infectious dose of a pathogenic organ¬
ism can be very small. (15) It may be prudent to reconsider some of
the current methods employed for analysis and enumeration of collected airborne microorganisms based on the potential for unacceptable count underestimation.
This investigation was limited to detection of high airborne
bacterial concentrations. While the question of detection feasibility
has been addressed, the issue of a quantifiable limit of detection for
airborne microorganisms using PCR still remains. Follow-up studies should include work to determine the lowest levels at which airborne microorganisms can be detected using PCR in conjunction with various
sampling methodologies. A lower detection limit could then be compared
to limits which have been established using traditional analytical techniques. In addition, better methods need to be developed to preci¬ sely relate the amount of PCR product generated from a sample to the concentration of organisms contained in the sample. Follow-up work might include performing PCR and reverse dot-blot hybridization analysis
on serially diluted samples to estimate endpoints of detection.
The utility of the PCR in bioaerosol monitoring is dependent on the availability of DNA sequence information for microorganisms which proliferate or exist routinely in the air and are of some clinical significance, i.e. pathogenic. An enormous amount of sequence data is available, making PCR possible for a large number of organisms by using
published DNA sequences. (34) However, only a few of the many microor¬
ganisms which influence human health have been extensively analyzed at
the DNA sequence level. (22) Common airborne bacteria for which DNA
sequence information has been obtained are Legionella, Pseudomonas, Bacillus, Micrococcus, Mycobacterium and Corynebacterium, Merely char¬ acterizing sequences of DNA does not itself warrant the use of the PCR. Future research should focus on the development of oligonucleotide
primers unique to specific organisms of interest. An interesting
strategy which can be used is to identify the DNA sequence of theparticular gene involved in pathogenesis. (41) This gene would cor¬
relate to the specific disease and could be used as a genetic marker for
the disease. (4) A unique segment of the DNA sequence for this gene
could then be used as a potential target for amplification by PCR, with
specific organisms of interest.
A variation on traditional PCR which may have utility in
bioaero-sol monitoring is called multiplex PCR. This technique involves am¬
plification of several DNA segments simultaneously in the same PCR
reaction mix. (8) Multiple pairs of primers are placed in a single PCR
reaction tube. Each primer pair is specified for a different target
sequence corresponding to a unique microorganism. Choosing the target
sequences for the individual organisms requires extensive forethought.
The lengths of each individual target DNA sequence should be relatively
close, because large differences will favor the amplification of short
target DNA over long. (8) At the same time, if gel electrophoresis is
used to analyze the PCR products, the lengths should be sufficiently
different so distinct bands will be distinguishable in the gel. In
addition, the primers should be designed with relatively close annealing
temperatures. (8) This will ensure the primers can bind correctly to
the intended flanking regions. Future research could explore the use of
multiplex PCR to identify different species collected in a single air
sample.Appendix I
Protocol for preparing Yeast Extract Broth (38) For 1 (one) liter:
1. Combine the following ingredients in a container of sufficient size to hold 1 liter of solution and mix well: a. 1000ml distilled water
b. 10.Og Yeast Extract Agar c. 0.40g L-cysteine
d. 0.25g ferric pyrophosphate
2. Filter sterilize solution using a 0.45um pore size membrane filter.
3. Adjust pH to 6.90 using 1 N NaOH.
4. Perform a second filter sterilization using a 0.45 pore size membrane filter.
5. Transfer the media in 10 equal volumes to sterile 125 ml glass bottles.
.Jl^U^JUiJ*
Appendix II
Protocol for preparing Charcoal Yeast Extract plating agar 1. Combine the following ingredients in a container suf¬
ficient to hold 500ml of solution:
a. 500ml distilled water b. 18.5g Yeast Extract Agar 2. Adjust pH to 7.10 to 7.20.
3. Sterilize solution at 15 psi and 121 degrees C for 15 minutes.
4. Cool solution to 40 to 50° C.
5. Add 5ml Agar Enrichment. 6. Adjust pH to 6.85 to 7.0.
7. Pour approximate 20 ml quantities of liquid agar into individual sterile 100 mm petri dishes.
8. Allow plates to cool; store at 4 degrees C.
Appendix III
Protocol for the Acridine Orange Direct Count (AODC) Epifluorescence Microscopic Method (28)
1. At time of sample collection, fill a sterile, autoclaved
scintillation vial with 1.1ml of filtered formalin and 20ml of
sample water. This preserved sample can be stored up to 3 weeks
at 4° C.
2. Perform decimal dilutions of the preserved sample. A dilution
of 10" should be sufficient
3. a. Add 1 ml of filtered 0.1% Acridine Orange stain to 9 ml of sample water; allow to stain for approximately 4 minutes.
b. Place a black, 0.22um pore size, 25 mm diameter polycar¬ bonate filter on the filtration apparatus and add the flamed
tower.
c. Filter stained water through the filter with a gentle
vacuum.
d. Rinse filter apparatus and filter with 9 ml of particle free water; allow vacuum to pull for a few seconds after all liquid has passed through filter.
e. Place a small drop of Cargille Type A immersion oil on a clean glass slide. Remove the tower and place the filter on the drop of immersion oil. Place the filter on the drop of oil. Add another small drop of oil on top of the filter.
f. Examine the slide under epifluorescent illumination and count cells inside grid.
4. Count at least 5 random fields and average the counts for the
fields. Count at least 200 cells. If more than 100 or less than
10 cells per field are found, a higher or lower dilution, respec¬ tively, should be used.
5. Calculate the number of cells per ml of sample using the following steps and equations:
b. Given: Diameter of Tower = 16.0 mm
Grid Dimension = 55.5 urn
Area of Grid = 0.0038 mm^
Area of Filter = 201.06 mm^
X = Average Cells/Field Y = AODC (cells/ml) d. Formula to Calculate Y:
X * Area of Filter Y =
0.95 * Area of Grid
Appendix IV
Stock Culture Bacterial Concentration Determined by Plate Count and AODC
j Trial
Plate Cnmt Data(CFU/5ui)
Cmnt
Average
(CFU/5UI)
Dilution
Bacterial 1
Corcentretion(CFU permi)
1
32.30,24, 25, 31,22
27 8.0 E-06 6.75 E+082 28.34,31,27.29.33 30 8.0 E-06 7.50 E+08
3 36.28.34. 29, 31. 26 31 8.0 E-06
7.75 E +08 1
Trial
AODCCoint Data (total organisms)
Cout
Averj^
(total organisrrK)Dilution
Factex
BactBriai 1 Corcentration (organisms per ml)
1 1 55. 52. 67. 44. 48. 35, 56, 60 52 2.0 E-03 1.45E+09
' 2
55. 52, 67. 44. 48,35, 56, 60 52 2.0 E-03 1.45 E +09Appendix V
Summary of High Volume Pump Calibration Data
Trial
Sampling
Method Pre-Cal
(Ipm)
PG6t-Cal
(Ipm)
Aiirerage
(Ipm)
1 ImpinQer 12.01.12.07.12.04 11.61.11.63.11.68 11.82 1 Filter 12.01.12.05,12.03 12.29.12.32.12.27 12.16 1 Impinger 12.04.12.05.12.04 11.48.11.58.11.55 11.79 1 FiltBT 12.06.12.11.12.07 12.13.12.18,12.13 12.11
2 Impinger 12.05.12.05.12.07 12.44.12.45.12.44 12.25
2 Filter 12.05.12.01.12.03 11.98.11.92.11.93 11.99
1 2
Impinc^r 12.03.12.07.12.05 11.81.11.80.11.81 11.932 Filter 12.06.12.02.12.03 12.16.12.11.12.15 12.09
3
Impinqer
12.01.12.04.12.04 12.29.12.32,12.26 12.163 FiltBr 12.08.12.06.12.05 12.09.12.09.12.10 12.08
3 Impinaer 12.02.12.05.12.05 11.43.11.38.11.45 11.73 3 Filter 12.02.12.06.12.03 12.08.12.05.12.02
12.04 1
Appendix VI
Summary of Sampling Parameters
Trial
Sampling
Method
^mpling
FtowratB
(Ipm)
Neh jlizer Fluid Rate
(stock: diluent)
Total Volume 1
Sampled
(liters)
1
impinoer
11.82 1:1 260.041 Filter 12.16 1:1 267.52
1
Impnaer
11.79 1:1 259.381 Filter 12.11 1:1 266.42
2
Impinger
12.25 1:3 269.502 Filter 11.99 1:3 263.78
2
Impinqer
11.93 1:3 262.462 Filter 12.09 1:3 265.98
3
Impinqer
12.16 1:7 267.523 Filter 12.08 1:7 265.76
3
Impinger
11.73 1:7 258.06Appendix VII Equipment List Air Sampling
1. Manostat Glove Box, part # 41-905-000
2. Clamping Ring, (2 each), part # 41-905-320
3. Economy Sleeve Glove (2 each), part # 41-905-544
4. General Electric High Volume Sampling Pump, Model 5KH10GGR105X,
Serial # 1090
5. Collison 3-jet Nebulizer, BGI Inc., Part # CN-24
6. Sartorius 47 mm open face membrane filter holders
7. Costar Corp. 47 mm diameter, 0.40 um pore size polycar¬
bonate membrane filters, part # 111107, lot # 1166
8. Lab Safety Supply Inc., 4" x 4" HEPA filters (2 each),
99.99% efficient for 0.30 um particles, part # 7169,
lot # 2197 00000004 and 3020 00000005
9. AGI-30 Impinger, Ace Glass Co., part # 7540-10
10. Gilabrator, Gilabrator Instrument Corp., Sensor Block Serial #
10838-S, Control Unit Serial # 6778-B
AODC Analysis
1. Fisher Scientific Glass Microanalysis Filter Holder Assembly with
Frit-Glass Support, Catalog # 09-753E
2. Poretics Corp. 25 mm diameter, 0.20 um pore size, black polycar¬
bonate membrane filters, part # 11021, lot # AG83BK21AV15
3. Leitz Wetzlar Otholux II Fluorescent Microscope, Serial # 2523,
NPL Fluortar Oil Immersion Lens, 160/0.17, 100/1.332 - 0.60
PCR Analysis
1. EnviroAmp Legionella Sample Preparation Kit, part #
N808-0088
2. EnviroAmp*''" Legionella PCR Amplification Kit, part #
3. EnviroAmp*"' Legionella PCR Detection Kit, part #
N808-N808-0089
Envi 0090
Gel Electrophoresis
1. International Biotechnologies Inc., Multi-purpose Gel Electrophore¬
sis System, Model MPH, Catalog # 5200
Appendix VIII
Sequence and Primer Binding Sites for the 5S rRNA gene of L. pneumophila (35,42)
5S rRNA Gene Sequence and Primer Binding Sites primer #1
<--->
bp5 bp24
I I
5'-GGCGACUAUAGCGAUUUGGAACCACCUGAUACCAUCUCGAACUCAGAAGUGAAAC AUUUCCGCGCCAAUGAUAGUGUGAGGCUUCCUCAUGCGAAAGUAGGUCAUCGC-3'
I I
bp91 bpll2 <--->
primer #2 primers bind at bp5 - 24 and bp91 - 112
target sequence: bp25 - 90 PCR product length: 108bp
Sequences for 5S rRNA gene Primers
Four primers, two of which are biotinylated are used in the
detection kit.Primer 1: identical to position 5 to 29 of the 5S rRNA DNA
sequence
5' - GGCGACTATAGCGATTTGGAA - 3' 5' - GGCGACTATAGCGGTTTGGAA - 3'
Primer 2: complementary to position 91 to 112 of the 5S rRNA DNA
sequence
Appendix IX
Sequence and Primer Binding Sites for the mip genes
of L. pneumophila (18,35)mip Gene Sequence
primer #1
<--->
bp948 bp965
.11
5'-GCATTGGTGCCGATTTGGGGAAGAATTTTAAAAATCAAGGCATAGATGTTAATCCGGAA GCAATGGCTAAAGGCATGCAAGACGCTATGAGTGGCGCTCAATTGGCTTTAACCGAACA GCAAATGAAAGACGTTCTTAACAAGTTTCAGAAAGATTTGATGGCAAAGC-3'
I I
bpl092 bplll5 <--->
primer #2 primers bind at bp948 - 965 and bpl092 - 1115
target sequence: bp966 - 1091
PCR product length: 168bp
Primers for the L. pneumophila mip gene
Three primers, all of which are biotinylated are used in the
detection kit.
Primer 1: identical to position 948 to 965 of the L. pneumophila
mip sequence5' - biotin - GCATTGGTGCCGATTTGG - 3'
Primer 2: complementary to position 1092 to 1115 fo the L.
pneumophila mip sequence5' - biotin - GCTTTGCCATCAAATCTTTCTGAA - 3' 5' - biotin - GTTTTGCCATCAAATCTTTTTGAA - 3'
Appendix X
Summary of Plate Count Data Determined by Air Sampling
Trial Sampling Method Cnint Data (CFUperaJ) CouTt A)/er«jK (CFU per aJ)
Dilution
Factor
Bacterial
Concentration
(CFU per 5ul) 1 Impinger 12.16,9,4,8,10 9.83 1.00 1.97 E+03 1 Filter 23,18,22,17,21,13 19.00 1.00 3.80 E+03
1
Impinger
0. 4, 2,2, 2,3 2.17 1.00 4.33 E+02 1 FiltBr 1.3.4,3,5,4 3.33 1.00 6.67 E+02 2Impinger
4.3,3,4,7,3 4.00 1,00 8.00 E+02 2 nitar 2,3, 5,0, 5,1 2.67 1.00 5.33 E+02 2 Impinger 5,6.6,2,2,4 4.00 1,00 8.00 E+022 Filtsr 4,2,4,2,3.8 3.83 1,00 7.67 E+02
3
Impinger
0, 2, 0, 2, 0,0 0.67 1.00 1.33 E+02 3FlItBf
4,6,2,3,1.1 2.63 1.00 5.67 E +023 Impinger 0,1.1.0,0.0 0.33 1,00 6.60 E+01
3 Filtsr 1.1.0.0,0.0 0.33 1.00 6.60 E+01
Summary of AODC Data Determined by Air Sampling
Trial
Sampling Method
AODCCr^nt Data
(orgarisms per grid)
Cout i^werage (organisms per grid)
Bacterial Correntratbn
(orgarHsmsper ml)
1 Inrplnqer 42, 40, 36, 43. 39.28. 34. 43 38 2.12 E+06
1 Filter 32,45,30,31.33,40,37.30 35 1.94 E+06
1 Impinqer 31,34,30.31,31.47,47.39 36 2.02 E +06
1 Filter 27,31.22.29,27.40.41.22 30 1.66 E +06 2 Inpinger 29,19.23.30.19,15.24.22 21 1.19E+06 2 Filter 42,33.45.41.41.45.34.37 40 2.21 E +06 2 Impinger 36,39,34.43.34.29.29.42 36 1.99 E +06
2 Filter 49,52.42,49,49,36.45.42 46 2.S3 E +06 3
Iripinger
31,33,21,28,27,32.37,25 29 1.63E+063 Filter 23,18,24,28,19,25,25.19 23 1.26 E +06
3 Irrpinger 27,31.31,38.26.42.31.24 31 1.74 E+06
Appendix XI
Protocol for preparation of L. pneumophila air samples for PCR
amplification (35)
1. Water samples from membrane filter and impinger samples were
individually filtered through 25mm diameter, 0.45um pore size Durapore HVLP membrane filters to capture bacteria.2. Each filter containing trapped bacteria was placed into a 8 ml
polypropylene tube containing 2 ml of DNA Extraction Reagent
Composition of DNA Extraction Reagent:
a. 20% (w/v) Chelex™ 100 in 10 mM Tris-HCl, pH 8.0
b. 0.10 mM EDTA
c. 0.10% Sodium Azide d. final volume 100ml
3. Each tube was capped and vortexed for 30 seconds to release
bacteria trapped on or in filter matrix.4. Each capped tube was placed in boiling water bath to allow
lysing of cells and release of cellular DNA.
5. Sample was now ready for PCR amplification.
Appendix XII
Protocol for preparing Legionella PCR Reaction Tubes (35)
1. Add contents of tube containing Uracil-N-glycosylase (UNG)
to Legionella PCR Reaction Mix; mix well by swirling. PCR reaction mix composition:
0.07 units/ul AmpliTaq DNA Polymerase
0.46 mM each of dUTP, dCTP, dATP and dGTP
77 mM Tris-HCl, pH 8.9 77 mM KCl
4 micromolar total of a combination of 7 oligonucleotide primers Uracil N-Glycosylase composition:
1 unit/microliter of Uracil n-Glycosylase 30 mM Tris-HCl, pH 7.5
150 mM NaCl 1 mM EDTA 1 mM DTT
0.05% Tween*" 20
5% (v/v) glycerol
2. Add 65uL aliquot of Legionella PCR Reaction Mix^w/ UNG to each <
Tubes.
each of 50 autoclaved 0.50ml thin-walled GeneAmp Reaction
3. Aliquot entire contents of PCR Reaction Mix w/ UNG at one time.
4. Place 3 drops of mineral oil, using dropper bottle provided, into each tube.
5. Close cap on each tube.
Appendix XIII
Protocol for PCR amplification of L. pneumophila air samples (35)
1. Individual 20ul samples of extracted DNA were added to tubes
containing 65ul PCR reaction mix with Uracil N-Glycosylase (Com¬
ponents of PCR Reaction Mix and Uracil n-Glycosylase listed in
Appendix xx).
2. Positive and negative control tubes were prepared by adding
20ul of Legionella pneumophila control DNA and distilled
water to 2 PCR Reaction tubes, respectively.3. 15ul aliquots of 25mM MgCl2 added to each tube.
4. Tubes capped and placed in a thermal cycler programmed for
the following:denaturation temperature: 95° C annealing temperature: 63° C extension temperature: 72° C
5. Thermal cycler run for 30 cycles.
Appendix XIV
DNA Thermal Cycler Program (35)
1. program 3 linked files
2a. File XX STEP-CYCLE
Seg 1 Target temp 45° C
Segment time 10 minutes
Seg 2 Target temp 95° C
Segment time 10 minutes
Seg 3 Target temp 0° C
Segment time 0 seconds Cycle count 1
Auto segment extension = NO
Link to stored File XX + 1 b. File XX + 1 STEP-CYCLE
Seg 1 Target temp 95° C Segment time 30 sec Seg 2 Target temp 63° C
Segment time 1 minute
Seg 3 Target temp 0° C Segment time 0 sec Cycle count 30
Auto segment extension = NO Link to stored File XX + 2
c. File 12 STEP-CYCLE
Seg 1 Target temp 72° C Segment time 7 minutes Seg 2 Target temp 0° C
Segment time 0 seconds Cycle count 1
Auto segment extension = NO
Link to stored File X
note: if samples are not going to be removed immediately,
link File XX + 2 to a Soak File at 72 degrees C or store at -20
Appendix XV Probe Sequences for
the Legionella 5S rRNA Gene (35)
A 1:1 mixture of two probes is used for detection of the 5S rRNA gene. The probes hybridize to positions 66 to 82 of the Legio¬ nella 5S rRNA DNA sequence.
Probe 1: 5' - (poly dT)* - GCGCCAATGATAGTGTG - 3'
Probe 2 5' - (poly dT)* - GCGCCGATGATAGTGTG - 3'
Probe Sequences for the
L. pneumophila mip Gene (35)
Probe: hybridizes to position 1012 to 1036 of the L. pneumophila mip sequence
5' - (poly dT)* - CATAGCGTCTTGCATGCCTTTAGCC - 3'
4;
sequences hav a 5' tail of 100 dTs which serves to attach the
probe to the nylon membrane while leaving the sequence specific
probe region accessible for binding
Appendix XVI
Protocol for preapration of buffers necessary for reverse dot-blot analysis (35)
1. Denaturation Solution
a. Combine 4.80g NaOH and 4.1g Na^-EDTA
(disodium-ethyl-eneaminetetraacetic acid) with distilled water to a final
volume of 100ml.b. Store at 2 to 8° C.
2. Hybridization Solution
a. Dissolve any crystalline material present in the SSPE Concen¬
trate Buffer and SDS Concentrate by warming to 37 ° C; mix
often by swirling.1. Composition and pH of SSPE Concentrate Buffer
a. 3.0 M NaCl
b. 625 mM sodium phosphate
c. 25 mM EDTA
d. final volume 160ml
e. final pH 6.2
2. Composition of SDS Concentrate
a. 10% (w/v) sodium dodecylsulfate in water
b. final volume 20mlb. In a clean, autoclaved glass bottle of sufficient size to
contain 160ml, combine the following reagents in order:
1. 32ml SSPE Concentrate Buffer 2. 120ml distilled water
3. 8ml SDS Concentrate
c. Mix well and store at room temperature. 3. Wash Solution
a. Dissolve precipitates in SSPE Concentrate Buffer and SDS
Concentrate by warming to 37° C; mix often by swirling to
b. In a clean, autoclaved glass bottle of sufficient size to
contain 1 liter, combine following reagents in order:
1. 100ml SSPE Concentrate Buffer 2. 890ml distilled water
3. 10ml SDS Concentrate
c. Mix well and store at room temperature.
4. Chromagen Solution:
a. Bring bottle containing 60mg of Chromagen powder (3,3',5,5'
tetramethylbenzidine (TMB)) to room temperature.
b. Dissolve powder by slowly adding 30mlof room temperature 100%
reagent grade ethanol.
c. Recap bottle and seal with Parafilm .
d. Shake the bottle on an orbital shaker for 30 minutes at room
temperature to solubilize all of the powder.
e. Store at 2 to 8° C.
Appendix XVII
Protocol for reverse dot-blot analysis (35)
1. Heat a shaking water bath to 55 +/- 1° C; water level should be 1/4 to 1/2 inch above shaking platform.
2. Heat a stationary water bath to 37 +/- 2° C; warm Hybridiza tion and Wash solutions in bath.
3. Add 32ul of Denaturation Solution to each tube of PCR product; use a clean pipet tip for each sample; mix well and microcentri¬ fuge tubes for 5 seconds.
4. Label one Legionella Detection Strip for each sample to be analyzed with a waterproof marking pen; place one labeled strip per well face-up in the Hybridization Tray.
5. Pipet 3ml of pre-warmed Hybridization Solution into each well containing a Detection Strip.
6. Tilt Hybridization Tray slightly so Hybridization Solution flows toward Legionella label on strip; do not spill any liquid. 7. Transfer 50ul of sample to the center of each well containing Hybridization Solution.
8. Place the clear plastic lid on the Hybridization Tray; mix carefully by rocking back and forth; place tray in 55° shaking water bath; incubate at 55° for 20 +/- 1 minute.
9. Prepare dilution of Enzyme Conjugate in Wash Solution. a. Add 3.1ml of pre-warmed Wash Solution for each strip being analyzed to autoclaved glass flask.
b. Add 26ul of Enzyme Conjugate (Streptavidin-Horseradish Peroxidase in buffer) for each strip to the same flask. c. Mix well by swirling; store at 37° C.
d. This dilution should be prepared no more than 15 minutes before use.
10. After hybridization, remove tray from bath, tip tray at slight angle and aspirate contents of each well leaving the strip
11. Add 3ml of diluted Enzyme Conjugate in Wash Solution to each well containing a strip; cover with lid and place in 55° C
shaking water bath for 12 +/- 1 minute.
12. After incubation is complete, remove tray from bath, remove lid from tray, tip tray slightly and aspirate contents of each well; leave strip in well; wipe lid with lab wipe.
13. Dispense 10ml of pre-warmed Wash Solution into each well; cover with lid; place in 55° C shaking water bath for 10 +/- 2 minutes.
14. Remove the tray from water bath, remove the lid the from tray, and aspirate the solution from each well; leave each strip in its well; wipe lid with lab wipe.
15. Dispense 5ml of pre-warmed Wash Solution into each well; cover with lid and place on orbital shaker at room temperature for 5 minutes at 50 rpm.
16. Remove tray from shaker, remove lid from tray and aspirate wells; wipe lid with lab wipe.