Land use affects coastal stream phytoplankton nutrient and light limitation
LisaCouper1,
1. The University of North Carolina at Chapel Hill, Institute of Marine Sciences, 3431 Arendell Street, Morehead City, NC 28557, USA
ABSTRACT
Human land use alterations in the watersheds of coastal streams flowing into the New River Estuary (NRE) have resulted in changes in nutrient concentrations, irradiance, and light attenuation of receiving systems. Two watersheds draining into the NRE were selected for comparison given their contrasting land use characteristics. Significant differences in NH4+¿¿
, and NO−¿¿x
were found between sites during previous in situ monitoring, and differences in light attenuation and surface irradiance were found during this study. In order to understand the mechanisms influencing native phytoplankton abundance in these coastal streams, nutrient and light addition bioassays were conducted for each site at base and storm flow, and further light level manipulations were conducted using site as an additional factor given the difference in optical water properties. In the nutrient and light bioassays, it was found that N additions stimulated increased phytoplankton abundance; N additions and light have an interactive effect on abundance; and P additions and light additions alone had no effect at either site. In light level manipulation bioassays, the difference in phytoplankton response was much greater between different light treatments for a given site than between the two sites at a given light level. This result implies that canopy has a relatively greater effect than inherent optical water properties in governing light availability as indicated by phytoplankton abundance. Results of light-level manipulation bioassays and P-I curves indicate that phytoplankton have a lower photosynthetic efficiency and maximum rate when disruptions to their light regime occur, and phytoplankton adapted to greater light environments have decreased susceptibility to photoinhibition.
1. INTRODUCTION
The concentration of the human population near the coast is a key driver of the degradation of marine ecosystems (Vitousek, 1997). Humans induce disturbances to these ecosystems through land use transformations, namely increases in impervious cover (IC), which alter the natural hydrology of coastal watersheds (Paerl, 1998).
Hydrological changes, such as the reduction of infiltration and percolation, cause increases in nutrient and pollutant discharges into receiving systems. It has been demonstrated that this heightened nutrient and pollutant load results in lower overall stream health as assessed by the abundance and diversity of secondary consumers or lithophytes (Klein 1979, Schueler 1994). The relationship between chemical loading and phytoplankton is less well studied given the relatively fast flushing time of streams which is thought to inhibit significant nutrient uptake by phytoplankton. However, the residence time of many coastal streams may be sufficiently long to allow for phytoplankton growth in response to increased nutrient inputs, thus there is a clear need to investigate this relationship.
Two essential nutrients, Nitrogen (N) and Phosphorus (P), are of particular concern. The limited supply of N and P in less developed watersheds allows them to serve as a natural constraint of excessive phytoplankton growth (Paerl et al., 2011). An increase in N and P loads thus can result in undesirable phytoplankton blooms with symptoms such as hypoxia, fish kills, and an overall decline in water quality (Nixon 1995). Management strategies aimed at reducing N and P
have been successful in reducing phytoplankton abundance; however, nutrient levels are not the sole factor governing the growth of primary producers (Conley 2009, Paerl 2009).
Light availability can also dictate phytoplankton abundance: enhancing or restricting growth even in the presence of sufficient N and P (Phlips 1997, Scott 2010). Irradiance, as with nutrient concentrations, is not solely an intrinsic property of a given system but is largely influenced by anthropogenic landscape transformations. Humans directly alter light regimes by reducing the canopy cover on the banks of low-order streams, thus allowing for higher levels of surface irradiance. A loss of vegetative cover as a whole also affects the light environment of receiving streams. Vegetated watersheds contribute a greater amount of plant litter and organically rich soils into local waterways which, upon decay, increase the chromophoric dissolved organic matter (CDOM) of the water (Keith et al., 2001). CDOM absorbs light strongly in the blue portion of photosynthetically active radiation, thereby reducing the photons available for photosynthesis (Ferrari et al., 1996).
experiment tested the hypothesis that canopy has a relatively larger effect than inherent optical properties, namely CDOM, on light availability for phytoplankton growth. The third experiment tested the hypotheses that coastal stream phytoplankton adapt to various light environments through changes in photosynthetic efficiency and maximum photosynthetic rate, and that shade-adapted phytoplankton are photoinhibited when exposed to full light.
Study Site Selection and Background
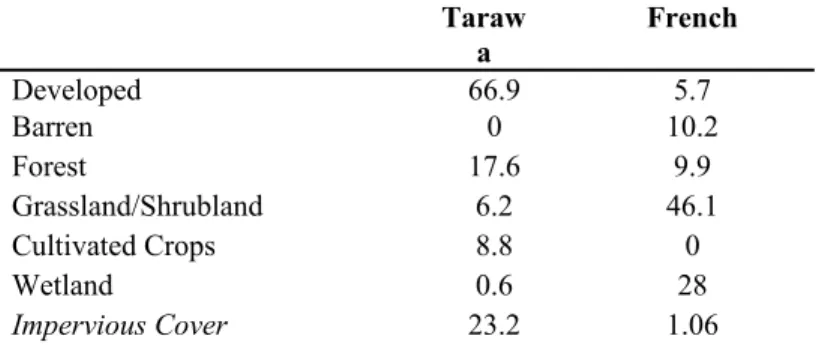
The watershed of interest for our investigation was the Marine Corps Base Camp Lejeune in Jacksonville, North Carolina, which drains into the New River Estuary. In order to best assess the effect of human land use on nutrient and light levels and phytoplankton abundance, two watersheds of contrasting land use characteristics within Camp Lejeune were selected. These sub-sites were Tarawa Terrace, a military neighborhood with high residential density and IC, and French, a region dominated by forest, grassland, and wetland with low IC (Table 1).
Table 1: Land Use Classification for Selected Watersheds.
‘Developed’ includes low, medium and high development. 'Forest' includes deciduous, evergreen and mixed forests. 'Wetlands' includes woody and herbaceous. Impervious cover is a subset of developed land but is listed as separate here to provide additional descriptive information (2001 NLCD).
Taraw a
French
Developed 66.9 5.7
Barren 0 10.2
Forest 17.6 9.9
Grassland/Shrubland 6.2 46.1
Cultivated Crops 8.8 0
Wetland 0.6 28
Impervious Cover 23.2 1.06
2. METHODS
2.1 Ambient Nutrient and Light Level Comparisons
Nutrient concentrations were monitored at Tarawa and French as part of the Defense Coastal/Estuarine Research Program (DCERP, unpublished data). Water samples were collected from both sites during base flow and storm flow. Ammonium (NH4+¿¿
), nitrogen oxides: nitrates (N03−¿ ¿ and nitrites (N02−¿ ¿, and phosphate (PO
4 −¿¿
) concentrations were analyzed using a Lachat Quick-chem 8000 auto-analyzer. Light levels were measured at both sites using a LI-COR LI 1400 Datalogger with a 2π light sensor and a meter stick. Irradiance was measured through a vertical profile of the water column to calculate light attenuation.
Vertical attenuation coefficients ( Kd) were calculated
from the slope of the linear regression of the natural logarithm of irradiance versus depth.
All CDOM values presented are given as the absorption coefficient at 440 nm. Absorbance values were obtained through the use of a spectrophotometer and converted into an absorption coefficient using the equation:
aCDOM , λ=2.303∗ACDOM , λ∗pathlength−1
General Experimental Methods
Water samples were collected in 5 gallon carboys and transported to the UNC-CH Institute of Marine Sciences (IMS) in Morehead City and poured into 4-L cubitainers based on treatment. Separate additions of N (NH4NO3¿
and P ( KH2PO4¿ were made to achieve concentrations (above ambient) of 50 μM and 3 μM, respectively. Control cubitainers received no additional nutrients. N and P additions were applied in accordance with the Redfield ratio and approximated the greatest nutrient concentrations observed during 3 years of stream monitoring. All cubitainers were placed in the outdoor pond behind IMS following nutrient treatments.
Neutral-density screens were employed to adjust irradiance. Neutral density screens were clamped over plastic rings, which confined cubitainers floating in the pond.
100 mL aliquots were collected from each cubitainer after 96 h. This collection time is based off of previous experimentation to determine appropriate response time, and from literature methods (Downing et al., 1999). Cubitainers were inverted before sampling to account for settling biomass. Initial samples were collected before the nutrient treatment in order to get a baseline for comparison. Samples were analyzed for chlorophyll a
concentrations, a proxy for phytoplankton abundance, using the non-acidification fluorometric method (Welschmeyer, 1994). 30-50 milliliter sub-samples were filtered onto 25 mm Whatman GF/G glass microfiber filters and stored at 0°F. Seven milliliters of 90% acetone was added to filters prior to sonication on ice for 5 minutes. Chlorophyll a on filters was extracted for 24 hours at 0°F then analyzed with a Turner Trilogy fluorometer.
Experiment 1: Nutrient and Light Effects
Experiment 1 tested for nutrient and light limitation from two first-order coastal streams. A 2x3 factorial design was employed with factors being nutrients, light, and site. Four replicates were taken for each treatment (Table 2). The experiment was conducted at base flow and at storm flow in order to assess the effect of elevated stream inputs on nutrient and light limitation.
yAasdf
References: add downing et al!!!
The relationship between photosynthesis and irradian
Tarawa French
+Nutrients
+ Sun
+Nutrients
- Sun
+ Nutrients
+ Sun
+Nutrients
- Sun 0 Nutrients
+ Sun 0 Nutrients- Sun 0 Nutrients+ Sun 0 Nutrients- Sun
Light treatments (i.e. the number of neutral density screens used) were selected based off of multiple field measurements of irradiance using the LI-COR LI 1400. Irradiance measurements were similarly performed under various numbers of screens as well as through the cubitainers. Treatments were designed such that half of the samples would be placed under 2 screens during each day of the 4 day experiment, which would provide irradiance greater than these systems naturally receive. The other half would be placed under 3 screens for the full 4 days providing a light environment roughly equal to the average irradiance of the two sites. The latter treatment is referred to as ambient irradiance
The relationship between photosynthesis and irradiance
(P-I) was analyzed for storm flow water samples from both sites using a modified version of the Lewis and Smith method (Lewis and Smith, 1983). Photosynthetrons generated 20-point P-I curves for each site. Each vial contained 10 milliliters GF/F filtered water from a given sampling site, and were spiked with C14–bicarbonate to a final concentration of 1 μCi/mL. One sample per site for time zero ¿ ¿) radioactivity measurements contained 5 mL
of sample water and 500 μL of buffered formalin, which was added immediately after the addition of sample water. T0 samples were used to correct for the uptake of C14 that occurred during experimental setup. One vial per site for measurement of total radioactivity contained 500 μL of phenethylamine (PEA) and 50 μL of sample water. A Cool-Lux 75 W projector lamp provided a range of irradiances, which were measured at each position in the photosynthetron using a PAR Scalar Irradiance sensor model QSL-2100. Incubations were performed for 45 min, after which 500 μL formalin were added to the vials to terminate the experiment. One milliliter of 50% HCL was added to the vials before placement on a shaker table overnight to eliminate unincorporated C14. A Beckman model LS 5000TD liquid scintillation counter was used to enumerate counts per minute, which were then converted to disintegrations per minute using quench curves from a calibrated C14 -toluene standard.
Experiment 2: Canopy versus Optical Water Properties
Experiment 2 tested the relative influence of canopy and inherent optical water properties in governing light environments for phytoplankton. A 2x2 factorial design was employed in this experiment with factors being site and light, and 4 replicates for each treatment. All
cubitainers received N and P additions in this experiment. Given that the nutrient concentrations added were close to the highest observed in either system in 3 years, this nutrient addition likely equalized any initial differences in nutrient concentrations. Light treatments for this experiment varied slightly from that of experiment 1: half of all cubitainers received full sun during each day of experimentation, while the other half were placed under 5 neutral density screens for the same amount of time. Screen treatments were considered to mimic the effect of canopy on surface irradiance. Full sun exposure (i.e. 0 screens) approximated a stream with low surrounding vegetative cover and thus high water surface irradiance while the five-screen treatment approximated a stream with lower surface irradiance due to vegetative shading. Because nutrient concentrations were roughly equalized given the highly concentrated nutrient additions, inherent optical water properties was the main difference in the water collected from these 2 sites in terms of factors influencing phytoplankton growth.
Experiment 3: Photosynthetic Adaptation to Changing Light Environments
Experiment 3 tested for the ability of phytoplankton to adapt their photosynthetic efficiency and maximum rates in response to various light regimes. A bioassay method was again employed, but in this case light was the only factor to vary between treatment groups. Site was no longer a factor because only French water samples were tested, and all treatments received a nutrient addition to alleviate any starting nutrient limitation. Light treatments involved exposure to full sun or incubation under 5 screens, but in this experiment half of the treatment groups experienced a switch to the opposite light level midway through experimentation. Switches were made after 2 days, and the structure of treatments is as follows:
Number of Samples Treatment
8 0 0
8 0 5
8 5 0
8 5 5
3. RESULTS
Background monitoring and field measurements
Ammonium and nitrate/nitrite concentrations were found to be significantly higher at Tarawa than at French, while phosphate concentrations did not differ significantly (P<.001, P<0.001, P>0.05, respectively)
Figure 1: Nutrient concentrations at Tarawa and French collected over a 3-year monitoring period conducted as part of the Defense Coastal/ Estuarine Research Program (DCERP, unpublished data.).
The light environments were also found to vary significantly between the 2 sites as indicated by differences in surface irradiance and optical water properties. Surface irradiance was higher at French given the lack of vegetative cover surrounding the sample site, but was more rapidly depleted as evidenced by a larger attenuation coefficient. While any living or non-living matter in the water column can serve to obstruct light transmission, TSS, phytoplankton and CDOM are generally accepted as the components most strongly contributing to light attenuation (Vähätola et al., 2005). French noted lower TSS and chlorophyll a levels over the three year monitoring period, but greater CDOM levels and light attenuation (P<0.001, P<0.001, P<0.001 respectively). This result suggests that CDOM has a relatively greater influence than TSS and phytoplankton on preventing light transmission in these two streams. Previous studies attempting to determine the relative strength of these 3 components on light attenuation have provided inconsistent results. Some have found CDOM to have the greatest proportional influence on attenuation, and others have found TSS to be a larger contributor (Christian et al, 2003, Kostoglidis et al, 2005).
Table 3: Optical water properties and light attenuation measurements. TSS and chlorophyll a values presented are averages from biweekly monitoring from March, 2008 to May, 2013. CDOM values are averages from 8 sampling times between January, 2009 and July, 2013. Attenuation values are the average of 2 sampling times in May and June 2013.
Tarawa French
CDOM (m−1)
4.02 27.81
TSS (mg/L) 34.800 4.74
Chlorophyll a (µg/L) 9.659 1.250
Kd(PAR) (m−1¿ 3.91 5.50
Experiment 1: Nutrient and Light Effects
In the bioassay conducted with samples from base flow (Figure 2a-b), Tarawa chlorophyll a did not vary significantly with N or P additions nor increased light relative to the controls. A significant increase in French chlorophyll a was observed in response to the N addition (P= 0.0013) when pooling light treatments, but chlorophyll
a levels did not vary significantly with the P addition. While light treatments overall were not significant, French samples with N additions receiving ambient irradiance were found to have somewhat higher chlorophyll a levels than those receiving increased light levels (P=0.074).
In the storm flow bioassay (Figure 2c-d), a significant increase in Tarawa phytoplankton biomass was found in response to the N addition when light treatments were pooled (P=0.0027). Again no significant variation in chlorophyll a was found with the P addition or with light levels across all nutrient treatments.
French phytoplankton biomass also increased significantly in response to the N addition during the storm flow bioassay (P<0.001), but no response was detected for the P addition or for light treatments overall. Resolving light treatments by nutrient additions yielded a significant interaction between nutrients and light for N additions (P= 0.0010) However in this trial, significantly greater chlorophyll a levels were found for the N addition samples receiving increased light than those receiving ambient light (P=0.0055).
Photosynthetic parameters Pmax (maximum photosynthetic
rate) and α (photosynthetic efficiency, measured as the slope of the initial linear portion of the curve at low light levels) were calculated to provide explanation for these results (Table 4). Pmaxand α were both greater at French
than Tarawa indicating French phytoplankton’s capacity for greater photosynthetic efficiency at low irradiances, and greater maximum photosynthetic productivity. Although Tarawa has a lower Pmax, photosynthetic productivity remains relatively constant after reaching this maximum, whereas French productivity declines after reaching its maximum
Table 4: . Photosynthetic parameters (Pmax and α) derived from experiments on photosynthesis-irradiance relationships
Tarawa French
Pmax 0.920 1.71
α 0.00206 0.00256
Experiment 2: Canopy Versus Optical Water Properties
2a b
c d
Figure 2a-d: Experiment 1 Results. Phytoplankton biomass, as measured in μg/L chlorophyll a is presented for base and storm flow bioassays.
Tarawa and French chlorophyll a concentrations at 0 screens were detected nor between the two sites at 5 screens.
Figure 3. Effect of site and light phytoplankton abundance
Experiment 3: Photosynthetic Adaptation to Changing Light Environments
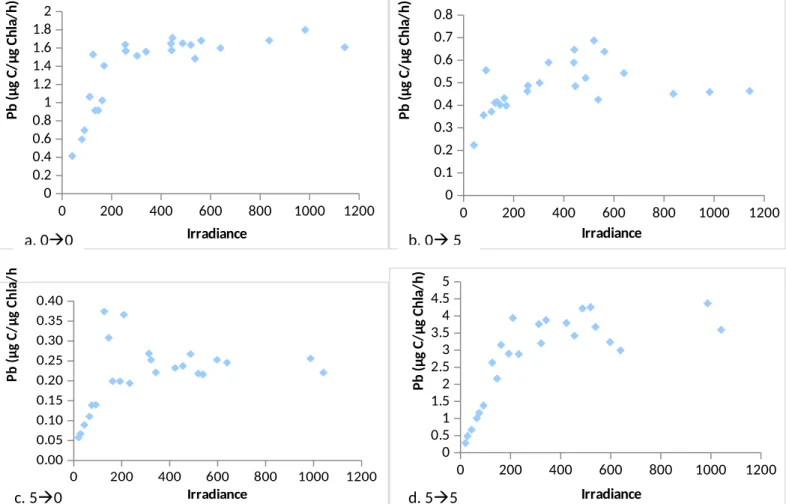
Phytoplankton abundance varied between different light treatments, with the full sun samples displaying the greatest abundance and all other samples displaying lower but essentially equal abundance. Thus either photoinhibition did not appear to be occurring in this experiment, or the full canopy treatment was sufficiently dark to limit photosynthesis beyond that of photoinhibition. P-I curve data indicated further differences between phytoplankton after exposure to separate light regimes. Changes in maximum photosynthetic rate and photosynthetic efficiency were noticed between samples receiving constant versus changing light levels. Higher maximum photosynthetic rate and higher photosynthetic efficiency were achieved by those samples which remained
Figure 4. Effect of light regime on phytoplankton abundance. Error bar for 00 reaches to 70 µg/L.
at a constant light level as compared to those which experienced an alternation in their light environment. The greatest maximum rate and efficiency was observed by the samples incubated at full canopy. While other studies have found photosynthetic efficiency to increase in shade-adapated phytoplankton, an observation of greater maximum photosynthetic rate is unsupported by studies performing similar analysis (Platt et al, 1982; Rivkin et al, 1982). Additionally, a decreased susceptibility to
photoinhibition was observed for phytoplankton incubated at full sun for the entire treatment period as compared to all other samples. That is, the P-I curve for the full sun samples appears to level off after reachingPmax, while all others show decreases in photosynthesis after an irradiance of around 500 μmol s−1
0 200 400 600 800 1000 1200 0 0.2 0.4 0.6 0.8 1 1.2 1.4 1.6 1.8 2 Irradiance P b ( µ g C /µ g C h la /h )
0 200 400 600 800 1000 1200
0 0.1 0.2 0.3 0.4 0.5 0.6 0.7 0.8 Irradiance P b ( µ g C /µ g C h la /h )
0 200 400 600 800 1000 1200 0.00 0.05 0.10 0.15 0.20 0.25 0.30 0.35 0.40 Irradiance P b ( µ g C /µ g C h la /h )
0 200 400 600 800 1000 1200
0 0.5 1 1.5 2 2.5 3 3.5 4 4.5 5 Irradiance P b ( µ g C /µ g C h la /h )
a. 00 b. 0 5
c. 50 d. 55
Figure 5a-d. Effect of light environment on P-I curves. Scale varies between graphs in order to make the shape of the curve evident to the viewer. Light treatments are indicated on the graph based on the number of screens used to achieve a given treatment (i.e. 0-5 indicates incubation at 0 screens for 2 days, and 5 screens for the remaining 2 days.
4. Discussion
Increased human land-use in the Camp Lejeune military base was found to correspond with significantly higher N inputs and lower CDOM levels in receiving first-order coastal streams. Phytoplankton biomass was also found to be significantly higher at sites with more developed watersheds at both storm and base flow conditions likely due to the heightened nutrient load and higher water column irradiance. Nutrient and light manipulation bioassays revealed that phytoplankton in these coastal streams were limited by N when nutrient limited, and were not limited by P. Thus management strategies aimed at minimizing the potential for phytoplankton blooms in the NRE should focus on reducing N inputs into coastal streams. Additionally, an interactive effect between light and N appeared to govern phytoplankton abundance with phytoplankton being primarily limited by N and secondarily limited by light.
Higher phytoplankton abundances at lower light levels for French at base flow and Tarawa at storm flow may be due to photoinhibition. Inconsistent responses to light treatments may have been a result of differences in optical water properties at base and storm flow conditions. That is, greater organic matter inputs to French at storm flow may have resulted in water which was even darker than normal. Thus increasing the light environment during the bioassay may have
alleviated light limitation for storm flow samples given that the phytoplankton community was adapted to a higher light environment. Conversely the base-flow samples were adapated to their current light environment and did not benefit from increasing irradiance any further. This phenomenon of adaptation to differing light environments is supported by our results which indicated that coastal stream phytoplankton can adapt their maximum photosynthetic rates and photosynthetic efficiency within a period of 2 days in response to changing light regimes. Changes in Pmaxand efficiency were noticed between
phytoplankton incubated at different light regimes. Greater Pmaxand efficiency were observed for those phytoplankton that were incubated at a constant light environment, not including natural daily changes in irradiance, as compared to those that were exposed to either full sun or full canopy for 2 days and then switched. Phytoplankton abundances were also found to vary with different light treatments. Phytoplankton incubated at full sun for the entire treatment period had a much higher biomass than those that received any exposure to full canopy. These results together imply that changes to canopy cover incurred in the watershed of coastal streams can lead to changes in both the biomass and photosynthetic abilities of phytoplankton in these streams.
References
Arnold, C.L., Gibbons, C.J., 1996. Impervious surface coverage. Journal of the American Planning Association. 62 (2): 243–258.
Christian, D. "Relative Influence of Various Water Quality Parameters on Light Attenuation in Indian River Lagoon." Estuarine, Coastal and Shelf Science 57.5-6 (2003): 961-71.
Conley, D. J., Paerl, H. W., Howarth, R. W., Boesch, D. F., Setizinger, S. P., Havens, K. E., Lancelot, C., et al. (2009). Controlling Eutrophication: Nitrogen and Phosphorus. Science,323, 1014–1015.
Chromophoric dissolved organic matter and total concentration of dissolved organic carbon in the southern Baltic Sea region.Mar. Chem. 55, 299-316
Grzybowski, W. (2000). Effect of short-term sunlight irradiation on absorbance spectra of chromophoric organic matter dissolved in coastal and riverine water. Chemosphere,40(12), 1313–1318.
Hill, W. R., Ryon, M. G., & Schilling, E. M. (1995). Light Limitation in a Stream Ecosystem: Responses by Primary Producers and Consumers. Ecology, 76(4), 1297–1309.
Julian, JP, Doyle MW, Powers SM, Stanley EH, Riggsbee JA. 2008. Optical water quality in rivers. Water Resources Research. 44:1-19.
Keith, D.J., J.A. Yoder, and S.A. Freeman (2002). Spatial and Temporal Distribution of Coloured Dissolved Organic Matter (CDOM) in Narragansett Bay, Rhode Island: Implications for Phytoplankton in Coastal Waters. Estuarine, Coastal and Shelf Science, 55, 705-717
Klein, R.D. 1979. Urbanization and Stream Quality Impairment. Water Resources Bulletin 15, 4: 948-63.
Kostoglidis, A., C. Pattiaratchi, and D. Hamilton. "CDOM and Its Contribution to the Underwater Light Climate of a Shallow, Microtidal Estuary in South-western Australia." Estuarine, Coastal and Shelf Science 63.4 (2005): 469-77
Lewis, M. R, Jj Cullen, and T. Piatt. "Relationships between Vertical Mixing and Photoadaptation of Phytoplankton: Similarity Criteria." Marine Ecology Progress Series 15 (1984): 141-49
Lewis, M. R., & Smith, J. C. (1983). A small volume, short-incubation-time method for measure- ment of photosynthesis as a function of incident irradiance. Marine Ecology Progress Series, 13, 99–102.
MacIntyre, Hugh L., Todd M. Kana, and Richard J. Geider. "The Effect of Water Motion on Short-term Rates of Photosynthesis by Marine Phytoplankton." Trends in Plant Science 5.1 (2000): 12-17
Matson, E. A., Brinson, M., M,,Cahoon, D. D.Davis, G. J. (1983). Biogeochemistry of the sediments of the Pamlico and Neuse River Estuaries, North Carolina. Water Resources Research Institute Report No. 191. Univ. of North Carolina, Raleigh
Neori, A., O. Holm-Hansen, B. G. Mitchell, and D. A. Kiefer. "Photoadaptation in Marine Phytoplankton : Changes in Spectral Absorption and Excitation of Chlorophyll a Fluorescence." Plant Physiology 76.2 (1984): 518-24.
Nixon, S.W. 1995. Coastal marine eutrophication: A definition, social causes, and future concerns. Ophelia 41: 199-219
Results of experiment 2 indicated that canopy was relatively more important than optical water properties in determining the amount of irradiance in the water column that is available for phytoplankton growth. In this controlled experiment, even though all samples received sufficient nutrient inputs, phytoplankton growth only exceeded the state standard of 40 µg/L when exposed to full sunlight for the entire treatment period. Thus in order to limit phytoplankton blooms in the NRE, management plans should ensure that trees and tall shrubbery surrounding these coastal streams are allowed to remain untouched. However due to the lack of precision of the light sensor which determined the selection of screen levels, further experimentation should be done in order to verify these results.
Questions have been raised as to the validity of modeling complex natural systems in controlled bioassays. Physical processes such as flow and sediment recycling of nutrients play important roles in natural ecosystems but were eliminated in these bioassays. While these are meaningful criticisms, they likely do not negate the validity of the results found in this study for a few reasons. Firstly, nutrient cycling in the water-column has been found to be of equal or greater importance than sediment nutrient cycling in a study conducted in the lower NRE (Matson et al. 1983). Additionally, this water-column recycling is largely performed by heterotrophic grazers such as zooplankton (Rudek et al., 1991). Since water samples were not filtered before the start of the bioassay, these heterotrophic grazers were able to be present during the study. Therefore, while the bioassay procedure used in this study cannot account for all processes occurring within the systems studied, we believe the results presented are reflective of responses to nutrients and light that would occur naturally. Although imperfect, attempts to understand the growth conditions of these primary producers is of vital importance given their role in energizing coastal ecosystems, and their sensitivity to changes in parameters affecting their growth.
ACKNOWLEDGEMENTS
Paerl, H. W., & Bowles, N. D. (1987). Dilution bioassays: Their application to assessments of nutrient limitation in.Hydrobiologia, 146(3), 265–273.
Paerl, H. W. (2009). Controlling Eutrophication along the Freshwater–Marine Continuum: Dual Nutrient (N and P) Reductions are Essential. Estuaries and Coasts, 32(4), 593–601.
Paerl, H. W., Xu, H., McCarthy, M. J., Zhu, G., Qin, B., Li, Y., & Gardner, W. S. (2011). Controlling harmful cyanobacterial blooms in a hyper-eutrophic lake (Lake Taihu, China): The need for a dual nutrient (N & P) management strategy. Water Research, 45(5), 1973– 1983.
Philips, Edward J., Mary Cichra, Karl Havens, Charles Hanton, Susan Badylak, Beate Rueter, Mike Randall, and Phyllis Hansen. "Relationships between Phytoplankton Dynamics and the Availability of Light and Nutrients in a Shallow Sub-tropical Lake."Journal of Plankton Research 19.3 (1997): 319-42
Phlips, E.J., Cichra, M., Havens, K.E., Hanlon, C, Badylak, S., Rueter B., Randall M., Hansen, P. 1997. Relationships between phytoplankton dynamics and the availability of light and nutrients in a shallow subtropical lake. Journal of Plankton Research, 19 (1997), pp. 319–342
Platt, T. "Photosynthesis and Photoadaptation of Marine Phytoplankton in the Arctic." Deep Sea Research Part A. Oceanographic Research Papers 29.10 (1982): 1159-170.
Prezelin, B. B., and H. A. Matlick. "Time Course of Photoadaptation in the P-I Relationship of a Dinoflagellate Exhibiting Photosynthetic Periodicity." Marine Biology 58.2 (1980)
Rivkin, R. B., H. H. Seliger, E. Swift, and W. H. Biggley. "Light-shade Adaptation by the Oceanic Dinoflagellates Pyrocystis Noctiluca and P. Fusiformis." Marine Biology68.2 (1982): 181-91
Rudek, J., Paerl, H. W., Mallin, M. A., & Bates, P. A. (1991). Seasonal and hydrological control of phytoplankton nutrient limitation in the lower Neuse River Estuary, North Carolina.Marine Ecology Progress Series, 75, 133–142.
Sakshaug, Egil, and Osmund Holm-Hansen. "Photoadaptation in Antarctic Phytoplankton: Variations in Growth Rate, Chemical Composition and P versus I Curves Sakshaug, Egil and Osmund Holm-Hansen, 1986. J. Plankt. Res., 8(3):459–473." Deep Sea Research Part B. Oceanographic Literature Review 33.12 (1986): 1025
Schueler, T.R. 1994. The Importance of Imperviousness. Watershed Protection Techniques. 1,3: 100-11
Schwartz, R. (2010). Land use affects the timing and magnitude of material delivery to headwater streams coastal North Carolina (Doctoral Dissertation)
Scott, J. T., McCarthy, M.J., 2010. Nitrogen Fixation may not balance the nitrogen pool in lakes over timescales relevant to eutrophication management. Limnol. Oceanogr., 55(3), 1265-1270
Vahatalo, Anssi V., Robert G. Wetzel, and Hans W. Paerl. "Light Absorption by Phytoplankton and Chromophoric Dissolved Organic Matter in the Drainage Basin and Estuary of the Neuse River, North Carolina (U.S.A.)." Freshwater Biology 50.3 (2005): 477-93
Vitousek, P.M., H.A. Mooney, J. Lubchenco and J.M. Melillo. 1997. Human domination of earth’s ecosystems. Science 277:494-499.