Influence of Metformin on T-Cell mRNA Expression
By
Michael G. Harley
Senior Honors Thesis Department of Nutrition
University of North Carolina at Chapel Hill
April 27, 2018
Approved:
________________________________ Melinda Beck, Thesis Advisor
iii
ABSTRACT
Michael G. Harley: Influence of Metformin on T-Cell mRNA Expression (Under the direction of Melinda Beck)
iv
TABLE OF CONTENTS
LIST OF TABLES……….…….v
LIST OF FIGURES………..……vi
CHAPTER 1: INTRODUCTION………..………….1
CHAPTER 2: METHODS AND MATERIALS……….………5
Study Design……….5
PBMC Isolation and Stimulation……….6
Total RNA Purification and RT-qPCR………6
Statistical Analysis……….6
CHAPTER 3: RESULTS……….7
CHAPTER 4: DISCUSSION……….9
v
LIST OF TABLES
Table 1: OB+MET group Demographics……….13
Table 2: OB group Demographics……….……….14
vi
LIST OF FIGURES
Figure 1: mRNA expression of GLUT-1, LDH, and CPT-1 comparing OB+MET
and OB groups under unstimulated, influenza stimulated, and positive control conditions…………...15
Figure 2:Comparing overall mRNA expression of influenza stimulated PBMCs………..16
1
Chapter 1: Introduction
Despite recently surging as a main topic in public health discourse, obesity is not new to the health history of humans. What does seem to be new, however, is the negative implications of obesity. When considering the historical context of obesity, body fat seems to have been an advantage during times of pestilence and famine. The ability to store excess energy in the form of fat and then be able to use that energy over a long period of time, appears to have determined whether early humans lived or died.2 Towards the end of the 19th century, excess fat was no longer culturally considered desirable. Not until the 20th century did public health officials begin to understand the association between morbidity and obesity. Therefore, describing obesity as a disease, with a specific pathology, is only about 100 years old.2 The exponential increase in obese individuals over the past 60 years and the increase in morbidity due to obesity, eventually led the World Health Organization to declare it a global epidemic and worldwide public health crisis.2
Defined by a BMI of ≥ 30 (weight in kg/height in m2), obesity has increasingly become a
2
Infecting 5-10% of adults yearly, the influenza virus is one of the most lethal infectious viruses. Since 2010, it is estimated that influenza infection has resulted in 12,000-56,000 deaths and 9 million-35 million cases of severe illness.7 The most recent 2009 influenza pandemic claimed the lives of hundreds of thousands of people. The CDC estimates that between 150,000 and 575,000 people died during the 2009 pandemic.8 With viral strains changing every year, the risk of an outbreak threatens the public’s health. Although complete protection from infection is not currently possible, vaccination provides and remains the best method of reducing risk of infection. The influenza vaccine functions by exposing the immune system to a small amount of inactivated influenza virus and facilitating the development of immunological memory. In the case of future exposure to influenza, the immune system should be able to recognize the virus and elicit a specific response to prevent virus replication and severe illness.
Because obese individuals have an increased risk of influenza infection, vaccination should be administered in order to provide the best form of protection. However, it has been reported that 12 months post-vaccination, obese individuals have significantly lower levels of antibodies when compared to healthy weight individuals.9 Additionally, the T cells of obese individuals demonstrate significantly decreased activation and expression of functional proteins.9 In 2017, it was found that despite being vaccinated against influenza, obese individuals have twice the risk of developing influenza or influenza-like illness.10 These findings are daunting due to the fact that the best method of protection, vaccination, is unable to protect a large part of the population from potentially deadly infection.
Due to the role of T-cells in immune function and response to influenza infection, it is important to understand the reason behind their impairment in obese individuals. Numerous studies have
3
demands on resting T cells are moderately low.12 Relying predominantly on breakdown of fatty acids and pyruvate oxidation in the TCA cycle, resting T cells increase energy stores in preparation of future
immune responses.12 Conversely, T cells responding to an antigen require a different metabolic profile that matches their function. During an immune response to influenza infection, T cells proliferate in order to successfully combat the activities of influenza virus. Increased growth and replication requires biosynthesis of lipids, nucleic acids, and proteins.12 This demand for biosynthesis is met by a change in metabolism that is characterized by increased aerobic glycolysis and decreased breakdown of fatty acids.12 This metabolic profile in which glucose metabolism is increased, matches the high energy needs of an activated T-cell, allowing it to function properly as it counteracts the effects of influenza infection.
Regulating the two metabolic states of T cells are mammalian target of rapamycin (mTOR) and AMP-activated protein kinase (AMPK). Upon activation of T-cells, mTOR is activated and promotes glucose metabolism via posttranslational effects, thus inducing the metabolic state in which aerobic glycolysis predominates.12 To facilitate glucose metabolism, GLUT-1 is upregulated to the cell surface, allowing for cell growth and proliferation. In order to complete the shift to aerobic glycolysis, mTOR indirectly downregulates CPT-1, an enzyme involved in fatty acid breakdown, by promoting fatty acid synthesis.12 The increase in lipid synthesis inhibits CPT-1 activity. Finally, the shift to aerobic glycolysis also results in upregulation of lactate dehydrogenase, an enzyme that converts glycolysis products to lactate. Opposing mTOR and promoting a resting metabolic state, AMPK focuses on increasing energy stores in the cell. Activated by an increased ratio of AMP to ATP, AMPK inhibits mTOR and upregulates CPT-1 activity. AMPK is the key regulator in the metabolic state in which energy is primarily produced via oxidative phosphorylation, thus increasing energy stores and preparing T-cells for rapid cell growth required during an immune response.12
4
activated metabolic state without stimulation may account for the impairment observed once T-cells of obese individuals are exposed to influenza. The pathway upregulating mTOR is also known to be stimulated by growth factors, such as those circulating in high amounts in obese individuals. Due to the fact that chronic stimulation of T-cells results in reduced T-cell proliferation and effector function12, it is possible that chronic stimulation of T-cells of obese individuals by excess nutrients is resulting in cellular dysfunction thus preventing adequate response to influenza infiltration.
Clearly, activities of mTOR are dominant in T-cells of obese individuals. Although an inhibitor of mTOR, AMPK seems unable to shift cells to metabolism that characterizes resting T cells. Metformin, the best treatment for obese Type-2 diabetes, reduces blood sugar levels by activating AMPK and has been implicated as influencing immune cells. B-cells have been found to express higher levels of antibodies when exposed to metformin.14 Additionally, metformin has been found to activate AMPK in T cells, as well as increase memory T cell formation.15 Metformin’s ability to inhibit mTOR, via AMPK, may provide a way to shift activated T-cells of obese individuals back to a resting metabolic state in order to restore cellular function and improve immune response. To assess metformin influence on the metabolism of T-cells of obese individuals, this study examined mRNA expression of GLUT-1, CPT-1, and LDH in T-T-cells unstimulated compared to T-cells stimulated with influenza virus. We hypothesized that the T-cells exposed to Metformin will express higher mRNA levels of CPT-1 and lower mRNA levels of GLUT-1 and
5
Chapter 2: Methods and Materials
Study Design
The Beck lab has been conducting a large prospective observational study since 2009. Participants of the study were recruited from the University of North Carolina at Chapel Hill Family Medicine Center, an academic outpatient primary care facility. All participants of this study were adults who received their annual trivalent inactivated influenza vaccine for the respective year of the study. During this study, blood was drawn before vaccination and 30 days post-vaccination. Exclusion criteria were immunosuppression, self-reported use of immunomodulator or immunosuppressive drugs, acute febrile illness, history of hypersensitivity to any influenza vaccine components, history of Guillian-Barre syndrome, or use of theophylline preparations or warfarin.5 All procedures were approved by the Biomedical Institutional Review Board at the University of North Carolina at Chapel Hill.1
At enrollment, informed written consent, demographic characteristics, height, weight, and a blood sample were obtained. Next, a single dose of the trivalent inactivated influenza vaccine was administered in the deltoid muscle. Body mass index (BMI) for each participant was calculated and defined as healthy weight (BMI of 18.5-24.9), overweight (BMI of 25-29.9), or obese (BMI of ≥ 30). Participants then returned 30 days later for a post vaccination blood draw. Blood samples were processed into serum and peripheral blood mononuclear cells (PBMCs).
6
PBMC Isolation and Stimulation
Frozen PBMC samples were retrieved from -195°C liquid nitrogen tanks and thawed in a 37°C water bath. One mL of RPMI-1640 cell culture media was added to thawed PBMCs, mixed by pipet, and transferred to a 15 mL conical tube. Tubes were centrifuged and PBMCs pellets were resuspended in 1 mL of cell media. Cells were allowed to rest for 3 hours at 37°C and 5% CO2. Cells were then divided into three conditions: unstimulated, influenza stimulated, and ConA (positive control) stimulated. Twenty μL
of H1N1 virus were added to PBMCs of influenza stimulated condition and allowed to rest for 66 hours. Two μL of ConA (1μg/μL) were added to PBMCs of positive control condition and allowed to rest for 48
hours. PBMCs rested at 37°C and 5% CO2. After resting period, PBMCs were centrifuged and stored, without media, in -80°C until needed for RNA extraction.
Total RNA Purification and RT-qPCR
Cell pellets were resuspended in TRIzol to lyse cells and release cell components, including RNA. Total RNA was separated, isolated, purified, and quantitated. Total RNA was diluted into 10 μL
RNAase-free water and stored at -80 °C until use. Using RT-qPCR, mRNA expression of CPT-1, GLUT-1, and LDH was measured. β-Actin was used as control. Reactions were conducted in PCR 96-well plates and run in
BIO-RAD thermocycler. The iScript™ RT Supermix was added to total RNA samples to synthesize cDNA. Samples were then diluted and gene-specific primers and iTaq™ Universal SYBR® Green Supermix added. Samples were then loaded into rt-PCR instrument and amplification occurred. Reagents and primers were from BIO-RAD.
Statistical Analysis
Mean comparisons in Figure 1 were performed by multiple t-tests. Mean comparison in Figure 2 and Figure 3 were performed by Welch’s t test (unpaired). GraphPad Prism version 7 software was used
7
Chapter 3: Results
In this study, we measured mRNA expression for specific metabolic genes using Ct values
produced during RT-qPCR. The Ct value corresponds to the number of cycles required for mRNA levels to be detected and thus exceed a background level. Ct levels are significant because they are inversely proportional to the amount of target nucleic acid in the sample. Therefore, lower Ct values correspond to higher mRNA levels of the target gene.
3.1 No significant difference in mRNA expression of GLUT-1, CPT-1, and LDH observed between OB+MET and OB groups
When comparing obese subjects taking Metformin to those not taking Metformin within each PBMC condition, there were no significant differences in the mRNA expression of each key protein (GLUT-1, CPT-1, and LDH). Still, the OB+MET group demonstrated higher levels GLUT-1, CPT-1, and LDH mRNA in unstimulated and flu stimulated PBMCs. This trend remained true except in the mRNA expression of GLUT-1 by influenza stimulated PBMCs of the OB group. Once stimulated, PBMCs of the OB group began to express more GLUT-1 mRNA compared to the OB+MET group, but mRNA levels of CPT-1 and LDH remained lower compared to the OB+MET group (Figure 1).
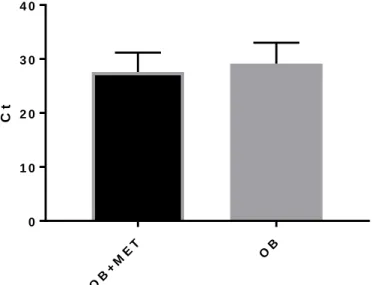
3.2 OB+MET group showed higher overall mRNA expression compared to OB group in unstimulated PBMCs
8
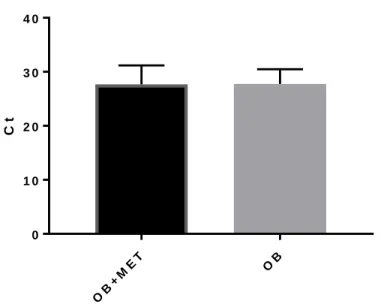
3.3 OB and OB+MET showed same overall mRNA expression in influenza stimulated PBMCs
Influenza stimulated PBMCs of both obese individuals taking Metformin and obese individuals not taking Metformin expressed equal amounts of total mRNA (Figure 2).
3.4 CPT-1 mRNA expression was higher in the OB+MET group in both unstimulated and influenza stimulated PBMCs
In both the unstimulated and influenza stimulated conditions, PBMCs of the OB+MET group expressed higher levels of CPT-1 mRNA compared to PBMCs of the OB group (Figure 1). For
unstimulated cells, OB+MET group (Ct=26.87) compared to OB group (Ct=28.25). For influenza stimulated cells, OB+MET group (Ct=27.17) compared to OB group (Ct=28.34).
3.5 GLUT-1 and LDH mRNA expression changes in unstimulated PBMCs of the OB group when stimulated with influenza
Stimulation with influenza resulted in an increase in mRNA expression of both GLUT-1 and LDH in PBMCs of obese individuals not taking Metformin (Figure 1). Expression of CPT-1 mRNA remained the same after influenza stimulation.
3.6 mRNA expression of GLUT-1, CPT-1, and LDH in unstimulated PBMCs of OB+MET group was
unchanged with influenza stimulation
9
Chapter 4: Discussion
The threat that influenza infection imposes on the health of obese individuals is of serious concern. Currently, vaccination provides the best form of protection, but is less effective in obese individuals. With a significant amount of the world’s population being obese, public health leaders must
develop a way of reducing the risk of infection in the obese population. Studies have demonstrated that the immune cells involved in fighting off influenza are impaired in obese individuals. T-cells responsible for targeting and ridding the body of infected cells have been found to be less active and dysfunctional in obese individuals, which may account for the fact that obese individuals are twice as likely to be infected with influenza despite vaccination.
The relationship between T-cell function and metabolism has been well documented and indicates that regulation of cell metabolism is influenced by whether T-cells are resting or activated. In the activated state, T-cell metabolism is characterized by aerobic glycolysis and an increase in
10
When we considered mRNA expression of GLUt-1, CPT-1, and LDH individually, we found that were no significant differences in expression between obese individual taking Metformin and those not taking Metformin, regardless of whether PBMCs were unstimulated or influenza stimulated. Still, other trends were observed that indicate Metformin influences T-cell metabolism. In unstimulated PBMCs, the group taking Metformin expressed higher mRNA levels of GLUT-1, CPT-1, and LDH. Knowing that fatty acid oxidation is predominant during the resting state, we expected CPT-1 mRNA levels to be higher in the OB+MET group assuming that Metformin would be able to return T-cells in an excessive glycolytic state to a resting metabolic state. Although mRNA levels of GLUT-1 and LDH were higher in Metformin-exposed unstimulated T-cells, which was not expected, the fact that the OB+MET group demonstrated higher mRNA levels indicates that Metformin is influencing in a way that merits further investigation.
11
further increase in expression of glycolytic proteins and may potentially be shielding T-cells from further damage and dysfunction.
As previously mentioned, GLUT-1 mRNA expression increased in the OB group once PBMCs were stimulated with influenza. Similarly, mRNA expression of LDH also increased under the same conditions. This was not observed for CPT-1. We understand both GLUT-1 and LDH to be involved in upregulated metabolism of glucose in the activated metabolic state of a T-cell. Again, it is apparent that further activation, via influenza stimulation, of already activated T-cells is occurring. It is resulting in an increase in mRNA expression of proteins involved in maintaining the glycolytic metabolic state. Not only is there an increase in mRNA of glucose transporters, but cells are also increasing mRNA levels of the enzyme that will help metabolize the glucose. These results suggest that there is no impairment in the regulation of mTOR in the absence of Metformin. This is important because of other observations that were made. We found that influenza stimulation did not influence mRNA expression of GLUT-1, CPT-1, and LDH in the OB+MET group. Unlike in the OB group, Metformin exposure seemed to maintain mRNA expression of key proteins at the same levels they were at before further activation.
These findings have considerable implications regarding the role of Metformin. It has been suggested that Metformin may serve a therapeutic role by returning activated T-cells to a resting metabolic state. Our findings depict that Metformin may actually prevent already activated T-cells from becoming even more activated and therefore increasing aerobic glycolysis. Considering the effects that further activation may have on T-cells, such as cell exhaustion, which may lead to additional impairment, these apparent effects of Metformin may be promising. We know that obese individuals have a
dysfunctional immune response when exposed to influenza. It is possible that this is due to the
12
obese individuals. Exposure to Metformin may prevent this threshold from being passed and allow T-cells to respond to infection.
Our study had several limitations. Importantly, we were unable to confirm whether subjects were actually taking Metformin at the time of blood draw. Despite having access to medical records, which stated if subjects were prescribed Metformin, we did not have any information on compliance. This is important since we are assuming that subjects were taking Metformin. Secondly, there may be genetic variability in how Metformin is metabolize by PBMCs. If different people metabolize Metformin differently, this will influence the role it plays within cells. Metformin may also be metabolized
differently by different types of immune cells. This raises another important limitation. In our study, we isolated a collection of immune cells. We evaluated both B-cells and T-cells. Therefore, we did not isolate specific types of T-cells and investigate the effects of Metformin. Metformin may have different effects on the metabolism of different types of T-cells, such as CD4 and CD8 T-cells. Finally, we also had a small sample size, which limited the power of our study.
13
Table 1. OB+MET group demographics Subject
No.
Sex Age Race BMI BMI
Category
Metformin
1 Female 31.6 African American
33.1 4 Yes
2 Female 31.9 African American
34.1 4 Yes
3 Female 42.0 African American
42.9 5 Yes
4 Female 43.7 African American
37.2 4 Yes
5 Female 44.7 African American
39.6 4 Yes
6 Female 46.4 African American
59.5 5 Yes
7 Female 50.8 African American
41.4 5 Yes
8 Female 51.1 African American
34.6 4 Yes
9 Female 51.9 African American
40.4 5 Yes
10 Female 52.8 African American
40.2 5 Yes
11 Female 53.0 African American
37.2 4 Yes
12 Female 54.0 African American
36.8 4 Yes
13 Female 55.0 African American
37.0 4 Yes
14 Female 55.6 African American
34.6 4 Yes
15 Female 56.1 African American
36.8 4 Yes
16 Female 61.7 African American
34.3 4 Yes
17 Female 51.3 Caucasion 43.8 5 Yes
18 Female 52.0 Caucasion 37.1 4 Yes
19 Female 52.6 Caucasion 32.4 4 Yes
20 Female 64.0 Caucasion 50.8 5 Yes
21 Male 45.3 African
American
42.2 5 Yes
22 Male 46.2 African
American
41.0 5 Yes
23 Male 60.0 African
American
31.3 4 Yes
24 Male 43.8 Caucasion 41.0 5 Yes
25 Male 44.8 Caucasion 41.0 5 Yes
26 Male 48.2 Caucasion 30.5 4 Yes
14
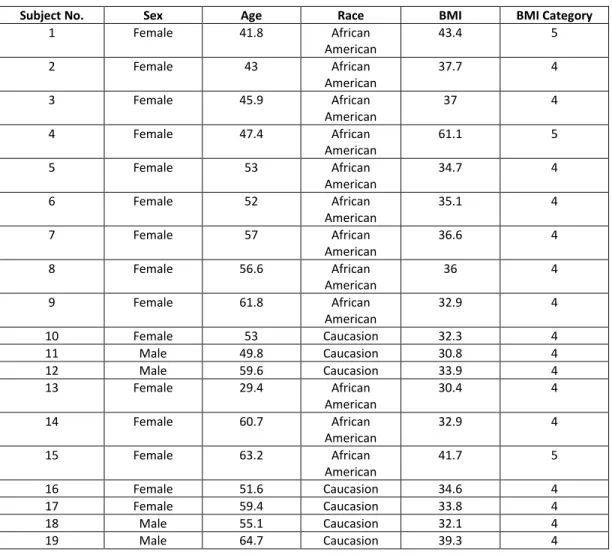
Table 2. OB group demographics
Subject No. Sex Age Race BMI BMI Category
1 Female 41.8 African
American
43.4 5
2 Female 43 African
American
37.7 4
3 Female 45.9 African
American
37 4
4 Female 47.4 African
American
61.1 5
5 Female 53 African
American
34.7 4
6 Female 52 African
American
35.1 4
7 Female 57 African
American
36.6 4
8 Female 56.6 African
American
36 4
9 Female 61.8 African
American
32.9 4
10 Female 53 Caucasion 32.3 4
11 Male 49.8 Caucasion 30.8 4
12 Male 59.6 Caucasion 33.9 4
13 Female 29.4 African
American
30.4 4
14 Female 60.7 African
American
32.9 4
15 Female 63.2 African
American
41.7 5
16 Female 51.6 Caucasion 34.6 4
17 Female 59.4 Caucasion 33.8 4
18 Male 55.1 Caucasion 32.1 4
19 Male 64.7 Caucasion 39.3 4
Table 3. Total Sample Subject Demographics
Obese Metformin-treated Diabetic Obese Non-Diabetic
Participants (n) 27 19
BMI (mean ± SE)
38.8 ± 1.2 36.6 ± 1.6
Age (mean ± SE)
50 ± 1.5 53 ± 2
Sex (M/F) 7/20 4/15
15
Un stim
ula ted Flu + Co nA 0 1 0 2 0 3 0 4 0
G L U T - 1
C
t
O B + M E T
O B Un sti mu late d Flu + Co nA 0 1 0 2 0 3 0
L D H
C
t
O B + M E T O B Un sti mu late d Flu + Co nA 0 1 0 2 0 3 0 4 0
C P T - 1
C
t
O B + M E T O B
Figure 1. mRNA expression of GLUT-1, LDH, and CPT-1 comparing OB+MET and OB groups under unstimulated, influenza stimulated, and positive control conditions.
16
OB +M
ET OB
0 1 0 2 0 3 0 4 0
O v e r a ll m R N A e x p r e s s io n o f F lu S t im u la t e d P B M C s
C
t
Figure 2. Comparing overall mRNA expression of influenza stimulated PBMCs
17
OB +M
ET OB
0 1 0 2 0 3 0 4 0
O v e r a ll m R N A e x p r e s s io n o f U n s t im u la t e d P B M C s
C
t
Figure 3. Comparing overall mRNA expression of unstimulated PBMCs
When considering unstimulated PBMCs, the OB+MET (Ct=27.57) group expressed higher levels of overall mRNA expression compared to the OB (Ct=29.15) group. Overall mRNA expression represents a
18 REFERENCES
1) Paich HA, Sheridan PA, Handy J, et al. Overweight and obese adult humans have a defective cellular immune response to pandemic H1N1 influenza A virus. Obesity (Silver Spring, Md). 2013;21(11):2377-2386. doi:10.1002/oby.20383.
2) Eknoyan G. A History of Obesity, or How What Was Good Became Ugly and Then Bad. Advances
in Chronic Kidney Disease. 2006;13(4):421-427. doi:10.1053/j.ackd.2006.07.002.
3) Obesity and overweight. World Health Organization.
http://www.who.int/mediacentre/factsheets/fs311/en/. Accessed April 27, 2018.
4) Tremmel M, Gerdtham U-G, Nilsson PM, Saha S. Economic Burden of Obesity: A Systematic Literature Review. Scuffham PA, ed. International Journal of Environmental Research and Public
Health. 2017;14(4):435. doi:10.3390/ijerph14040435.
5) Falagas, M. E., & Kompoti, M. (2006). Obesity and infection. The Lancet infectious diseases, 6(7), 438-446.
6) Maccioni L, Weber S, Elgizouli M, et al. Obesity and risk of respiratory tract infections: results of an infection-diary based cohort study. Rev. 2017;(Cci):1-13. doi:10.1186/s12889-018-5172-8. 7) Influenza (Flu). Centers for Disease Control and Prevention.
https://www.cdc.gov/flu/about/disease/burden.htm. Published April 19, 2018. Accessed April 27, 2018.
8) Influenza (Flu). Centers for Disease Control and Prevention.
19
9) Sheridan PA, Paich HA, Handy J, et al. Obesity is associated with impaired immune response to influenza vaccination in humans. International Journal of Obesity (2005). 2012;36(8):1072-1077. doi:10.1038/ijo.2011.208.
10)Neidich SD, Green WD, Rebeles J, et al. Increased risk of influenza among vaccinated adults who are obese. International journal of obesity (2005). 2017;41(9):1324-1330.
doi:10.1038/ijo.2017.131.
11)Powell JD, Delgoffe GM. The mammalian Target of Rapamycin (mTOR) provides a critical link between T cell differentiation, function and metabolism. Immunity. 2010;33(3):301-311. doi:10.1016/j.immuni.2010.09.002.
12)MacIver NJ, Michalek RD, Rathmell JC. Metabolic Regulation of T Lymphocytes. Annual review of
immunology. 2013;31:259-283. doi:10.1146/annurev-immunol-032712-095956.
13)Waickman AT, Powell JD. mTOR, metabolism, and the regulation of T-cell differentiation and function. Immunological reviews. 2012;249(1):43-58. doi:10.1111/j.1600-065X.2012.01152.x. 14)Diaz A, Romero M, Vazquez T, Lechner S, Blomberg BB, Frasca D. Metformin improves in
vivo and in vitro B cell function in individuals with obesity and Type-2 Diabetes. Vaccine. 2017;35(20):2694-2700. doi:10.1016/j.vaccine.2017.03.078.
15)Pearce EL, Walsh MC, Cejas PJ, et al. Enhancing CD8 T Cell Memory by Modulating Fatty Acid Metabolism. Nature. 2009;460(7251):103-107. doi:10.1038/nature08097.Enhancing.