Molly E. Bragg. “There is Always More That Can be Done”: A Survey Investigating Libraries’ Measurement of Digitized Primary Source Use. A Master’s Paper for the M.S. in I.S. degree. November, 2011. 54 pages. Advisor: Professor Christopher (Cal) Lee
This paper presents the findings of a survey seeking to discover if libraries are tracking the use of digitized primary source materials available on their websites. The survey was designed to address two research questions: whether libraries track the use of their
digitized primary source materials and, for those libraries that do track use, how they analyze and make decisions based on the usage data. Findings indicate that the
institutions sampled see the value of collecting usage data and a majority do collect usage data. However, the survey respondents report challenges to analyzing and making
decisions based on the data that they collect.
Headings: Archives
DIGITIZED PRIMARY SOURCE USE
by Molly E. Bragg
A Master’s paper submitted to the faculty of the School of Information and Library Science of the University of North Carolina at Chapel Hill
in partial fulfillment of the requirements for the degree of Master of Science in
Information Science.
Chapel Hill, North Carolina November 2011
Approved by
Table of Contents
Introduction...2
Literature Review...4
Methodology ...13
Findings ...17
Discussion ...32
Opportunities for Further Research ...35
References...36
Appendices...39
Appendix A: The Survey ... 39
Appendix B: Invitation to Participate ... 44
Appendix C: Benefits to Tracking and Analyzing Usage Data ... 45
Introduction
In the last few years more and more memory institutions have digitized unique items in their special collections and provided access to these items online. In a report published in 2010, OCLC Research found that 97% of their respondents had completed at least one digitization project and/or have an active digitization program for special
collections (Dooley and Luce, 2010). At the same time, tools like Google Analytics are making it easier to learn more about the people using the digitized cultural resources appearing online. However, archives in particular have been slow to use tools to monitor the use of their digitized collections. Best practices regarding the gathering and analysis of usage statistics have yet to emerge in archival literature. Anecdotal evidence shows that some institutions are monitoring the use of digitized items on their website, but for the most part they are not analyzing the data systematically. The goal of the survey discussed in this research is to first discover if institutions are tracking usage information and if so how they are analyzing this data internally.
This research focuses on memory institutions that provide access to digitized versions of portions of their collections of primary source materials online. The memory institutions include academic libraries, independent research libraries, public libraries, and national libraries. Surveyed organizations were chosen for this survey only if their institutional website provided access to digitized primary source materials.
Primary sources provide first-hand testimony or direct evidence concerning a topic under investigation. They are created by witnesses or recorders who experienced the events or conditions being documented. Often these sources are created at the time when the events or conditions are occurring, but primary sources can also include autobiographies, memoirs, and oral histories recorded later. Primary sources are characterized by their content, regardless of whether they are available in original format, in microfilm/microfiche, in digital format, or in published format.
(http://www.yale.edu/collections_collaborative/primarysources/primarysources.ht ml).
This study is only concerned with primary resources, not any other kind of digitized
content that may be available on a library or archives website. Primary sources, like
those described above are typically found in an archives or the special collections
division of a library. Therefore most of the literature reviewed for this study focuses on
archives. Additionally, in the context of this research then, the terms archive and library
are used interchangeably as many archives are part of a larger library.
The importance of this study is evident from reviewing literature related to this
topic. Since there are currently no best practices for institutions providing access to
primary source materials to gauge use and then base decisions off user behavior, this
study is a necessary first step in building such a community of practice. The OCLC
“taking our pulse” study reveals that institutions are putting a priority on digitizing
collections and providing access to them online. Understanding the use of these digital
resources can help librarians and archivists improve their services, as well as provide
Literature Review
Given the prevalence of digital projects taking place in special collections
libraries across the country as reported by the OCLC “taking our pulse” survey, it is
surprising to find that there is little literature looking at the use of these digital resources
over the Web. In fact several authors have remarked on this lack and mentioned that
although there has been a call for comprehensive user studies in archives, very few have
been successfully completed.1 There is however relevant literature about the importance
of studying archives users, and a few examples of use studies of archival resources
online. Additionally, other literature suggests that memory institutions are using log
analysis and web analytics tools to monitor the effectiveness of their websites. This
literature review will review work on these three topics.
Understanding and Measuring Use
Archivists recognize the key role the end user plays in the archival process. For
example, Maynard Brichford points out that preserved materials do not truly serve their
purpose until someone uses them; “the value of archives is wholly dependent upon the
existence of persons attaching value to them” (Brichford, 1977, p. 9). Brichford’s
statement is still essential to archivists and this can be inferred from the Society of
American Archivists code of ethics which states “archivists recognize their responsibility
to promote the use of records as a fundamental purpose of the keeping of archives”
(http://www2.archivists.org/standards/code-of-ethics-for-archivists). The use of records
1 This sentiment was expressed in both of the following: Prom, C. (2011). Using Web
then is essential to their existence and preservation. The importance of use has not
always been a universal archival value. However, it has been gaining relevance for the
past 30 years.
Before reviewing user studies in archives and libraries, it is important to think
about what constitutes use in the context of a library or archives website, how it can be
measured, and why it is important to study library and archives users. Jill Grogg and
Rachel Fleming-May point to three fundamental questions that professionals try to
answer when looking at resource use in libraries; they are, “how much is the library
used,” “who is using the library, “ and “what is the library being used for” (2010, p. 7).
The authors review traditional methods institutions employ to answer these questions
including studying circulation patterns, gate counts and reference questions.
Before Grogg and Fleming-May looked at studying users in libraries, a wave of
archival literature in the 1980s called for the voice of the user of archival materials to
have an influence in archival administrative decisions such as appraisal, processing and
description. Authors including Elsie Freeman, William Maher, and Paul Conway call for
user studies so archivists can learn more about their researchers and improve their ability
to work with patrons more effectively. Freeman for example writes that “we must learn
systematically, not impressionistically as is our present tendency, who are users are”
(Freeman, 1984, p. 112). William Maher likewise advocates looking at users to answer
four main questions. They are 1, “who uses the material,” 2, “what are the purposes of
the use,” 3, “what is the specific subject of inquiry of each user,” 4 “what records are
used” (Maher, 1986, 17-18). Additionally Paul Conway outlined a highly structured
access to archival resources, “users, information need and use” in 1986 (Conway, p.
395, 1986).
Freeman, Maher and Conway’s comments and questions are echoed in the current
literature. Specifically, Chris Prom continues to call for archivists to look at their work
and the way users interact with their collections systematically.2 Additionally, the
questions posed above by Jill Grogg and Rachel Fleming-May are very similar to what
Maher proposes asking archives users. The fact that these questions continue to be posed
speaks to the continuing need to for archives to study their users. New tools, such as web
analytics software make it easier to understand what patrons are viewing online and this
opens up further possibilities for new types of user studies. This research investigates
whether archives are using these tools and addressing the questions and directives raised
by Freeman, Maher, Prom, Grogg and Fleming-May.
Challenges in Studying Use
Paul Conway asserts that the reasons archivists have not studied their users is “not
so much a problem of will as a problem of method” (Conway, p. 395, 1986). Conway’s
idea that archivists need better tools to conduct user studies has been given new emphasis
in the Archival Metrics program (http://www.archivalmetrics.org/). Prior to starting
Archival Metrics, Wendy Duff and her team led focus groups with archivists and found
2 Chris Prom calls for a systematic approach to archival processing in “optimum access?
that the participants felt pressure to obtain more information about their users including
their level of satisfaction with archival resources as well as usage statistics. Obstacles
holding archivists back from getting this information included a lack of skills to conduct
user studies, and a lack of standard metrics institutions could use to measure use and
compare results (Duff et al., 2008). One of the main objectives for creating and
disseminating the Archival Metrics program is to determine if archivists will conduct
more use and user analysis if they had the tools (Duff et all, 2010).
The Archival Metrics program contains toolkits for conducting research and
guidance as to how to analyze findings. Pilot testing and surveys conducted by Duff and
her team revealed mixed results and attitudes about the toolkits. Institutions were pleased
to have access to the toolkits, however a portion of those surveyed were not able to
conduct user studies using the toolkits because of a “lack of time, lack of expertise, and
lack of administrative support” (2010, p. 590). Additionally, institutions that conducted
studies as part of the pilot tests were very satisfied with the results, but had substantial
assistance from Wendy Duff and her team in both the administration and analysis of the
studies (2010). This suggests that archives continue to be unprepared to study their users
systematically even when the necessary tools are available to them. The Archival Metrics
project is ongoing, so there may be more tests conducted in the coming years. The
program does not address best practices for usage statistics, but perhaps this could be
included in the future as more institutions reveal how they study this kind of data.
Another factor that can hold institutions back from learning more about their users
is a fear of collecting negative responses. This sentiment came up in Wendy Duff’s focus
groups, where “the majority [of participants want] feedback to support their programs
The risks of conducting user studies is also discussed by William Jackson in his article,
“the 80/20 archives: a study of use and its implications” (1997). Studying call slips at his
institution, Jackson’s findings were consistent with a landmark library bibliometrics
study by Richard Trueswell where he found that 20% of the holdings receive 80% of the
use by patrons. The article discusses what this kind of realization means to an archive;
for example, Jackson states, “80% of storage space, processing, staff time and other
resources have been for no apparent purpose” (p. 3). With statistics like those cited by
Jackson, it is understandable that archivists fear that knowing more about use could cause
a reduction in funding, not an increase.
Use and Usability Studies
Despite the challenges and possible risks in conducting user studies, archives have
been employing them to solicit feedback regarding specific aspects of their practices.
These studies are not as comprehensive as the framework Paul Conway advocates, but
they do show that archivists want to know how their patrons interact with archival finding
aids and websites.
A number of usability studies have been performed in recent years that examine
how users interact with finding aids. In these studies, archivists design tasks for test
subjects to complete in the hopes of revealing issues or challenges with the website or
finding aid. There are many such studies testing interaction with finding aids and they
have come from a number of different angles, such as using test subjects with higher
users.3 These studies have revealed a wealth of information to archivists about how the
public interacts with online finding aids and the inherent challenges therein.
With the increase in access to digitized primary source materials over the Web,
professionals have the opportunity to employ usability study techniques on a broader
range of archival tools and practices. One such study was performed by University of
North Carolina, Chapel Hill masters student Tracy Jackson. She looked at how users
interact with digitized photographs in UNC special collections where access to the
images is through a finding aid interface (Jackson, 2011). Her study employs
methodology very similar to that used in many of the finding aid usability studies. This
study is an excellent example of how surveys and usability testing methods can be used
to look at how the public interacts with digitized resources and not just the finding aids.
User studies like Jackson’s, the finding aid studies, and even the models described
in the literature mentioned from the 1980s are essential to understanding users of primary
source materials, however by definition they will always focus on a small subset of users.
Examining web site logs and analytics however can provide data on all users of digital
resource; although like user studies, this approach also has benefits and limitations.
3 Examples of usability studies are numerous in archival literature. A few examples
include: Altman, B. & Nemmers, J., (2001). The Usability of On-line Archival
Several papers and projects employ log analysis or web analytics tools for use
studies in the library or archives context. The first is a study using log analysis to
determine the use and importance of research centers and digital finding aids in scholarly
research within several digital humanities centers (Warwick, C. et al., 2008). The
relevance of this research for the purposes of the present proposal exists in the discussion
of studying web logs. The researchers are very frank about the benefits and limitations of
working with web logs. For example, the team found that location data from the logs
misleading given that most of the web traffic is routed through servers that are not in the
same location as the actual users, but the logs were excellent at pointing out user behavior
on the websites (Warwick et al., 2008).
Another example of using web logs to study digital archives users can be found in
Diane Harley and Jonathan Henke’s article “toward an effective understanding of website
users” (2007). In this study the authors compared information about website users
through online surveys and by reviewing web logs. Harley and Henke point out two key
advantages of using web logs to study site usage; “[web logs capture] actual behavior of
real users” and web log “records behave passively without requiring users’ active
participation” (p. 4, 2007). This notion is central to the benefits that working with web
logs or web analytics can provide for archivists. In the case of Harley and Henke’s study,
they captured much more data from web logs than survey participants. Additionally, they
found that many of the survey participants were first time site users, whereas web logs
captured the behavior of all users of the site (2007).
Libraries and archives have found off-the-shelf web analytics tools to be a
user-friendly alternative to log analysis. In particular, some institutions are turning to Google
Articles published based on studies involving Google Analytics seem to fit the models
described by authors like Stephan Turner (2010) and Beatriz Plaza (2010). Both authors
write about using Google Analytics to optimize library and other information based
websites. Using analytics data in this way echoes one of the goals of traditional user
studies as stated by Roy Turnbaugh in 1986. Turnbaugh writes that user studies are best
for internal “self-diagnosis” and “become less reliable when they are used to justify
programs to authorities outside the archives” (1986, p. 27). Therefore although there are
new tools to analyze website effectiveness and user interactions with archival resources,
professionals’ goals have not changed.
Chris Prom recently published a case study in which he and his team used Google
Analytics data as the basis for making website improvements to increase usability (Prom,
2011). Access then to Google Analytics data is one way to understand how patrons are
using online resources, and then to make decisions to benefit the users’ experience.
Similarly, a white paper written by Joyce Chapman of North Carolina State University
describes how she and her colleagues used Google Analytics to test the effectiveness of
metadata in their collections (Chapman, 2011). Another recently published study
demonstrates how Google Analytics can be used to find out how patrons discover
materials and finding aids on the Washington State University Libraries special
collections website (O’English, 2011).
The findings listed above (from Warwick, Harley and Henkle, Prom, Chapman,
and O’English) demonstrate how log analysis and web analytics tools can provide a
wealth of information about which resources are being used and how often. These tools
can also reveal general information about a user such as where they are accessing the site
not always address the level of use being performed. Grogg and Fleming-May point
out that although someone may check out a book, this statistic does not actually reveal if
they read the book or how it was used in research; they assert that “usage is a statistical
measure of use, regardless of what that ‘use’ is, or the outcome it has” (Grogg and
Fleming-May, p. 9, 2010). Librarians and archives are aware of this trade off when
thinking of usage statistics and the impact materials make on the user, and this attitude is
evident in the literature. The following examples discuss methods of gauging the use and
impact of primary source materials other than log analysis or web analytics.
The Oxford Internet Institute (OII) conducted impact studies on several projects
funded by the Joint Information Systems Committee (JISC) and included digitized
primary source materials. Although reporting usage statistics was part of the OII’s
report, the emphasis was clearly on the more qualitative information gathered from the
project designers and users through feedback and interviews (Meyer, 2011). The report
provides a comprehensive look at the ways digital collections have been used by
researchers and the general public, and it is very effective as an argument that there is a
large audience for digitized primary source collections. However, tracking down users
and interviewing them for this report must have been a time-consuming process that may
not have been possible without special funding from JISC. Also, the Oxford Internet
Institute, and not the institutions that originally put the materials online performed the
analysis. Given these circumstances, such a study would be difficult for other institutions
to replicate. However, institutions may be checking their logs and using products like
Google Analytics to understand some aspect of the impact of the collections given the
Additionally, some institutions use other measures to account for the impact of
their collections, including taking advantage of Web 2.0 technology. The Library of
Congress and the Smithsonian Institution studied the impact of providing access to
images from their collections through the Flickr Commons project
(http://www.flickr.com/commons/). The Library of Congress found that the public was
able to add value to the images by providing comments that were later integrated into
Library of Congress descriptions (Springer et al., 2008). Similarly, the Smithsonian
found that the digitized photographs they made accessible through Flickr Commons were
much more highly accessed than they had been on the Smithsonian website (Kalfatovic et
al., 2008). While both of these cases are not examples of traditional notions of use, they
show the public interacting with the materials, which can be considered use in its broader
implications. Measuring use by looking for interactions therefore may be a valid way to
demonstrate use, however again there is little guidance in the professional literature
teaching archivists and librarians what to look for or how to measure and demonstrate
results.
The dearth of digital use studies on primary source materials must be a challenge
to librarians and archivists who are not sure where to get started when looking for
indicators of the use and impact of their materials. Although Prom especially provides a
model professionals can use, his is only one example. The findings of this survey should
help to begin filling the void of literature on the use of digitized primary source materials.
Methodology
The goal of this study was to investigate if and how memory institutions track and
solicit information about use-tracking practices from academic libraries, independent
research libraries, public libraries, and national libraries both in the United States and
abroad. Most of the participating institutions were selected from the Association of
Research Libraries and the Online Computer Library Center’s research online
membership lists. Only institutions that provide access to digitized primary source
materials received a copy of the survey. I administered the survey using Qualtrics survey
tools (http://www.qualtrics.com/). The survey includes questions regarding motivations
for collecting usage data, if and how it is collected, which staff within an institution
handles the information, and what kinds of decisions are made using this data; a copy of
the survey can be found in appendix A.
Online surveys, as a research tool, provide a number of benefits. Joel Evans and
Anil Mathur discuss several of the strengths in using online surveys (2005). According
to the authors, online surveys allow researchers to reach a global audience very easily
given the wide scope of the Internet. For the purposes of this research, conducting an
online survey was the best way to reach out to a wide range of institutions in a short time
period. Additionally, Martine Van Selm and Nicholas W. Jankowski show that online
surveys can be more effective than other methods when researching specific populations
(2006). An online survey is an especially effective tool for the present research; it is an
excellent match for soliciting information from institutions who have and may be
monitoring their collections of primary source materials accessible over the Web as they
are likely familiar and comfortable with online tools and analysis.
The bulk of the institutions chosen to complete this survey were selected from a
convenience sample of the member institutions belonging to the Online Computer
Libraries (ARL). Both organizations have publicly available lists of member
institutions on their websites. ARL and OCLC Research members were chosen as the
population base, because they have been the subjects of surveys in the past such as the
OCLC’s “taking our pulse” report (2010). Given previous research conducted using
these groups, I predicted that these particular institutions could be more receptive to
online surveys than institutions discovered indiscriminately through online searches.
To select institutions to invite to participate in the survey, I reviewed the website
of each ARL and OCLC Research member to look for digitized primary source materials.
I looked for items such as photographs, maps, audio-visual materials, letters, diaries, and
personal papers in the “special collections and archives” and “digital collections” areas of
library websites. If I was able to locate these items on the website within 5 minutes, the
institution was selected for the study. Institutions that provide access to primary source
materials solely as part of a virtual exhibit were not included in the study. Although
exhibits are a vital part of libraries’ outreach efforts, the use of materials is defined by
their specific context as being part of an exhibit. For this study I was more interested in
institutions that provided access to their primary source materials without an exhibition
context imposed on them.
Once I selected an institution for participation, I searched the website for a
specific contact to whom I could send the survey invitation. These contacts for the most
part were the heads of special collections, heads of a digital scholarship or initiatives,
digital projects archivist / librarian or general email address for the special collections or
digital projects department depending on what contact information was available. I also
filled out contact forms on institutional websites asking for their participation in the
membership lists to participate in the survey; the invitation email can be found in
appendix B.
Institutions were also invited to participate through several Society of American
Archivists (SAA) electronic mailing lists. I sent invitations to participate to the main
archives and archivists mailing list ([email protected]) as well as the
metadata and digital object roundtable mailing list ([email protected]).
Interested participants were asked to contact me directly for a link to the survey.
Thirteen institutions indicated their willingness to participate in the survey as a result of
these outreach efforts, bringing the overall total of institutions invited to participate in the
survey to 147.
The survey includes 17 questions and was designed in three sections; a copy of
the survey is available in appendix A. The first section is designed to solicit basic
information about the institutions, such as name, type, size and types of materials
available online. This section contains four questions and ends by asking if the
respondents collect usage information about their digitized primary source materials
available online. If respondents answered no to this question, they were directed to the
second section of the survey. Section two includes three questions, and is only to be
completed by respondents who have indicated that they do not collect usage information.
It asks them for some reasons why they do not track use, and if they plan to do so in the
future. They were also asked for the size of the collections in terms of number of objects.
Respondents who reported that they do collect and track usage statistics (defined
by a “yes” answer to question four) were directed to the third area of the survey, which
includes 11 questions. Section three asked respondents to identify the tools they use to
what types of decisions are made on the basis of the usage data. There are also several
questions giving the institutions the opportunity to express general comments about the
process of collecting and analyzing usage statistics, as well as a question about the
approximate number of objects within the institutions online collections.
As mentioned previously, I used Qualtrics software to conduct the survey.
University of North Carolina, Chapel Hill students have free access to Qualtrics through
the Odum Institute for Research in Social Science
(http://www.irss.unc.edu/odum/jsp/home.jsp). Qualtrics is the tool they use for all survey
research and is a trusted product for use in social science research such as the present
investigation. The survey tool insures anonymity and also provides results and reports
based on respondents answers. The Qualtrics system was very simple to set up; only one
survey respondent reported a technical problem in taking the survey and this issue was
easy to resolve. Additionally, the Qualtrics system allowed the surveys sections to be
structured in such a way that respondents completing section two did not have to scroll
through section three and vice versa. This organization likely made the survey easy to
complete without confusion as to which questions to answer.
Findings
The survey was available through Qualtrics from October 13, 2011 until
November 1, 2011. During that time 55 institutions began the survey. Six institutions
either did not enter any data or only entered their name and institution type, and these
institutions that completed at least section one of the survey, for an overall response
rate of 33%.
Of the 49 participants nine (18%) said they do not track usage information and 40
(82%) said that they do. Google Analytics was listed as the primary tool used for
tracking usage information. Survey answers also revealed that participants want to do
more with their usage information, and that they are not taking full advantage of the
opportunities this data presents currently. Additionally, the individuals and departments
responsible for collecting and analyzing usage data differ between institutions. These
and other findings addressed are organized by survey section in the following.
Section I
The first portion of the survey was completed by 49 respondents, and the goal of
this section was to learn the type of institution responding and the materials that they
make available online. Although the question as to the size of the online collection was
not explicitly part of section one, it was a question posed to all institutions (both in
section two or three) and will be discussed here along with other results from section one.
Participating Institutions by Type.
Type of Institution Response %
Large Academic Library 22 45%
Medium Academic Library 11 22%
Other 10 20%
Government Institution 4 8%
Small Academic Library 2 4%
Total 49 100%
A range of institution types participated in the survey, see table one. Institutions
that identified themselves as “other” included public libraries, independent archives,
independent libraries, national libraries, research libraries and a library consortium. Five
of the respondents represented international libraries, and the rest consisted of institutions
within the United States. The location of each institution could be identified by its name,
however I am not including the names of participating institutions in this report.
Primary Source Material Types.
Material Type Response %
Photographs 48 98%
Manuscripts 44 90%
Rare Books 39 80%
Audio Materials 32 65%
Cartographic Materials 32 65%
Moving Image Materials 27 55%
Other Visual Materials 23 47%
Artifacts/Realia 23 47%
Other 7 14%
Table 2, Types of Digitized Primary Source Materials Available on Participant Websites (Question 3)
Institutions were asked to identify the types of primary source materials they
provide access to online, see table two. There were a number of types of content from
which to choose, and institutions were able to click more than one category. Institutions
that selected the option for “other” filled in the following materials: “local
publications”(R29), “architectural drawings”(R30), “documents”(R35), “Ephemera
(leaflets, etc), philatelic material, newspapers”(R36), “research materials; data sets;
theses, etc”(R37), “newspapers, magazines”(R40), and “newsletters”(R43).4 The fact that
“data sets” was listed as a primary source material type suggests that the wording of this
4 Participating institutions were randomly assigned numbers R1-R49, and will be cited by
question might have confused some participants. Additionally the percentage of
institutions with digitized manuscript collections was surprising, although no statistics
could be found to substantiate or contradict the possibility that the data is representative
of special collections libraries. The objective in question three was for institutions to
only list primary source materials that were digitized, not items with digitized
descriptions such as finding aids or any kind of born-digital content. Finding aids and
data sets are digital resources, but they were not the intended materials of this study.
Size of Participating Institutions’ Digitized Collections.
Number of Items Response %
0-9,999 10 26%
10,000-49,999 7 18%
50,000-99,999 10 26%
100,000-299,999 4 10%
300,000-599,999 3 8%
600,000-999,999 0 0%
Over 1,000,000 3 8%
No Number Given 2 5%
Total 39 100%
Table 3, Number of Digitized Items Available on Participant Websites (Questions 7 and 18)
Both section two and three of the survey included identical questions about the
size of the institutions’ digital holdings (questions 7 and 18). This was a fill in question,
and did not include pre-set number ranges from which institutions could select. I
grouped responses into easy to understand categories while preparing these findings, see
table 3. Participants who did not list figures in their answers expressed confusion
regarding the definition of item.
Of the results, two respondents listed vague item counts; these answers are
within the range option under 10,000 in table three. In contrast some figures listed
were very exact, for example one respondent listed their item count as “297,996” (R37).
The largest item counts include an archive of 13 million documents as well as collections
of digitized newspapers ranging from 4-6 million items (R36 and R38). The size of the
institution does not correlate with whether they track use statistics or not; institutions
with varying number of items both tracked and did not track usage statistics.
Section II
A total of nine institutions answered question number four with a negative
response, which means they do not track usage data. Eight of these participants
completed section two of the survey. The goal of section two was to uncover the reasons
institutions do not track use and if participants intend to begin such an initiative in the
future.
Reasons for Not Tracking Usage Data.
Reasons for Not Tracking Usage Data Response %
Lack of Interest by Management 3 38%
Limited Technical Infrastructure 3 38%
Limited Funding 0 0%
Limited Time 0 0%
Other, Please Describe 2 25%
Total 8 100%
Table 4, Reasons for not Tracking Use (Question 5)
Respondents cited limited technical infrastructure and lack of interest by
management as the primary reasons for not tracking usage data, see table four. Two
respondents listed “other” reasons for not tracking or analyzing usage statistics; although,
related to technical infrastructure. One respondent stated that their “repository just
launched” (R19), and the other said that their management tool did not measure usage
data in a “quantifiable or useful” way (R24). Therefore this sample suggests that issues
relating to an institution’s technical infrastructure are the leading reasons institutions do
not collect usage information for their digitized collections of primary source materials.
Tracking Use in the Future.
Plans to Track Usage Data in the Future Response %
Yes, Please Explain Why 6 75%
No, Please Explain Why Not 2 25%
Total 8 100%
Table 5, Institutions’ Responses to if they will Begin Collecting Usage Data in the Future (Question 6)
When asked if they would track usage data in the future (question six), 75%or six
of the eight respondents said they would, see table five. Reasons for wanting to collect
usage data as reported by respondents include “will provide useful data to help plan
future projects” (R9), “justify our work” (R17), and “gauge user interest in certain
material to inform future digitization projects” (R19). Two respondents also stated that
technical projects would be completed shortly and they would begin tracking use at that
time (R10 and R24).
Of the two respondents who stated that they would not track use, one reiterated
that a management policy prevents them from keeping statistics; they personally would
like to track use, but they “don’t make the decisions” (R28). The other participant who
does not intend to track in the future stated that they their institution does not require
usage data (R5). Despite these two responses, a majority of institutions that do not track
use see the value in such an exercise or are working actively to create systems enabling
future mirrors reasons why institutions do track this information as reflected by
responses in section three of this survey.
Section III
Institutions collecting usage data completed section three of the survey. This
section solicited details from the institutions regarding which tools they use to track and
collect use data, what information is most important to the institutions, what decisions are
made based on this information, who within the organization is charged with working
with the data, and any other general comments institutions would like to share on their
work with usage data.
Collecting Usage Data.
Method for Collecting Usage Data Response %
Web Analytics Software, Please List
the Product Name 25 76%
Log Analysis 6 18%
Other, Please Describe 2 6%
Total 33 100%
Table 6, Methods for Collecting Usage Data (Question 8)
The first question of section three (question eight) asked institutions about tools
they use to track usage data. Of the 33 participants that answered this question, 76% of
respondents use analytics data and 18% perform log analysis, see table six. In the
literature review section of this report, I compared log analysis to web analytics software.
Given the ease with which analytics software can be set up on institutional websites, it
was my hypothesis that most institutions would take this approach, and the data
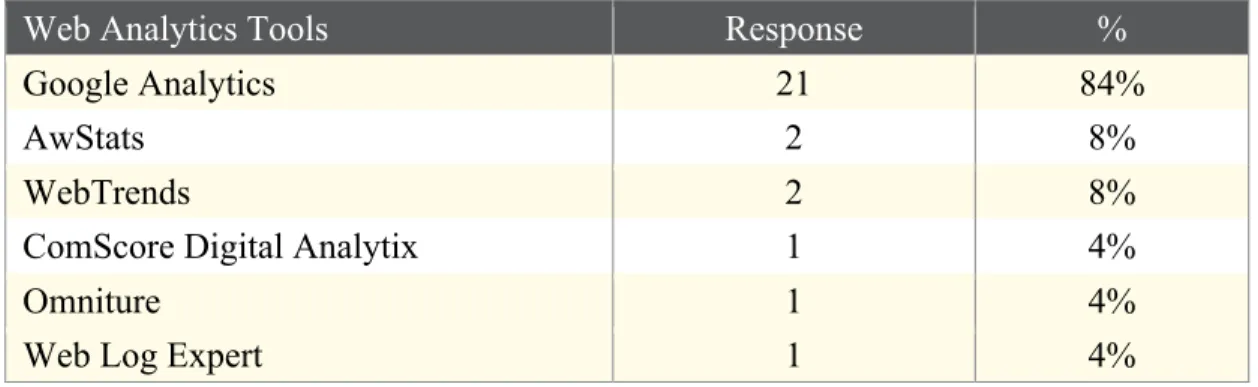
Google Analytics is the predominant web analytics tool institutions in this
survey use to collect usage data, see table seven. Two institutions (6%) stated that they
use methods other than web analytics or log analysis, and of these one used a
combination of analytics tools and ContentDM (R12) and the other used digital library
software called SobekCM, which originates at the University of Florida (R34).
Web Analytics Tools Response %
Google Analytics 21 84%
AwStats 2 8%
WebTrends 2 8%
ComScore Digital Analytix 1 4%
Omniture 1 4%
Web Log Expert 1 4%
Table 7: Types of Web Analytics Tools Used by Respondents (Question 8)
Respondents were asked to choose the most valuable data point or metric
provided by web analytics and log analysis in question ten, see table eight. Of the six
respondents that selected the “other option” one institution did not specify a metric, two
selected “item views” (R12 and R36), one listed “page views per number of items” (R21)
and two mentioned that they use a variety of metrics (R3 and R37). It is interesting to
note that so few participants listed incoming links as the most valuable data point given
that this was a major emphasis of one of the published studies where institutions used
Google Analytics (O’English, 2011). Additionally looking at search terms has been the
subject of work published in the last year as well, for example, Morgan Daniels and
Elizabeth Yakel’s article “seek and you may find: successful search in online finding aid
systems” and it was also chosen by minority of participants (2010). It is possible that
institutions do look at these measures, however this question asked for only the most
Data Point or Metric Response %
Page Views 12 36%
Visits 10 30%
Other, please describe 6 18%
Referring Web Sites 2 6%
Search terms/keywords 2 6%
Average Time on Site 1 3%
Bounce Rate 0 0%
Total 33 100%
Table 8, List of Most Valuable Usage Data Points or Metrics (Question 10)
In addition to using log analysis and web analytics for tracking use, most of the
institutions reported using informal methods of measuring use as well (question nine), see
table nine. One participant selected other, but reiterated their use of log analysis (R22).
Participants were able to select more than one option in this question. Although this
information is valuable, it would be even more relevant to understand how partners rate
these observations of use compared to the usage statistics produced by analytics and logs.
This is a limitation of the current studies timeline as there was no time for follow-up
interviews after the survey.
Other Techniques for Measuring Use Response %
Anecdotal (for example, you might hear professors or students talk about using digital collections)
29 88%
User Feedback 21 64%
Remote reference inquiries 20 61%
By monitoring Web 2.0 features such as
comments 11 33%
Citation Analysis 2 6%
I only use the solutions listed in question 8 2 6%
Other, Please Describe 1 3%
Staff or Department Responsible for Tracking and Analyzing Usage Data.
Department Responsible for
Tracking Usage Data
Response %
Other, Please Describe 15 45%
Digital Production Center 7 21%
Information Technology Services 6 18%
Not a formal responsibility at my
institution 5 15%
Collection Development 0 0%
Research Services 0 0%
Technical Services 0 0%
Total 33 100%
Table 10, Department Responsible for Tracking Usage Data (Question 11)
Department Responsible for
Analyzing Usage Data
Response %
Other, Please Describe 18 53%
Not a formal responsibility at my
institution 7 21%
Digital Production Center 7 21%
Information Technology Services 1 3%
Research Services 1 3%
Collection Development 0 0%
Technical Services 0 0%
Total 34 100%
Table 11, Department Responsible for Analyzing Usage Data (Question 12)
In terms of staff or department responsible for tracking and analyzing usage data
(questions 11 and 12), answers showed a range of variation. The majority of respondents
selected “other” in answer to both who tracks and who analyzes use data at their
institution, see tables 10 and 11. The “other” options for tracking use included some
very vague job titles such as “archivist” (R2), “digital archivist” (R7), and “archives and
shared among several departments (R20 and R41). However others responded with a
more specific title or department: “information officer position” (R13), “digital research
and curation center” (R14), “library assessment” (R15), “user assessment / MIS” (R16),
“site manager” (R35), “digital and marketing operations” (R36), “executive support”
(R38) and “individual units” (R39). Likewise, a majority of institutions selected “other”
in regards to who has the responsibility of analyzing usage data. The job titles and
departments listed under other in question 12 were almost identical to the answers given
in response to the previous question. The few differences listed were “county
government” (R2), “web services” (R18), “digital initiatives” (R15), “web analyst”
(R36), and “web publishing branch (sub division of IT)” (R38).
Over 2/3 of the respondents answered questions 11 and 12 identically, meaning
that at these institutions the same department or specific person is responsible both for
tracking and analyzing usage data. Answers given by the nine institutions that listed
differences in responsibility between tracking and analyzing statistics can be seen below
in table 12. One institution only answered question 12, and given that they filled in “rare
Respondent Tracks Usage Data Analyzes Usage Data
R4 Information Technology Services Other: Director of Project Management and Assessment
R18 Information Technology Services Other: Web Services
R26 Information Technology Services Other: Special Collections
R31 Not a Formal Responsibility Digital Production Center
R32 Digital Production Center Not a Formal Responsibility
R36 Other: Digital and Marketing Operations Other: Web Analyst
R38 Other: Executive Support Other: Web Publishing Branch
(sub division of IT)
R41 Other: A mix of departments, some research services, some IS Research Services
R42 Information Technology Services Not a Formal Responsibility
Table 12: Areas of Responsibility for Tracking and Analyzing Usage Data (Questions 11 and 12)
Current and Future Roles of Usage Data.
Most Important Role of Usage Data Currently Response %
Part of general statistics reported to
administration 14 42%
Digitization decisions 7 21%
Justify Funding 5 15%
Website Redesign Decisions 4 12%
Other 3 9%
Track copyright issues 0 0%
Total 33 100%
Table 13: Current Role Usage Data Plays at Institution (Question 13)
The survey prompted respondents to select the most important role usage data
currently plays at their organization, see table 13. Given the emphasis on using Google
Analytics to aid in re-designing websites discussed in the literature review, it is
interesting to note how few organizations are employing use data for this purpose.
Institutions that selected the “other” option listed roles that could conceivably fall under
the “general statistics” option. For example, one respondent listed “stakeholder reports”
the statistics without using them for other purposes. Although this may not be the case
with all institutions, data from question 14 suggests that it is for some.
Question 14 asked respondents if they want usage data to play the same or a
different role at their institution in the future. Thirty-two institutions answered this
question, and 12 respondents (38%) said they did not want the role of usage statistics at
their organization to change in the future. Of these participants, 5 selected the “general
statistics” option in question 12 to describe the role usage data currently plays at their
institution (R1, R2, R4, R8, and R37), three chose the “digitization decisions” option
(R12, R15, and R41), two selected “justify funding” (R14 and R34), one selected
“website redesign” (R23), and one chose “other” and listed “stakeholder reports” (R35).
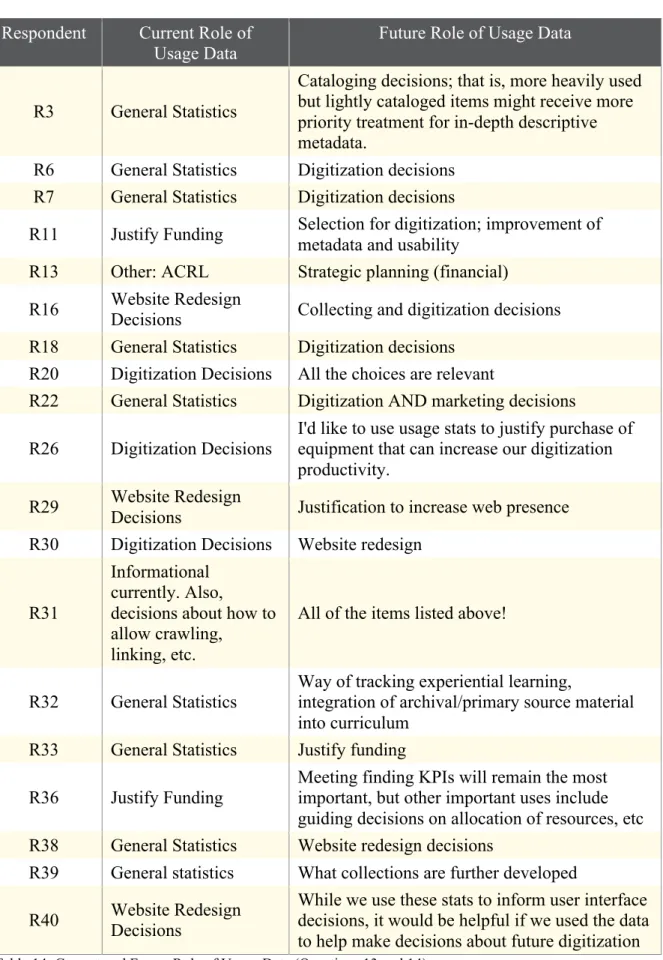
Twenty (64%) respondents stated that they would like their usage data to serve a
different purpose in the future. Of the 20, 19 stated clearly how they wanted the role of
usage statistics to change at their organization. Table 14 compares how these 19
institutions currently employ usage statistics and how they would like the role they play
in their organization to change in the future. The decisions institutions want usage data to
fuel are similar to those that some institutions are already using the data for. This can be
seen in the survey responses; answers to questions 13 and 14 reveal that most institutions
either currently or would like to use usage data to make digitization decisions primarily
Respondent Current Role of
Usage Data Future Role of Usage Data
R3 General Statistics
Cataloging decisions; that is, more heavily used but lightly cataloged items might receive more priority treatment for in-depth descriptive metadata.
R6 General Statistics Digitization decisions
R7 General Statistics Digitization decisions
R11 Justify Funding Selection for digitization; improvement of
metadata and usability
R13 Other: ACRL Strategic planning (financial)
R16 Website Redesign Decisions Collecting and digitization decisions
R18 General Statistics Digitization decisions
R20 Digitization Decisions All the choices are relevant
R22 General Statistics Digitization AND marketing decisions
R26 Digitization Decisions
I'd like to use usage stats to justify purchase of equipment that can increase our digitization productivity.
R29 Website Redesign Decisions Justification to increase web presence
R30 Digitization Decisions Website redesign
R31
Informational currently. Also,
decisions about how to allow crawling,
linking, etc.
All of the items listed above!
R32 General Statistics Way of tracking experiential learning, integration of archival/primary source material into curriculum
R33 General Statistics Justify funding
R36 Justify Funding
Meeting finding KPIs will remain the most important, but other important uses include guiding decisions on allocation of resources, etc
R38 General Statistics Website redesign decisions
R39 General statistics What collections are further developed
R40 Website Redesign Decisions
Satisfaction with and General Comments Regarding Usage Data.
Are you satisfied with how your institution analyzes usage data?
Response %
No, Please explain why not 20 61%
Yes 13 39%
Total 33 100%
Table 15, Participants’ Overall Satisfaction with Analyzing Usage Data (Question 15)
Given the fact that a majority of survey participants would like to change the role
usage data plays at their institution, it is not surprising that 61% of respondents (20 out of
33) stated that they are not satisfied with how their institution handles use information,
see table 15. There were several common reasons for the dissatisfaction as stated by the
participants in the survey. The most common attitude voiced by six participants is best
stated by R33, “we are gathering the information more than we are analyzing it.” Other
respondent explanations included the fact that usage data was not collected often enough
or in a consistent fashion (four participants), that the statistics themselves were not useful
(four participants), and that the usage data was not driving decision-making (three
participants). One other response worth noting was the desire for a common metric
across all institutions (R3).
Two survey questions solicited general comments from participants about the
benefits and challenges of tracking usage data. Many of the benefits listed by survey
participants have been mentioned elsewhere in the findings. These include the ability to
make or justify digitization decisions based on usage data, making website redesign
decisions and generating funding. Other comments mention that usage data helps
prioritize metadata creation, understand user behavior, measure outreach efforts, as well
the benefits of usage data spell out a number of excellent reasons institutions feel
compelled to track this data and all comments in their entirety are available in table 16 in
appendix C.
The general comments respondents left regarding challenges to tracking and
analyzing usage data also echo a number of points that have come up earlier in the
findings. For example, respondents expressed challenges around areas of consistency.
Issues with consistency arose regarding how the statistics are managed and analyzed
internally and the fact that they do not have a consistent policy. Additionally participants
mentioned that they have data on different types of websites and it is difficult to track
usage across these different platforms. Respondents also mentioned that tracking and
analyzing usage data is a time-consuming process. It can take time to get access to the
data, or to have IT personnel install the necessary tracking software. It also takes time to
analyze statistics. A third issue that several participants discussed is the data itself.
Some institutions feel that the data do not tell them exactly what they need to know about
how a user interacts with their digitized resources and how satisfied the user is with the
experience. Additionally, because of the way analytics tools tracks users, some
participants reported a perception that the resulting data is skewed or unreliable. All
comments are available in table 17 located in appendix D.
Discussion
The survey findings echoed themes from the literature on users and usage data.
Like Chris Prom, some institutions use analytics data to redesign their websites. Other
participants use analytics to decide where to invest more metadata creation resources,
engaged as many of the participants of this study are in collecting usage data, none
seemed to be conducting any user studies at the scale suggested by Paul Conway. This
could be due to the survey format, and it is possible that direct conversation with
participants could have revealed such a program. At the same time, it is clear that the
participants in this survey are grappling with the different notions of use raised by Jill
Grogg and Rachel Fleming-May. For example several participants raised the point that
although the usage statistics provide an idea of how often an item was viewed they do not
say anything about how the patron used the resource. Along these lines, one participant
noted that they get “better anecdotal evidence than we do from use stats” in response to
the question on overall satisfaction (R41).
Data from this study also confirms some of the focus group findings Wendy Duff
and her team explored in their paper “archivists’ views of user-based evaluation:
benefits, barriers and requirements” (2008). Although there was only one reference to
training needed by survey participants and this was a major emphasis of Duff’s work, the
results of this survey do indicate that frameworks are needed for analyzing usage data.
Numerous participants expressed that they wanted to do more with their usage data but
were not able to do so. Duff reached similar conclusions through her focus groups, and
perhaps the Archival Metrics project that developed as a result will eventually provide
guidance on analytics as well as more traditional use studies.
The findings of this survey also reveal that there are many differences between
the institutions surveyed and how they measure and analyze the use of their collections.
One of these differences is the staff and departments within the surveyed institutions
tasked with tracking and analyzing usage data. The range of departments and positions
institutions as to who works with usage statistics. It will be difficult for institutions to
collaboratively build one common framework for analyzing usage data given this lack of
consistency. On the other hand, this key finding could provide an avenue for institutions
to team up with similarly organized institutions and create a series of frameworks from
which other institutions with new data analysis initiatives can choose to adopt.
Survey responses also show that there are differences in how statistics are used.
One participant provided an example of this in response to the question, “What would
you like the role of usage statistics to be in the future of your organization?”:
For certain types of collections, the expectation behind digitization is that the making the material digitally available will lead to significant usage at a national or global scale. For these types of collections, tracking the number of visits and pageviews is important to justify digitization efforts. However, other collections are digitized not because they will be widely used but because their being
digitally available and searchable is very significant to an important group of users, regardless of the size of this user group. In these instances, statistics should be treated with less weight. (R27)
This type of consideration can make analyzing statistics very difficult. It acknowledges
that some collections will always have low usage and that is acceptable. But how should
institutions resolve pockets of low usage statistics when they are also trying to use the
numbers to make digitization decisions or generate funding, which are two ways that
institutions employ usage data? Having more models for addressing these questions
with usage data or incorporating usage data effectively into larger use studies would
benefit institutions like those who participated in the study.
Overall, data presented here show that many of the participating institutions do
see the value in tracking and analyzing usage data even if they are not currently doing so.
Although institutions surveyed see the value of tracking such data, this survey also
able to collect use information but in many cases obstacles such as limited time,
limited resources and a lack of policy kept them from funneling raw statistics into
effective decision-making. One participant commented that “there is always more that
can be done” in answering a survey question about their level of satisfaction with how
they currently manage usage data (R36). This sentiment is an excellent summation of
many of the participants’ comments regarding their attitudes towards usage data.
Therefore this survey also reveals further opportunities for research on tracking and
analyzing the use of digitized primary source materials in order to provide models that
help define and make actionable the “more” that can be done.
Opportunities for Further Research
Both the literature review and survey in this study suggest that there are ample
opportunities for more research regarding use of digitized primary source materials. One
opportunity would be to expand the current survey to a much wider audience and see if
global trends match the small data sample evaluated here. A larger base of participants
should include other types of institutions as well. For example, representatives of state
government were invited to participate in this survey but did not, and their point of view
would be welcome in this discussion.
The focus of this study has been usage that can be measured through log analysis
and web analytics tools, but institutions do observe the use of their collections in other
ways. For example, respondents to this survey rely on anecdotal evidence of use and user
feedback as seen in the responses to question nine. Talking in depth with participants
could reveal the extent to which they use these less formalized measures of use and how
References
Brichford, M., (1977). Archives & Manuscripts: Appraisal & Accessioning. Chicago:
Society of American Archivists.
Chapman, J., (2011). Evaluating the Effectiveness of Manual Metadata Enhancements
for Digital Libraries. Retrieved from: http://go.ncsu.edu/llzhzy
Conway, P., (1986). Facts and Frameworks: An Approach to Studying the Users of
Archives. TheAmerican Archivist, 49 (4), p. 393-407.
Daniels, M., & Yakel, E., (2010). Seek and you May Find: Successful Search in Online
Finding Aid Systems. TheAmercian Archivst, 73(2), 535-568.
Dooley, Jackie M., Luce, K., (2010). Taking our pulse: The OCLC Research Survey of
Special Collections and Archives. Dublin, Ohio: OCLC Research. Retrieved
from: http://www.oclc.org/research/publications/library/2010/2010-11.pdf
Duff, W., Dryden, J., Limkilde, C., Cherry, J., Bogomazova, E., (2008). Archivists’
Views of User-based Evaluation: Benefits, Barriers and Requirements. The
American Archivist, 71, p. 144-166.
Duff, W., Yakel, E., Tibbo, H., Cherry, J., McKay, A., Krause, M., Sheffield, R., (2010).
The Development, Testing and Evaluation of the Archival Metrics Toolkits. The
American Archivist, 73, p. 569-599.
Evans, J., Mathur, A., (2005). The Value of Online Surveys. Internet Research, 15(2), p.
Freeman, E., (1984). In the Eye of the Beholder: Archives Administration from the
User's Point of View. The American Archivist, 47(2), p. 111-123.
Grogg, J., Fleming-May, R., (2010). Assessing Use and Usage. Library Technology
Reports, 46(6), 5-10.
Harley, D., and Henke, J., (2007) Toward an Effective Understanding of Website Users.
D-Lib Magazine, 13 (3/4).
Jackson, T., (2011). I Want to See It: A Usability Study of Digital Content Integrated Into
Finding Aids. A masters paper for the M.S. in L.S. degree at University of North
Carolina, Chapel Hill, School of Information and Library Sciences.
Jackson, W., (1997). The 80/20 Archives: A Study of Use and its Implications.
Archival Issues, 22(2), p. 133-45.
Kalfatovic, M. R., Kapsalis, E., Speiss, K., Van Camp, A., Edson, M., (2008).
Smithsonian Team Flickr: a Library, archives, and Museums Collaboration in
Web 2.0 Space. Archival Science 8:267-277.
Maher, William, J., (1986). The use of User Studies. The Midwestern Archivist, 11(1), p.
15-26.
Meyer, E., (2011). Splashes and Ripples: Synthexiazing the Evidence on the Impact of
Digital Resources. London: JISC. Retrieved from:
http://ssrn.com/abstract=1846535
O’English, M., (2011). Applying Web Analytics to Online Finding Aids: Page Views,
Pathways and Learning about Users. Journal of Western Archives, 2 (1).
Retrieved from: http://digitalcommons.usu.edu/westernarchives/vol2/iss1/1/
Plaza, Beatriz (2010). Google Analytics: Intelligence for Information Professionals.
Prom, C., (2011). Using Web Analytics to Improve online Access to Archival
Resources. The American Archivist, 74, p. 158-184.
Society of American Archivists (2005). Code of Ethics for Archivists. Retrieved from:
http://www2.archivists.org/standards/code-of-ethics-for-archivists
Springer, M., Dulabahn, B., Michel, P., Natanson., Reser, D., Woodward, D., Zinkham,
H., (2008). For the Common Good: The Library of Congress Flickr Pilot Project.
Washington D.C.: The Library of Congress. Retrieved from:
http://www.loc.gov/rr/print/flickr_report_final.pdf
Turnbaugh, R., (1986). Archival Mission and User Studies. The Midwestern Archivist,
11(1), p. 27-33.
Turner, S. J. (2010). Website statistics 2.0: Using Google Analytics to Measure Library
Website Effectiveness. Technical Services Quarterly, 27(3), 261–78.
Van Selm, M., Jankowski, N., (2006). Conducting Online Surveys. Quality & Quantity,
40, p. 435-456.
Warwick, C., et al., (2008). Library and Information Resources and Users of Digital
Resources in the Humanities. Library and Information Systems, 42(1), 5-27.
Yale University (2008). Primary Sources: What are Primary Sources? Retrieved from:
Appendix A
Survey: Tracking the Use of Digitized Primary Source Materials
Section I
Please note that this survey is solely concerned with the digital objects from your
collections that are unique and composed of primary sources. Please do not report data
from digitized published materials such as books or periodicals (unless they are from rare
or unique collections).
1. Please enter the name of your institution.
*The name of your institution will not be reported in the final paper.
2. Type of Institution
-Small academic Library
-Medium Academic Library
-Large Academic Library
-Governmental Institution
-Other, please list
3. What types of primary source materials have been digitized from your collections and
are accessible through the Web [check all that apply].
-Manuscripts
-Rare books
-Audio materials
-Moving image materials
-Photographs
-Cartographic materials
-Artifacts/Realia
-Other
4. Does your institution collect and track usage statistics for your digitized collections of
primary source materials?
-Yes -No [if no, respondent will be directed to section THREE, question 5]
Section II
5. List the approximate size of your digitized primary source materials that are accessible
over the Web either from your institutional website. [# of items]
6. If you do not track use of your collections, why not?
-Limited funding
-Limited time
-Limited technical infrastructure
-Lack of interest by management
-Other, please describe
7. If you do not currently track use of your collections, do you plan to in the future?
-Yes, Please explain Why
-No, Please explain Why Not
Section III
5. If your institution does collect do you use any of the following tools?
-Web Analytics software, please list the product name
-Log analysis
-Other, Please Describe
-User feedback
-Anecdotally (for example, you might hear professors and students talk about
using digital collections)
-Citation analysis
-By monitoring web 2.0 tools such as comments
-Remote reference inquiries for digital objects
-I only track use through the solutions listed in the previous question
-other, please describe
7. When analyzing usage statistics, what is the most valuable data point?
-Visits
-Page Views
-Referring web sites
-Average Time on Site
-Bounce Rate
-Search terms/keywords
-Other [please describe]
8. Who in your institution is responsible for tracking usage statistics?
-Not a formal responsibility
-Information Technology Services
-Research Services
-Collection Development
-Digital Production Center
-Technical Services
9. Who in your institution is responsible for analyzing usage statistics?
-Not a formal responsibility
-Information Technology Services
-Research Services
-Collection Development
-Digital Production Center
-Technical Services
-other [describe]
10. What is the most important role that use statistics play at your institution?
-Justify funding
-Part of general statistics reported to administration
-Track copyright issues
-Digitization decisions
-Collecting Decisions
-Website Redesign Decisions
-Other, please describe
11. What would you like the role of usage statistics to be in the future of your
organization?
-same as listed in previous question
–other function, please describe
12. Are you satisfied with how your institution analyzes and acts on usage statistics?
-Yes
13. Please describe some of the challenges of tracking use data of your digitized
collections? [fill in]
14. Please describe some of the benefits of tracking use statistics of your digitized
collections? [fill in]
15. List the approximate size of your digitized primary source materials that are