Introducing a New Denition Towards
Clinical Detection of Microvascular Changes
Using Diusion and Perfusion MRI
M. Ashoor 12
, Q. Jiang 23
, M. Chopp 32
and M. Jahed
Based on MRI diusion and perfusion, a new criterion for detection and the healing progress of damaged tissue is suggested. The study is based on the ratio of capillary radii in symmetrical damaged and normal tissue neighboring spaces. The Apparent Diusion Coecient (ADC) and Cerebral Blood Flow (CBF) were measured in the brain tissues of six male Wistar rats utilizing suggested MRI measurement techniques. The ADC values of damaged and normal regions were (39234:1)10
;6mm2s;1and (659
40:7)10
;6mm2s;1, respectively. The CBF values of damaged and normal regions were14:510:13 ml/min/100 g and 12541:03 ml/min/100 g, respectively. The geometrical parameters of the capillary for damaged and normal regions,r=
p `, where r is the mean radius and ` is the mean capillary segment length, were calculated to be 5:452:01mm0
:5g;0:5 (mean
SD) and 12:82:04 mm0
:5g;0:5, respectively. Furthermore, based on constant `, the damaged, versus normal region, mean radius, was shown to follow the \criterion": rDamaged
= 0:43rNormal. A further analysis was conducted through suitable theoretical modeling and assumptions for the above-mentioned criterion. The analysis showed a distinct dierence between normal and damaged tissues in various healing progress conditions. Moreover, a new image, namely, Diusion/Flow map (DF map), which is a mere division of the ADC map to the CBF map, was introduced and utilized to contrast between normal and damaged tissue.
INTRODUCTION
Incoherent microscopic proton motion in vivo is pri-marily due to diusion, but, in principle this motion reects all transport processes within the dierent tissue compartments, hence, the name Apparent Dif-fusion Coecient (ADC). ADC, a measure of the mean free path of water, is consistently reduced in ischemic brain areas in acute strokes. However, the acute pathophysiological mechanisms involved in this phenomenon are not completely understood. Recent studies suggest that ischemia, i.e., interruption of Cerebral Blood Flow (CBF) per se and the resultant brain tissue hypothermia, may cause part of the ADC
1. Department of Mechanical Engineering, Sharif Univer-sity of Technology, Tehran, Iran.
2. Department of Neurology, Henry Ford Health Sciences Center, Detroit, MI, USA.
3. Department of Physics, Oakland University, Rochester, MI, USA.
*. Corresponding Author, Department of Electrical Engi-neering, Sharif University of Technology, Tehran, Iran.
reduction. The importance of ADC and its relation to ischemic tissue has previously been extensively studied 1].
Diusion Weighted magnetic resonance Imag-ing (DWI) appears useful for the early detection of a stroke. The Apparent Diusion Coecient of water (ADCw) predicts cerebral ischemic cell dam-age, but such prediction is dependent on the time of measurement and duration of ischemia. The ability of a single ADCw measurement to identify and predict the biological outcome of tissue appears linked to a narrow time window requiring precise knowledge of the onset of ischemia. Energy deple-tion, temperature, intracellular water accumuladeple-tion, changes in tortuosity of the extracellular diusion paths and changes in cell membrane permeability have all been implicated as contributing to the changes in ADCw. The increase in ADCw appears to oc-cur concomitantly with a loss of membrane struc-ture and a loss of barriers to diusion. Possi-bly, other MRI measurements, such as CBF, phos-phorus and proton spectroscopy or a combinations
of these measures, may improve tissue characteriza-tion 2].
Using a model of the partial stenosis of a Middle Cerebral Artery (MCA) in a cat's brain, Roberts et al. 3] found a linear correlation between relative perfusion reduction and ADC change. In this model, a reduction of CBF correlated well with a reduction in ADC. However, it can be argued that in reperfused infarct, or, when ADC \pseudo-normalizes", the corre-lation may disappear.
Blood perfusion of tissue assures the delivery of oxygen and nutrients to cells. To achieve this goal, fresh, oxygenated \arterial" blood is delivered to the tissue through the capillary network, which is opti-mized for blood-tissue exchange. Oxygen and nutrients are transported, passively or actively, in the tissue through the capillary wall. Tissue metabolism results in waste products that are eliminated through the capillary network to constitute deoxygenated \venous" blood. This process depends on many parameters, such as blood pressure and velocity, capillary network den-sity and geometry, capillary wall permeability, nutrient or oxygen diusion and extraction rates, which can be grouped in three categories: Micro-vascular anatomy and histology, blood microcirculation and blood-tissue exchanges.
For the physiologist, perfusion refers to the cir-culation of blood. Perfusion has often been used by pathologists (and radiologists) simply to denote the degree (density) of normal or abnormal microvascula-ture in a tissue, as seen, for instance, by conventional catheter angiography. One should remain cautious regarding the inclusion of \unused" blood in the mea-sured blood ow. In particular, it is known from Positron Emission Tomography (PET) studies that a signicant part of circulating blood may come from vessels other than capillaries, such as small arteries and post-capillary veins. Most models assume, for simplicity, that these vessels are \invisible," which could lead to an overestimation of perfusion. The average blood velocity and mean capillary segment length may provide useful data for microcirculation physiology. For instance, when blood ow increases in a particular region of the brain as a response to a sensory stimulus, the physiologist is interested to know whether the mechanism is capillary recruitment or an increase in blood velocity 4].
It may be that combined CBF and ADC can dene dierent acute infarct patterns, which may allow the selection of rational therapeutic strategies, based on the presence or absence of potentially salvageable ischemic tissue. Combined Perfusion-Weighted Imag-ing (PWI) and Diusion-Weighted ImagImag-ing (DWI) have the potential to be more powerful than either studies alone in predicting infarct outcome. The combination of PWI and DWI was superior to
conven-tional Magnetic Resonance Imaging (MRI) in predict-ing improvement followpredict-ing severe acute stroke. The acute regional perfusion decits would correlate with clinical severity, clinical outcome and nal infarct size. The combined use of PWI and DWI would be more powerful than either of them alone at identifying patterns in which ischemic regions have the potential to expand 5].
At present, the relationship between capillary geometry and perfusion and diusion information, such as CBF and ADC, is not fully clear. The combination of CBF and ADC may allow a descriptive statistic related to micro-vascular geometry. A dierent ap-proach to estimating micro-vascular characteristics can be found in a DF map, which is a mere division of the ADC map to the CBF map. It will be demonstrated, with a preliminary function using CBF and ADC, along with a small set of suitable hypotheses, that the combination of CBF and ADC allows a new descriptive statistic related to micro-vascular geometry. This paper presents a DF map in a rat model of an em-bolic cerebral ischemic infarction and an interpretation of these maps, in terms of micro-vascular geometry. Micro-vascular parameter changes, after ischemia, are measured.
METHODS
Theory
It is assumed that the number of capillaries, with mean radius, (n(r)), are maximum and, therefore, the number of capillaries can be calculated as follows:
N = ra Z 0
n(r)dr = (r
a
;r):n(r) (1) where r
a is the maximum radius of capillaries that bring blood into the voxel. If the capillaries are assumed as cylinders with mean length (`) and mean radius (r), then CBV is as follows:
CBV= ra Z 0
n(r):r 2
:`:dr = (r
a
;r)n(r):r 2
:`: (2) By combining Equations 1 and 2 one obtains:
N = CBV ; `r2 ;1 : (3)
If TCL is the Total Capillary Length, one has, accord-ing to the denition of the Mean Transit Time (MTT) in the capillary network:
MTT = TCLV
;1= (TCL)
:`(6:D );1 = CBVCBF
;1
Whereas, before`is the mean capillary segment length, dened as the average distance along which spins move with a constant velocity, (V)D
is the pseudo-diusion coecient and CBV is Cerebral Blood Volume 6]. The quantity, (< ` >< V > =6), has the dimension of a diusion coecient and has been referred to as the pseudo-diusion coecient,D
. One may now arrange the cylindrical capillary segments in a series format, namely, N:`. As such, N:` and TCL are practically equal and, hence, by combining Equations 3 and 4, one obtains:
`:r ;2
= 6:D
:CBF
;1
: (5)
Using literature data for < ` > and < V > 7], D
is expected to be about eight to ten times larger than the true diusion coecient of water at room temperature (D
= 10D) 8]. However, currently, a precise measurement of D
is not possible in view of Signal to Noise Ratio (SNR) limitations. As such, this issue certainly requires further study, especially in the theoretical analysis domain. The authors believe that D
= 10D is a good estimation and starting point for further analytical study and, therefore, it is utilized in the current study. Hence, now based on the above estimation, Equation 5 can be rewritten as:
`:r ;2
= 60:D:CBF ;1
: (6)
If one assumes that the mean capillary segment length in the capillary space for the normal and damaged regions is the same, one obtains:
rDamaged(rNormal) ;1
=
(DCBF)Normal
(DCBF) ;1 Damaged
0 :5
(7)
where D CBF can be regarded as a new image, namely, a DF map. Therefore, the ratio of radii in the damaged and normal regions depends on the ratio of the normal and damaged regions in the DF map.
Animal Model
The male Wistar rats (N = 6300;450 g) subjected to embolic stroke were investigated using a 7 Tesla MRI system. The method of inducing an embolic stroke and the rt-PA treatment in this study has been previously described 9,10]. Briey, an aged white clot (prepared 24 hrs before ischemia) was slowly injected into the internal carotid artery to block MCA 10]. This model of an embolic stroke provides a relatively reproducible infarct volume localized to the territory supplied by MCA 9,10].
MRI Measurements in 7 Tesla System
MRI measurements were performed using a 7 T, 20 cm bore superconducting magnet (Magnex Scientic, Abingdon, UK) interfaced to a SMIS console (Surrey, England). A 12 cm bore actively shielded gradient coil set, capable of producing magnetic eld gradients of up to 20 gauss/cm, was used. Radio Frequency (RF) pulses were applied by a 7.5 cm diameter saddle coil actively decoupled by TTL control from the 1.4 cm surface receiver coil, which was positioned over the center line of the animal skull. Stereotaxic ear bars were used to minimize movement during the imaging procedure. During MRI measurements, anes-thesia was maintained using a gas mixture of N2O (69%), O2 (30%) and halothane (0.75-1%). Rectal temperature was kept at 370:5
C, using a feedback controlled water bath. A modied Fast Low Angle SHot (FLASH) 11] imaging sequence was employed for reproducible positioning of the animal in the magnet at each MRI session 12]. DWI and PWI measurements were performed 24 hrs after the onset of emboliza-tion.
ADCw was measured using the Stejskal-Tanner sequence with three b-values (10, 800 and 1800 s/mm2) in each of three diusion sensitizing directions, seven slices, 32 mm2 FOV, 12864 matrix, TR = 1.5 s TE = 40 ms, where FOV, TR and TE are Field Of View, Repetition Time and Echo Time, respectively. Each image required a scan time of 3.2 min for completion. The total time for the entire sequence was approximately 14.4 min.
Perfusion measurements were performed prior to each diusion measurement using an arterial spin tagging technique 13]. Two images were obtained for perfusion measurement with parameters: TR = 1 sec, TE = 30 msec, 64 64 image matrix, 3 mm slice thickness and a 32 mm2FOV. In each animal, PWI was measured within a coronal section, with coordinates centered at interaural 8.2 mm and bregma 0.8 mm 14]. The duration of the inversion pulse was 1 sec at a B1 amplitude of 0.3 KHz.
Data Analysis
Two Regions Of Interests (ROIs) were selected for measurement of MRI parameters. The mean and Standard Deviations (SD) of ADCw values of the parenchymal tissue (not Cerebrospinal Fluid (CSF)) in the contralateral hemisphere were measured and the threshold values, to determine the number of pixels with abnormal values in the ipsilateral hemisphere, were dened using mean ADCw ;1:5SD in the contralateral hemisphere, where this value is a heuristic one. Homologous ROIs in the ischemic tissue were also measured in the contralateral hemisphere. A
paired t-test was used to compare the two ROIs with a signicance level of 0.05.
RESULTS
For the calculation of ADC, the mono-exponential intra-voxel incoherent motion model was used: S(b) = S(0):exp(;b:ADC) 12]. Because the diusion of water may be directionally dependent (anisotropic), measure-ment in only one direction can lead to incorrect image interpretation. The diusion gradient was, therefore, applied in each of three orthogonal directions (xyz) and an average of these measurements was calculated to give the trace of the diusion tensor, which is reported to minimize the eects of diusion anisotropy 5].
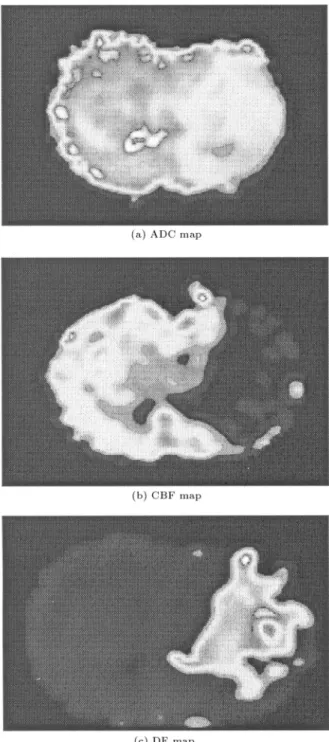
The ADC, CBF and DF images were formed using the above protocols that were identied in Fig-ure 1. In the damaged areas of both the ADC and CBF maps, the values were decreased relative to the normal area because of stroke onset. For calculation of ADC and CBF values, suitable areas are chosen after applying image processing procedures to reduce noise and artifacts. So, the ADC values of damaged and normal regions were (39234:1)10
;6 mm2s;1 and (65940:7)10
;6 mm2s;1, respectively. The CBF values of damaged and normal regions were 14:510:13 ml/min/100g and 12541:03 ml/min/100g, respectively. The geometrical parameters of capillaries for damaged and normal regions,r=
p
`, were calculated to be 5.45 2.01 mm0
:5g;0:5 (mean
SD) and 12.8 2.04 mm0
:5g;0:5, respectively. Furthermore, based on constant `, damaged versus normal region mean radius was shown to follow the \criterion": rDamaged
= 0:43rNormal.
Table 1 depicts the ADC, CBF andr= p
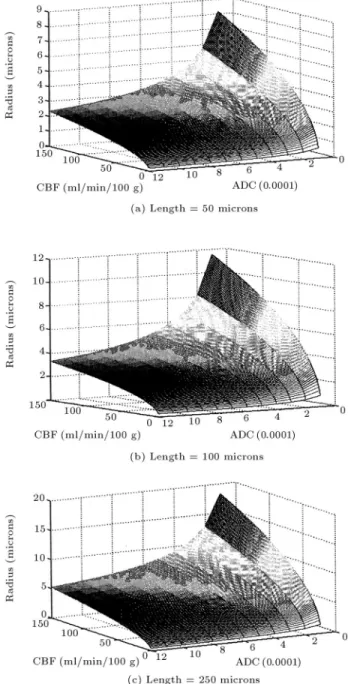
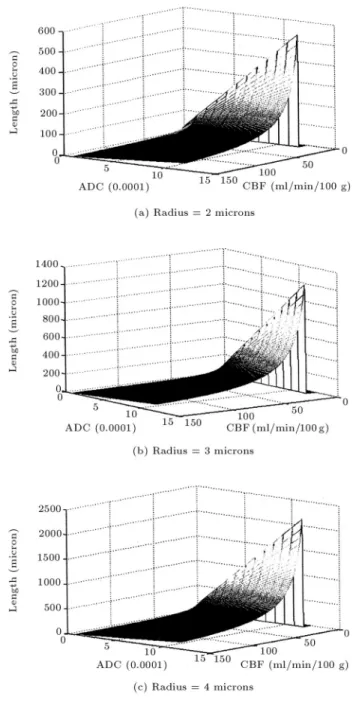
`values. Figure 2 depicts the relationship between mean length and radius in damaged and normal regions. As shown in this gure, the mean radius in the damaged region is less than the normal region and with increasing the mean length, mean radius will be increased. Figure 3 illustrates capillary radius versus ADC and CBF for the mean lengths of 50, 100 and 250m in the capillary space. Here, as CBF increases with a low ADC value, the mean capillary radius is rapidly increased. Figure 4 demonstrates capillary length versus ADC and CBF for the mean radius of 2, 3 and 4 m. It can be
Figure1. a) ADC map depicting normal versus damaged
where the latter is shown as a bright segment b) CBF map for blood ow in the same normal versus damaged area as in part (a) and c) DF map providing the specic damaged area.
Table1. The ADC, CBF andr= p
`values in the damaged and normal regions (presented for the theory of being in
agreement with published values (meanSD)).
ADC (mm
2/sec)
CBF (ml/min/100 g)
r=p `
mm
0:5
g
;0:5Damaged Region
3:9210 ;43:4110
;5 14
:510:13 5:452:01
Normal Region
6:5910 ;44:0710
;5 125
41:03 12:82:04
Figure2. Relationship between mean length and radius
of capillary in damaged and normal regions.
seen that with increasing radius, the length of the capillary will also increase. Moreover, the mean radius in the capillary space dropped o in the damaged regions where perfusion and diusion values decreased approximately 9 and 2 fold, respectively. For example, considering a mean capillary length of 100 microns, using Equation 6, the mean radius in the capillary space of the damaged and normal areas, was found to be 1.72 and 4.05 microns, respectively.
DISCUSSION
This study provides a new denition for the rela-tionship between the mean radius of the capillary in the damaged and normal regions using diusion and perfusion MRI. Diusion, CBF and DF maps are obtained through the application of image processing techniques (e.g. threshold technique) to reject noise.
Ideally, one should consider all requisites for the dynamical modeling of the system, namely, uid, thermal dynamics and various parameters involved in capillary spaces. However, the emphasis of this study has been to nd a simplied method to provide a suitable clinical application criterion, namely, a DF map produced from diusion and perfusion maps and the ratio of capillary radii in damaged versus normal tissue. The ratio of capillary radii is not as important as a specic quantied number, but, rather, departure from this quantity is important in damaged versus normal cases. As such, one must notice that, although this study elects to overlook a few dynamical system parameters, it has provided a possible resolution to-wards diagnostics and the prediction of abnormalities. Pathak et al. 15] showed that in normal contra-lateral sections of the brain, the mean vessel length and radius were, respectively, 178:59 28:76 and 3:72 0:72 microns, while the same parameters for a tumor were 98:36 14:74 and 10:52 2:94 microns, respectively.
Figure 3. Capillary radius versus ADC and CBF for
mean length of a) 50, b) 100 and c) 250m. Here, as CBF
increases with a low ADC value, the mean capillary radius is rapidly increased.
The ADC measured in this study is, in fact, a weighted average of the diusion coecients of the intracellular and interstitial compartments. The diusion coecients for two separate compartments, Dint (interstitial) and Din (intracellular), were given in the literature as Dint = 0.00325 mm2s;1and Din = 0.000143 mm2s;1. In a normal brain, the interstitial space volume is 20% of the total volume, whereas the intracellular compartment comprises, approximately, 80% of the total volume. Thus, for a normal brain, one may calculate an average weighted diusion coef-cient of (0:20:00325 + 0:80:000143 mm2s
Figure4. Capillary length versus ADC and CBF for
mean radius of a) 2, b) 3 and c) 4m.
0.00076 mm2s;1 1]. This, however, is in agreement with the results obtained in this study.
The precise physiologic correlation ofD
to CBF is not exactly known, but this parameter seems most likely related to the velocity of blood through the vessels. As such, it is reasonable that D
would in-crease with increasing CBF 16]. Yet, in another study, the pathophysiological changes were shown to be the reasons for the gradual ADC reduction in the ischemic territory. ADC values of normal cortex and caudate-putamen were found to be (72622)10
;6mm2s;1 and (659 17) 10
;6 mm2s;1, respectively 17]. Again, the measured values are in agreement with these results.
The DF-map shows that the microcirculation eect arises from capillary blood and not from any other circulating uid, such as CSF in the brain. It seems that the CSF region in the DF-map disappears. The standard deviation of CBF is large. This is likely due to variable biological events, as well as to errors inherent in the spin tagging CBF methodology. Errors in the proton spin tag MRI CBF measurement may derive from the relatively low signal-to-noise ratio (approximately 5:1 for CBF map) 9]. The high S.D. of the observed lesion size reects the inter-individual variability of the extent of ischemic territory 17].
Advantages of the DF-map in Figure 1 may be summarized as follows:
a) Prevents data scattering in CBF and ADC images b) Separates normal and lesion regions
c) It is not sensitive to simultaneous changes of CBF and ADC. Therefore, regions with small and large CBF and ADC values have similar values in the DF-map. On the other hand, it shows the same results whether CBF and ADC values are low or high
d) It shows promise in predicating capillary density e) In the DF map, the utilization of combined PWI
and DWI has the potential to be more powerful than either studies alone in predicting infarct out-come.
On the other hand, the disadvantage of the DF map was, primarily, due to longer experimental time.
Based on the presented results, it may be con-cluded that lesion volume in the DF map correlates well with clinical indications. In practice, it seems that the DF map can be used to quantify the eciency of blood ow to deliver oxygen and nutrients to, and waste from, the tissues. Finally, a DF map may nd usage in identifying tissue regions at risk for eventual infarctions.
ACKNOWLEDGMENT
The authors extend their thanks to Drs. Zheng Gang Zhang and Ali Mireshghi for their technical assistance.
REFERENCES
1. Benveniste, H., Hedlund, L.W. and Johnson, A. \Mechanism of detection of acute cerebral ischemia in rats by diusion-weighted magnetic resonance mi-croscopy",Stroke,23, pp 746-754 (1992).
2. Jiang, Q., Chopp, M., Zhang, Z.G., Knight, R.A., Jacobs, M., Windham, J.P., Peck, D., Ewing, J.R. and Welch, K.M.A. \The temporal evolution of MRI tissue signatures after transient middle cerebral artery occlusion in rats", Journal of Neurological Sciences,
3. Roberts, T.P.l., Vexler, Z., Derugin, N., Moseley, M.E. and Kucharczyk, J. \High-speed MR imaging of ischemic brain injury following stenosis of the middle cerebral artery", J. Cerebral Blood Flow Metabolism,
13, pp 940-946 (1993).
4. Bihan, D.L. and Turner, R. \The capillary network: A link between IVIM and classical perfusion",Magnetic Reson. Med. (MRM),27, pp 171-178 (1992).
5. Barber, P.A., Darby, D.G., Desmond, P.M., Yang, Q., Gerraty, R.P., Jolley, D., Donnan, G.A., Tress, B.M. and Davis, S.M. \Prediction of stroke outcome with echoplanar perfusion- and diusion-weighted MRI", Neurology,51, pp 418-426 (1998).
6. Bihan, D.L., Intravoxel Incoherent Motion Imaging: Diusion and Perfusion Magnetic Resonance Imaging, D. Le Bihan, Ed., Raven Press, Ltd., New York, USA, chapter 15, pp 270-274 (1995).
7. Pawlik, G., Rackl, A. and Bing, RJ. \Quantitative capillary topography and blood ow in the cerebral cortex of cats: An in-vivo microscopic study", Brain Res.,208, pp 35-58 (1981).
8. Bihan, D.L. \Molecular diusion nuclear magnetic resonance imaging",Magnetic Reson. Quarterly,7(1),
pp 1-30 (1991).
9. Jiang, Q., Zhang, R.L., Zhang, Z.G., Ewing, J.R., Divine, G.W. and Chopp, M. \Diusion-, T2-, and perfusion-weighted nuclear magnetic resonance imag-ing of middle cerebral artery embolic stroke and recom-binant tissue plasminogen activator intervention in the rat", J. Cerebral Blood Flow and Metabolism,18, pp
758-767 (1998).
10. Zhang, R., Chopp, M., Zhang, Z., Jiang, Q. and Ewing, J.R. \A rat model of embolic focal cerebral ischemia", Brain Research,766, pp 83-92 (1997).
11. Haase, A., Frahm, J., Matthaei, D., Hanicke, W. and Merboldt, K.D. \FLASH imaging, rapid NMR imag-ing usimag-ing low ip-angle pulses", Journal of Magnetic Reson.,67, pp 258-266 (1986).
12. Jiang, Q., Zhang, Z.G., Chopp, M., Helpern, J.A., Ordidge, R.J., Garcia, J.H., Marchese, B.A., Qing, Z.X. and Knight, R.A. \Temporal evolution and spa-tial distribution of the diusion constant of water in rat brains after transient middle cerebral artery occlusion", Journal of Neurol. Sci., 120, pp 123-130
(1993).
13. Williams, D., Detre, J., Leigh, J. and Koretsky, A. \Magnetic resonance imaging of perfusion using spin inversion of arterial water", Proc. National Academy of Sciences, USA,89, pp 212-216 (1992).
14. Paxinos, G. and Watson, C.,The Rat Brain in Stereo-taxic Coordinates, 2nd Edn., Academic Press (1986). 15. Pathak, A.P., Schmainda, K.M., Ward, B.D.,
Linder-man, J.R., Rebro, K.J. and Greene, A.S. \MR-derived cerebral blood volume maps: Issues regarding histolog-ical validation and assessment of tumor angiogenesis", Magnetic Reson. Med. (MRM),46, pp 735-747 (2001).
16. Neil, J.J., Bosch, C.S. and Ackerman, J.J.H. \An eval-uation of the sensitivity of the intravoxel incoherent motion (IVIM) method of blood ow measurement to changes in cerebral blood ow",Magnetic Reson. Med. (MRM),32, pp 60-65 (1994).
17. Hoehn-Berlage, M., Norris, D.G., Kohno, K., Mies, G., Leibfritz, D. and Hossmann, K.-A. \Evolution of regional changes in apparent diusion coecient during focal ischemia of rat brain: The relationship of quantitative diusion NMR imaging to reduction in cerebral blood ow and metabolic disturbances", Journal of Cerebral Blood Flow and Metabolism, 15,