Modelling of Swelling Parameters and Associated Characteristics
Based on Index Properties of Expansive Soils
J. Israr1, K. Farooq2 and H. Mujtaba3
1. Lecturer, Department of Civil Engineering, UET, Lahore, Pakistan, [email protected] 2. Professor, Department of Civil Engineering, UET, Lahore, Pakistan, [email protected]
3. Assistant Professor, Department of Civil Engineering, UET, Lahore, Pakistan, [email protected]
Abstract
Presence of swelling soils under the foundations of civil engineering structures particularly lightly loaded structures has caused serious damages around the globe due to their differential up heaving. In this paper, based on the results of swell tests on bentonite mixed clay, correlations for predicting the swelling parameters (i.e., swell potential and swell pressure) have been proposed. Mixing of bentonite into low swelling clay has imparted significant variations in its index properties including activity and plasticity index as well as in its swell potential and swell pressure values. Mixing of bentonite from 0 % to 55% into lean clay (CL) varies its placity index value from 18 to 150 resulting into variation of its activity from 0.62 to 1.87. For the same range of bentonite addition, the swell potential and swell pressure values vary from 2.62% to 12.16% and 94 kPa to 928 kPa, respectively. Based on multiple linear regression analysis of swell and index property test data, correlations between swelling parameters, activity and remolding moisture content for expansive soils have been developed. Experimental data of twenty six (26) swelling soils procured from various sites in Pakistan have been used to validate the proposed correlations. These correlations have predicted the swell potential and swell pressure of these soils within accuracy of +10% and +5%, respectively, in comparison with their experimentally determined values. A comparison of these predictions with couple of well-known published empirical equations has also been made.
Key Words
: expansive soils, swell potential, swell pressure, index properties, bentonite,montmorillonite.
1. Introduction
Swelling soils are recognized as problematic soils that undergo significant volume changes when their moisture content is changed. Principally, swelling occurs when water infiltrates between the clay particles, causing them to separate [13]. Many lightly-loaded structures have undergone severe damages when they were founded over such soils due to differential heaving of the under lying soils. Volume change of these soils is a major cause of concern, since it causes extensive damage to the structures and the allied services ([2], [3], [5], [8] and [10]). Figure 1 presents the typical and most common failures associated with the presence of the swelling soils under the building foundations.
The response of expansive soils in the form of swelling and shrinkage due to changes in water content is frequently expressed superficially as
heaving and settlement of lightly loaded structures such as pavements, walkways, railways, roadways, foundations, channel linings, etc. [15]. Even when mitigating measures such as drain systems have been provided to prevent these soils from reacting to changes in their moisture condition, the soils still exhibit inherent low shear strength and undergo large secondary compression. Expansive or swelling soils are highly plastic soils that typically contain clay minerals such as Montmorillonite that attract and absorb significant amount of water [12]. This property is associated with the presence of varieties of minerals such as Kaolinite, Illite and Montmorillonite group of minerals [6].
The type and amount of mineral and the percentage of clay fraction play a vital role in controlling the index properties such as liquid limit, plasticity index and activity as well as the swelling
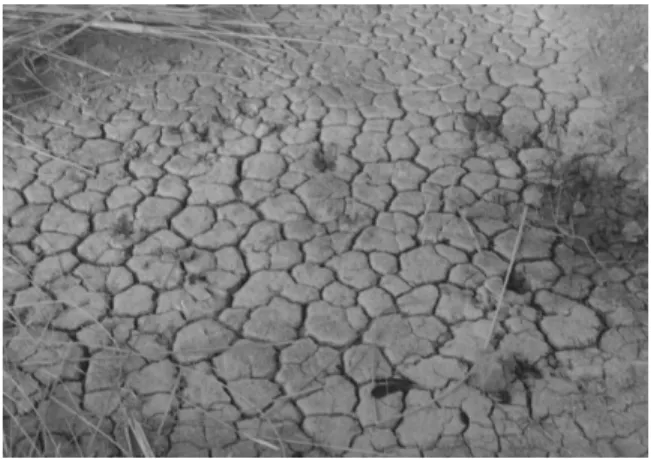
characteristics including swell potential and swell pressure of such soils. Based on the mineral present, the swell potential of the soil varies; the Montmorillonite group minerals have the maximum swell potential and the Kaolinite family minerals have the least swelling properties. As a simplest identification of such soils in the field, wide spread shrinkage cracks on the ground surface can be observed as shown in Figure 2.
Fig.1 Damages in structures founded on swelling
soils: (a) Cracks in residential building that have been repaired; (b) Failure of partition wall due to diagonal expansive crack [7]. Many empirical models have been proposed by various researchers for predicting the swelling properties of such soils on the basis of physical and index properties. The evaluation of swelling parameters (swell potential and swell pressure) of such soils includes both direct as well as indirect measurements. The direct methods involve the physical measurements of swell potential and swell pressure through laboratory tests; however, the indirect methods involve the use of empirical models and correlations formulated on the basis of basic soil properties. Nevertheless, these models provide an initial prediction of the swelling characteristics which
may not be as accurate as the direct evaluations. A number of correlations between index properties and the swelling characteristics have been developed in the past for a variety of expansive soils, some of which are presented in Table 1.
Fig.2 Typical appearance of expansive soil with
ground cracks [7].
Table 1 Empirical correlations for predicting the swelling parameters by various researchers.
Correlation Author Reference
Sp (%) = BeA(PI) Chen [5]
Sp (%) = 7.518+0.323(Cf) Muntohar [11] Sp (%) = 60K (PI) 2.44 Holtz et al., [8] Note: Sp: swell potential; PI: plasticity index; A:
activity; Cf: clay fraction; B and K are empirical constants.
No special considerations were made in these correlations to incorporate the remolding or natural moisture content of the expansive soils, which certainly has a significant influence on soils exhibiting certain degree of swell potentials. The role and significance of natural moisture content has been identified and incorporated in the prediction models presented in this study.
In this study, a comprehensive experimental scheme has been undertaken at Geotechnical Engineering Laboratory, University of Engineering and Technology, Lahore Pakistan, to investigate various factors controlling the swelling characteristics of expansive soils. The test samples were produced by mixing bentonite in various proportions into a low swelling lean clay (CL). The
(a)
analyses of test results and observations made during the experiments have been reported herein. The interpretations facilitated the development of simple empirical correlations between the index properties such as remolding moisture content, activity (ratio of plasticity index and clay fraction), and the swelling parameters (swell potential and swell pressure) of expansive soils.
The proposed correlations are subsequently validated with the experimental results of twenty six (26) swelling soils. A comparison with the previously published correlations broadly justified the accuracy of current correlations for the local expansive soils of Pakistan. The potential hazards posed due to the presence of swelling soils may be significantly avoided during the operational phase of a facility, provided the presence of such soils is timely identified and accordingly the corrective or remedial measures are implemented during the construction phase.
2. Test Materials and Methods
2.1 Soil Sample
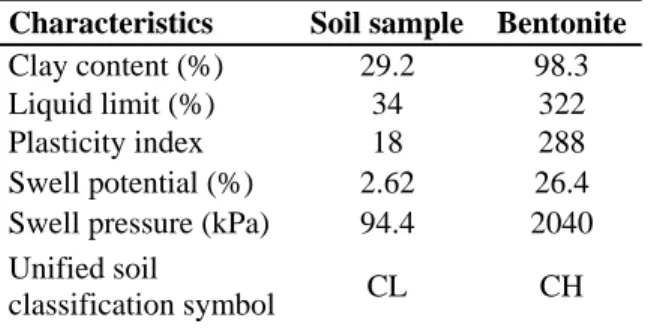
The laboratory testing for the current research was conducted in two steps; a preliminary laboratory investigation of a disturbed soil sample collected from Dera Ghazi Khan (Pakistan) and then the evaluation of soil properties for the soil sample prepared by mixing bentonite in the virgin soil. Table 2 summarizes the comparison of basic soil properties of soil sample and the bentonite used in this research.
Table 2 Properties of test materials
Characteristics Soil sample Bentonite
Clay content (%) 29.2 98.3
Liquid limit (%) 34 322
Plasticity index 18 288
Swell potential (%) 2.62 26.4 Swell pressure (kPa) 94.4 2040 Unified soil
classification symbol CL CH
Note: Samples for swell tests were prepared as per Standard Proctor, ASTM D-698. .
2.2 Bentonite
Bentonite is a family of clay minerals, produced by the weathering of volcanic ash, and is highly
hygroscopic in nature. From a variety of commercially available types, sodium bentonite has been used in the current research work. The laboratory investigation classified it as high plastic (CH), exhibiting liquid limit of 322%, plastic limit of 34%, 55% of particles less than 2 micron[11].
2.3 Test Sample Preparation
The tested soil consisted of a statically compacted uniform mixture of the selected soil sample and the bentonite. The mixture possessed following properties in general; significant volume changes upon wetting and drying, appropriate water permeability that allowed the time required for equalization to be kept within reasonable limits to facilitate a uniform mix [11]. Bentonite powder was mixed maximum up to a dry mass ratio of 55% with 45% soil. Total twelve (12) mixed samples were tested to determine basic engineering properties and swell characteristics. Table 3 summarizes the laboratory assessments of the mixed soil samples.
The compaction characteristics (optimum moisture content and maximum dry unit weight) were determined using standard compaction test procedure [1], and the results are reported in Table 3. The mixtures of bentonite and soil were compacted using standard compaction test procedure at optimum moisture content (OMC).
Distilled water was used for sample preparation to avoid any chemical reactions. Specimens (38.1 mm in diameter and 19.05 mm high) were then one-dimensionally compacted in a metallic ring at optimum moisture content to achieve maximum dry density. The degree of saturation was kept around 40%. A uniform mixture of soil and bentonite was prepared at a temperature 22+0.5 Co and average relative humidity of 50% to achieve a hygroscopic water content equals to the optimum moisture content of the mix.
2.4 Swell Test Procedure
There are three methods available in literature for the laboratory assessment of swelling parameters (swell potential and swell pressure) [16]. Method 1, presented by [16] was opted in current research. The test procedure involved the placement of soil sample in a conventional oedometer, and then allowing it to
swell one dimensionally to equilibrium upon imbibition of water. The total percentile increase in the specimen height, compared to the original height, is termed as the swell potential of the soil. The swollen sample was then loaded in small increments to restore its original height. This load per unit cross sectional area of the specimen is termed as swell pressure. Care had been taken to avoid the application of excessive loads, causing additional compression of the sample, by applying a load and waiting until needle of deflection gauge ceases to move further for a considerable time.
3. Results and Discussion
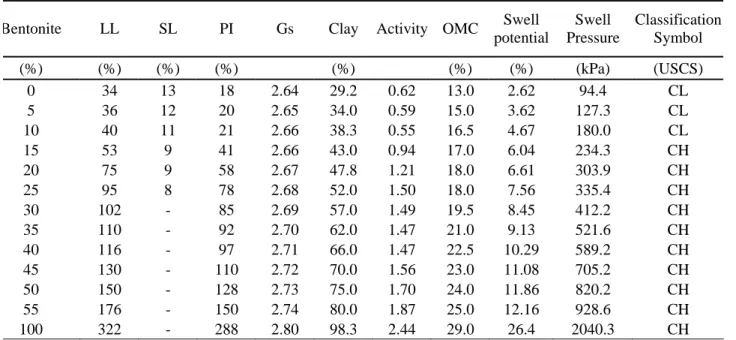
Table 3 summarizes the experimental results for all the tested samples. As expected, the clay fraction increases linearly with the bentonite content. The liquid limit as well as plasticity index of the soil samples also increased tremendously, confirming the suitability of using bentonite as an artificial tool to enhance the index properties. The choice of using bentonite in the current research was made on the basis of results of a preliminary investigation carried on various available options. The rationale of similarity of dominant mineral, imparting the swelling characteristics in the soil and the chemical, was used in the selection to avoid undesired chemical discrepancies in the mixture. The X - ray diffraction
analyses confirmed the presence of montmorillonite as the basic constituent mineral in the soil sample and the bentonite used in current study [11], results of which are not presented here for brevity.
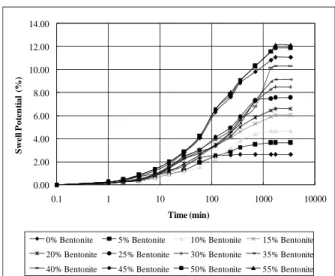
The swelling characteristics investigated in this research include the swell potential as well as swell pressure of the mix. Swell potential is defined as the ratio of the amount of swell to the original thickness of the sample expressed as a percentage, whereas, the swell pressure is the load per unit area required to avoid increase in volume of the soil sample, upon moisture addition. The test procedure outlined by [11] and [16] was used to perform the swell tests on the bentonite and soil mixes, including the determination of swell potential and swell pressure. Drastic increase was observed in the swell potential values of soil samples with increasing percentages of bentonite [Figure 3]. The time required for a soil sample to show a specific magnitude of swell potential significantly decreased with the increasing contents of bentonite. The results of swell potential tests, including the respective swell pressure values are also summarized in Table 3.
The index properties include the clay fraction, plasticity index and the activity of the soil-bentonite mix. Significant increases were found in the liquid
Table 3 Summary of laboratory test results
Bentonite LL SL PI Gs Clay Activity OMC Swell
potential
Swell Pressure
Classification Symbol
(%) (%) (%) (%) (%) (%) (%) (kPa) (USCS)
0 34 13 18 2.64 29.2 0.62 13.0 2.62 94.4 CL
5 36 12 20 2.65 34.0 0.59 15.0 3.62 127.3 CL
10 40 11 21 2.66 38.3 0.55 16.5 4.67 180.0 CL
15 53 9 41 2.66 43.0 0.94 17.0 6.04 234.3 CH
20 75 9 58 2.67 47.8 1.21 18.0 6.61 303.9 CH
25 95 8 78 2.68 52.0 1.50 18.0 7.56 335.4 CH
30 102 - 85 2.69 57.0 1.49 19.5 8.45 412.2 CH
35 110 - 92 2.70 62.0 1.47 21.0 9.13 521.6 CH
40 116 - 97 2.71 66.0 1.47 22.5 10.29 589.2 CH
45 130 - 110 2.72 70.0 1.56 23.0 11.08 705.2 CH
50 150 - 128 2.73 75.0 1.70 24.0 11.86 820.2 CH
55 176 - 150 2.74 80.0 1.87 25.0 12.16 928.6 CH
100 322 - 288 2.80 98.3 2.44 29.0 26.4 2040.3 CH
limit, plasticity index and ultimately in the activity of the soil-bentonite mix with the increasing bentonite content. The clay fraction reached to 80% from 29.2% in the original sample, plasticity of the soil sample prior to the bentonite addition was 18 which reached to 150 and the activity increased to 1.87 from 0.62 upon bentonite addition up to 55%. Appreciable increases in the basic soil properties were also observed such as; the specific gravity increased from 2.58 for the original sample to 2.74 for the bentonite content of as high as 55%.
The increasing percentage of bentonite in the mix significantly increases the optimum water content of the soil-bentonite mix. Since the fraction of the sizes smaller than 0.002 mm is increasing with the addition of bentonite in the mix, the mean surface area of the soil particles is also increasing. Thus more water is demanded by the soil particles to get lubricated and to achieve maximum dry density. Table 4 also highlights the significance of bentonite content in the mix on the optimum moisture content of the sample. Many researchers have quoted the prime importance of the moisture content on swell characteristics of swelling soils. Increasing moisture content to an optimized level enhances the swelling properties of all swelling soils [4] and [14]. The OMC values increased significantly from 13% to 25% upon increasing bentonite content from 0% to 55% in the soil-bentonite mix.
Figure 3 shows swell-time history of the soil-bentonite mix for all the test samples. Percentage swells for more than 48 hrs imbibitions of water in the specimens, increases significantly with the increasing percentage of bentonite in the mix. Figures 4 and 5 present the variations of swelling characteristics with the increasing activity of the soil-bentonite mix. As previously defined, activity (A) is a ratio of plasticity index to the clay fraction of a soil sample. It was observed that with the mixing of bentonite, the clay fraction started increasing rapidly because the particle size of bentonite is even smaller than that of clay, but the plasticity index kept increasing at slower rates up to the mixing of 10% bentonite. Thus the ratio of the two kept decreasing for first three soil samples; however, it started getting increased from 15 % and so, as can be observed from Figures 4 and 5.
0.00 2.00 4.00 6.00 8.00 10.00 12.00 14.00
0.1 1 10 100 1000 10000
S
w
e
ll P
o
te
n
tia
l
(%
)
Time (min)
0% Bentonite 5% Bentonite 10% Bentonite 15% Bentonite
20% Bentonite 25% Bentonite 30% Bentonite 35% Bentonite
40% Bentonite 45% Bentonite 50% Bentonite 55% Bentonite
Fig.3 Time histories of swell potential for samples mixed with different fraction of bentonite
0 2 4 6 8 10 12 14
0 0.5 1 1.5 2 2.5
S
w
e
ll Po
te
n
tia
l (
%
)
Activity
Fig.4 Swell potential variation with activity of bentonite mixed clay samples.
0 100 200 300 400 500 600 700 800 900 1000
0 0.5 1 1.5 2
S
w
el
l P
res
su
re
(k
P
a
)
Activity
Fig.5 Swell Pressure variation with activity of bentonite mixed clay samples.
Again, a similar observation was made at bentonite content of 25% to 40%, wherein, the activity decreased slightly from 1.50 to 1.47. The probable explanation is the same that the activity being a ratio of two distinct index properties is equally sensitive to both. The clay fraction is determined merely on the basis of particle sizes, and is literally insensitive to the cation exchange capacity as well as other inter-particle Van der Vaal forces. On the contrary, the plasticity index (PI) is a soil property governed by these inter-particle interactive agencies. The activity simultaneously incorporates all these attributes, and hence being used along with the moisture content of the soil in the development of currently proposed models. Table 3 collectively summarizes the variations in soil properties and swell characteristics of the soil-bentonite mix, with the increasing bentonite content. These significant increments in the soil properties upon increasing bentonite content of the mix have been used to establish mathematical models for the prediction of swell characteristics.
4. Data Analysis and Interpretation
To obtain the predictive models among the parameters investigated in this study, multiple regressions were performed. The relations between swell potential as well as swell pressure with the other parameters were analyzed employing various mathematical functions such as exponential, linear, logarithmic and power functions. Statistically, the linear functions proved to be the strongest and most significant choice among all, and regression equations were established among index properties and swelling characteristics [Table 4]. At 95% confidence level, both correlations were found to be statistically significant.
4.1 Regression Models
The objective of using regression analysis in this research is to obtain a well-defined mathematical relationship among swelling characteristics and the index properties. Table 4 presents the prediction models developed in this research with the relevant coefficients of correlations. These correlations were established using Minitab 15 software, with two independent variables and an error of the correlations for the incorporation of all other factors. One of the independent variables was the remolding moisture
content and the other was one of the index properties of the soil specimens, for which the activity turned out to be a more realistic choice as it incorporates the other major index properties such as plasticity index and clay fraction.
Table 4 Prediction models for assessing the swelling characteristics.
Predictive Model Regression
statistics
55
.
7
68
.
0
92
.
1
+
−
=
np
A
W
S
R2 = 0.995S = 0.26
915
68
6
.
43
+
−
=
ns
A
W
P
R2 = 0.958S = 52.3 Note: Sp= swell potential (%), Ps= swell pressure
(kPa), A=activity, Wn =natural moisture content
(%), S= standard error of mean, R2 = coefficient of determination.
4.2 Validation of models
The correlations presented in Table 4 were then validated experimentally for various other swelling soil sites, including in the main study [11]. Figure 6 present the experimental values of swell potential plotted against the predicted values of the same based on activity and natural moisture content. Similarly, Figure 7 shows the graphical comparison between experimental and predicted results of swell pressure. A good correlation between experimental and predicted values affirms the suitability of linear correlation in the multiple regression analysis for the current test data. The scatter of data points largely follows the trend of 1:1 line, and is plotted over the line in both figures, which suggests conservative predictions from both models, when compared with the experimental results. Small discrepancies are may be associated to the choice of error and the independent variables in the correlations, however, the proposed correlation conservatively predicts the swell potential, with the standard error of mean not exceeding + 10%. Deviation of some of the points from 1:1 line in these plots is justified because of the fact that these prediction models are based upon only two variables and one constant, whereas, the experimentally evaluated swelling characteristics are controlled by many variables in actual [12] and [16].
0 2 4 6 8 10 12 14
0 2 4 6 8 10 12 14
Sp by C o r r e la ti o n (% )
Sp by Experiment (%)
99
.
0
55
.
7
68
.
0
92
.
1
2=
−
+
=
R
W
A
S
p nFig.6 Comparison between experimental and
predicted values of swell potential
0 100 200 300 400 500 600 700 800 900 1000
0 100 200 300 400 500 600 700 800 900 1000
P s b y C o rrel a ti o n (k P a )
Ps by Experiment (kPa)
95 . 0 915 68 6 . 43 2= − + = R W A
Ps n
Fig.7 Comparison between experimental and
predicted values of swell pressure.
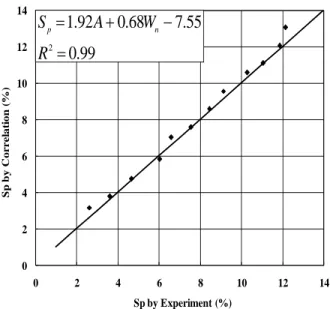
The results of swell potential from the prediction models of [5] and [9] are compared with the results of currently proposed correlation for swell potential in Figure 8. The scatter of the points plotted by the current correlation is found comparatively closer to the 1:1 line and shows a good correlation with the experimental values than those from the correlations proposed by [5] and [9]. It can be observed from Figure 8 that the incorporation of moisture content as a variable in currently proposed prediction model has enhanced the accuracy of prediction. This is consistent as a dry soil possesses
an enhanced affinity and more capacity for absorbing the water, thus undergoes higher volumetric changes.
0 1 2 3 4 5 6 7 8
0 1 2 3 4 5 6 7 8
Sp by C o r r e la ti o n s (% )
Sp by Experiments (%) Auther
Holtz et al; Chen
Sp= 1.92A+0.68Wn-7.55
Sp= 60k (PI)2.44
Sp = BeA(PI)
± 10 %
Fig.8 Comparison of experimental and predicted
values of swell potential from various models On the contrary, the similar soil when moist absorbs lesser quantity of water and thus exhibits lesser volumetric changes. Similar observations were made during the preliminary investigations in the laboratory, by varying moisture content of a sample with fixed bentonite content [11].
This intimated the selection of moisture content as a variable in the prediction models proposed herein. However, the predictions of swell potential by [5] and [9] are rather poor for the same test data. The model proposed by [9] is largely under-estimating the swell potential as most of the points plot well below the 1:1 line. On the other hand, the model proposed by [5] seems to claim a partial success, whereby a larger proportion of prediction points follow the 1:1 line, with some over-estimated predictions, which is acceptably conservative.
Figure 9 presents the predicted values of swell pressure from proposed correlation, plotted against the experimental results for the same data points. It can be observed that the majority of the data points plot very close to the 1:1 line, and the scatter largely remained within a more acceptable envelope of + 5%. The swell pressure may had been considered less critical by the researchers compared to the swell potential, which could be the reason that no published prediction models were found by the authors for comparison.
0 100 200 300 400 500
0 100 200 300 400 500
P
s b
y
C
o
rr
el
a
ti
o
n
s
(k
P
a
)
Ps by Experiments (kPa)
Author Ps= 43.6A+68Wn-915
±5%
Fig.9 Comparison of experimental and predicted
values of swell pressure from current model However, the correlations proposed in this study are capable of estimating the swelling characteristics with reasonable accuracy and competent statistics.
5. Conclusions & Recommendations
Following are the main findings of this study; There exist unique relationships between the index properties and the swelling characteristics of swelling soils. The increasing atterberg’s limits such as PI from 18% to 150% impart significant increases in the values of swell potential and swell pressure from 2.62% to 13.36% and 94.2 kPa to 928.6 kPa, respectively.
The moisture content plays an important role for controlling the swelling characteristics of soils. The natural moisture content of the undisturbed soil sample was 22.5% with the corresponding swell potential 1.45% and the swell pressure as 61.1 kPa. However, the sample prepared at optimum moisture content i.e. 13%, showed swell potential of 2.62% and the corresponding swell pressure equal to 94.4 kPa. These observations established the importance of role of remolding moisture content in controlling the swelling characteristics and encouraged its incorporation in the proposed models.
The correlations are proposed for the prediction of swell potential and swell pressure on the basis of activity and the natural moisture content of the soil sample through multiple linear regression. Activity
simultaneously incorporates both; the plasticity index and the clay fraction. The predicted results from these correlations were plotted against the experimental results and a significant number of points followed the trend of 1:1 line with the standard error of mean not exceeding +10%. These models are additionally compared with the well-known published models of [5] and [9] for the local swelling soils of twenty six (26) sites in Pakistan. The current proposed models successfully predict the swelling characteristics, whereas, the model of [9] underestimate for majority and that of [5] overestimate for few of the samples. The probable explanation is that the incorporation of moisture content in the current proposed correlations enhances the rigor of prediction for which the other models are insensitive.
The proposed correlations may be treated as a reliable tool to estimate the swelling characteristics with carefully evaluated index properties in hand. As part of obvious limitations, the proposed correlations are dependent on the natural moisture content of the expansive soils and their use is strictly warranted for the swelling soils with montmorillonite being the dominant mineral. However, the most reliable and appropriate method to accurately evaluate the swelling characteristics is still the laboratory swell test.
References
[1] American Society of Testing and Materials; Standard test method for laboratory compaction characteristics of soils using standard effort, Annual Book of Standards, ASTM-D698-07 2007b. West Conshohocken, Pennsylvania [2] Assadi and Shahaboddin; 2009. A
micro-mechanical approach to swelling behavior of unsaturated expansive clays under controlled drainage conditions, Applied Clay Science, 45, 8–19.
[3] Avsar, E., Ulusay, R. and Sonmez, H; 2009. Assessments of swelling anisotropy of Ankara clay, Engineering Geology 105, 24–31.
[4] Basma, A. A; 1995. Cyclic Swelling behavior of clays, Geotechnical Engineering Journal, 121-7, 562-565.
[5] Chen, F. H; 1975. Foundation on swelling soils, Development on Geotechnical Engineering 12. Elsevier Scientific Co, Amsterdam, 150-158. [6] Ene and Okagbuea; 2009. Some basic
geotechnical properties of expansive soil modified using pyroclastic dust, Engineering Geology Journal, 107, 61-65.
[7] Farooq, K; 1996. Engineering Characteristics of Expansive Soils in Pakistan, M.Sc. Thesis, University of Engineering and Technology, Lahore, Pakistan.
[8] Ferber, V., Auriol, J.C., Cui, Y. J. and Magnan, J. P; 2009. On the swelling potential of compacted high plasticity clays, Engineering Geology Journal, 104-3, 200–210.
[9] Holtz, W. G. and Gibbs, H. J; 1956. Engineering properties of swelling clays, Transaction ASCE, 121, 641–677.
[10] Huang and Wu; 2007. Stability analysis of unsaturated expansive soil slope, Earth Science Frontiers 14-6, 129–133.
[11] Israr, J; 2012. Development of correlations between index properties and swelling characteristics of swelling soils, M.Sc. Thesis, Department of Civil Engineering, University of Engineering and Technology Lahore, Pakistan. [12] Muntohar, A. S; 2000. Prediction and
classification of swelling clay soil. (eds), Swelling soils recent advances in characterization and treatment, London, 25-36. [13] Okagbue; 1990. Expansive soils in engineering
construction: a review of practices, Mining and Geology Journal, 2, 123–129.
[14] Rashid, I., Farooq, K., Mujtaba, H., and Khan, A. H; 2013. Treatment of expansive clays through compaction control, Pakistan Journal of Science, 65-1, 103-107.
[15] Shi, B., Jiang, H., Liu, Z., and Fang, H.Y; 2002. Engineering and geological characteristics of swelling soils in China, Engineering Geology Journal, Volume 67, 63–71.
[16] Sridharan, A., Gurtug, Y; 2003. Swelling behaviour of compacted fine-grained soils, Engineering Geology Journal, 72, 9-18.