Implementation of ISO 50001:2001 framework in a
textile unit of Pakistan
Tauseef Aized*, Hafiz Muhammad Zubair, Syed Muhammad Sohail Rehman, Awais Ahmad Khan Mechanical Engineering Department, University of Engineering and Technology, Lahore
Corresponding Author: Email: [email protected]
Abstract
The higher energy demand imposes burden on country’s economy, specifically for the countries which are import dependent for energy supplies. Pakistan is an emerging economy which is going through an energy crisis due to sharp rise in demand-supply gap. Industry is the largest energy consumer of Pakistan including textile as the largest industry of the county in terms of exports and gross domestic product. ISO 50001:2001 energy management system was implemented in Shafi Texcel Ltd. to reduce the energy consumption of the textile unit. Energy performance indicators were identified (3 in the current study) and objectives were formulated to reduce the steam consumption in processes and reduce coal consumption or boiler efficiency enhancement. The targets were met with fairly small payback periods (less than 3 months), which means that it is convienent to implement energy management system in a short period of time without huge capital expenses. It also ensures that although the renewable energy systems are helpful and must be incorporated but management of already available sources is also essential for sustainable energy future. The savings of Rupees 15.6 Million will achievable annually after an investment cost of 2.2 Million Rupees.
Key Words: ISO50001; Textile, Energy sector, Pakistan; Energy Management System
Nomenclature
BOQ Bill of Quantity
EnMS Energy Management System EnPI Energy Performance Indicators GCV Gross Calorific Value
LPG Liquid Petroleum Gas MCU Moisture Control Unit MW Mega Watt
STL Shafi Texcel Ltd.
SFC Specific Fuel Consumption TWH Tara Watt Hour
1.
Introduction
The ever increasing population of the world demands continuous development of new energy sources and efficient utilization of already discovered energy sources. The increased awareness regarding the global warming has also effectively emphasized on efficient conservation of energy sources. The sustainable future energy solutions have bound the scientific society to look for efficient conversion, utilization and management of energy sources.
The energy conservation and management schemes depend on the national and international energy policies in general, however, in the modern
world the paradigm has been observed and now the management schemes are practiced at institution or organizational levels in order to obtain monetary benefits and sustainability.
This work presents a case study of energy management system implementation in Pakistan. Pakistan is a country with emerging economy.The population boom resulted in 148 million in 2004 which was initially estimated to be 68 million in 1971. The urbanization of the country also increased from 25% to 37.2% [1]. Both these factors caused a rapid increase in energy demand of the country. The primary energy supply mix of
Pakistan is made of 72.2% oil & gas, 16.2% electricity, 10.4% coal and 1.2% LPG. Domestic oil fulfills only one sixth of country’s demand, which force a huge expenditure on country’s economy [2]. Renewable energy source development has a significant cost and the policies did not encourage the development of such sources till 2013 to meet the increasing requirements of energy. It was reported in [3] that the renewable energy mix was virtually negligible till 2012. The demand-supply gap of electricity was noted to be 31.6 TWh in 2010 which resulted in 2.5% loss in GDP of the country [4]. It was noted that if the energy mix and utilization levels remained unchecked, the global warming potential due to electricity generation will increase 22.2 million tons of CO2 in 2012 to 55.2 million tons of CO2 equivalent by 2030 [5]. Due to the energy lack of fossil fuel availability and import burdens there is a severe energy deficit specifically in the electric power supply. Urban areas are facing 10-12 hour of load shedding while rural areas have to bear 16-18 hours of power outage [6] with an electric demand supply difference of 6500MW in 2015 [7]. The current energy scenario in Pakistan requires drastic measures to meet its energy demands and ensure sustainable future. The measure includes development of renewable energy sources and implementation of energy management schemes to improve the energy conversion efficiency. The development of renewable energy sources require investment, time and technological capabilities at large scale, however, the energy management scheme implementation is less costly and relatively faster to implement.
The energy consumption of Pakistan is 39.4 Million TOE (tone of oil equivalent) in 2013 [8] and is presented in Fig 1. It can be seen that major consumer of energy is industrial sector. Effective energy management and conservation scheme in this sector will directly result in reduction of energy load of the country.
The industrial sector is the primary and main contributor in total energy consumption of Pakistan and biggest energy saving opportunities which are about 33% lies in this sector and also 38% carbon dioxide emissions can be reduced from this sector [9]. Center for Energy and Environment Management (CEEM) has been established by National Productivity Organization (NPO) & Ministry of Industries and Production Pakistan with an objective to attain highest efficiency in proper utilization of energy in industrial sector with the help of energy saving measures.
Fig. 1: Energy consumption of Pakistan
This will contribute a major portion towards economic growth of the country. The team of CEEM-NPO has conducted over 200 Energy audits in industrial sector of Pakistan and identified up to 15 % of energy savings potential [10].
Fig. 2: Industrial Energy Consumption [8]
Textile sector consumes about 17% of total industrial energy, which is the second largest energy intensive industry after cement industries as presented in Fig 2. The Pakistan textile sector contributes to more than 60% of total exports and it is the largest manufacturing sector of Pakistan’s industry but the power shortage has negatively affected the textile industry which was 8.5% of GDP [11]. In general the cost of energy is between 15 to 20% of the production cost in textile industry, the cost is as big as comparable to the costs of raw materials [12], therefore it is very important to ensure efficient utilization of energy sources and conserve as much as possible to improve the revenue of textile industry and reduction of energy import burdens on the country.
It was found that the energy-efficiency potential of small medium industries remains untapped mainly due to lack of technological improvements at operational level and lack of strategic approach. It was recommended that a Plan-Do-Check-Act based energy management scheme, energy efficiency and cleaner production
should be adopted [13]. It is suggested that by implementation of energy management programs, the organizations can save upto 20% on their energy bills and can also achieve savings up to 5% to 10% with minimal investments, with effectively cutting operational costs [14]. Implementation of energy management schemes depend on the existing organizational structure, present knowledge, capacity and most importantly availability of human and financial resources. Several attempts have been made at national level to develop energy management systems but the general regulations, uniformity and conformance was missing at international level [15]. Previously ISO 14001 standard was introduced in 1996, as “the part of the overall management system that includes organizational structure, planning activities, responsibilities, practices, procedures, processes and resources for developing, implementing, achieving, reviewing, and maintaining the environmental policy”. However, it does not set any environmental goals or targets to be achieved (reduction in greenhouse emissions or recycling etc.) [16]. In general the environmental improvement also incorporated improved energy source utilization. In June 2011, ISO 50001 International standard was developed to provide a unified framework for energy management. According to ISO 50001, an energy management system (EnMS) is a set of interrelated or interacting elements to establish an energy policy and energy objectives, and procedures to achieve those objectives [17]. Therefore, the implementation of ISO 50001 will greatly influence energy savings and process streamlining. The advantages of ISO 50001- implementation include:
➢ Reduce the costs related to energy consumption ➢ Limit the effect of highly variable energy prices ➢ Assist operational cost savings
➢ Improved supply chain relationships ➢ Ability to meet any legal targets ➢ Improved profile and credibility
➢ Competitive advantage in the market place ➢ Reduce threat from the image of competitors ➢ Employee motivation and pride
➢
Valuable inputs from third party auditors This paper presents the implementation of ISO 50001 in a textile unit of Pakistan. Although the regulations of ISO 50001, are well declared and documented in the standard itself and there are various research papers presenting energy policies in textile industry, this paper will identify the key performance indicators to work with, when implementing the ISO 50001 standard. The resultswill highlight the quantity of energy savings that can be performed in textile sector of Pakistan. It also highlights the challenges and limitations of implementation of the standard in Pakistan.
2.
Methodology
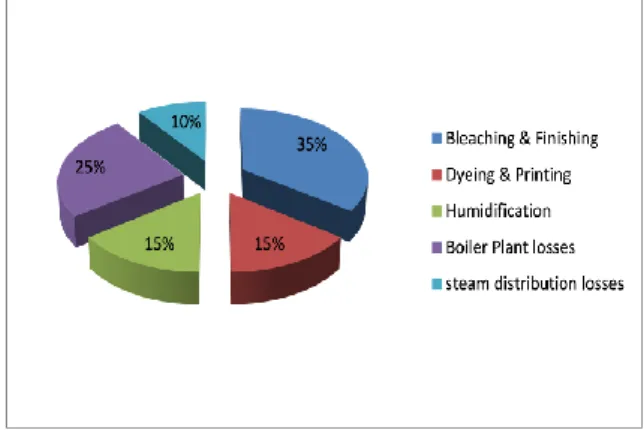
The textile energy consumption in various processes is presented in Fig 3 [8].
Fig. 3: Break-down of typical thermal energy usage in textile plant
Textile sector is a big consumer of energy & among in its sub sectors processing or finishing of fabric consumes more energy than other sectors so we choose thissector for the implementation of ISO 50001. Shafi Texcel Ltd. is situated near Sunder Industrial estate at Raiwind Manga Road. It is considered one of the major textiles in Punjab province of Pakistan, with a capacity of 200,000 meters fabric processing per month. Main fuels that are used include gas, coal, LPG & diesel while the main utilities include water, steam, electricity, thermal oil & compressed air.
There are three sub units in Shafi Texcel limited (STL) which are Yarn dyeing, Weaving and processing but processing was chosen as it is the bigger consumer of energy among all these. To provide utilities to all three units there is a separate utilities department which looks after for electricity, steam, water etc.
According to ISO 50001, the energy management system was established on the philosophy of quality management system that is PLAN, DO, CHECK & ACT, commonly known as PDCA cycle.
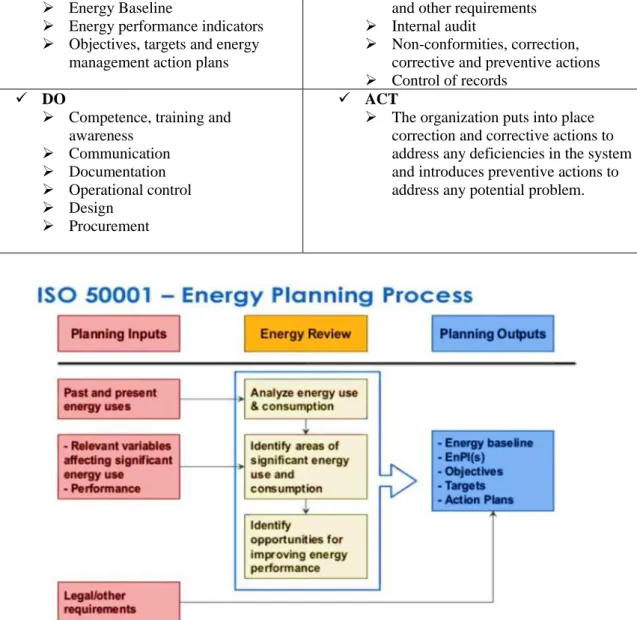
Fig 4 presents the general structure of energy planning process. The energy planning process require the identification of key performance indicators, method to measure the variable effecting them and then review of current energy consumption scenario.
The details of which can be presented as following: ✓ Plan
➢ Legal and other requirements ➢ Energy Review
➢ Energy Baseline
➢ Energy performance indicators ➢ Objectives, targets and energy
management action plans
✓ CHECK
➢ Monitoring, measurement and analysis ➢ Evaluation of compliance with legal
and other requirements ➢ Internal audit
➢ Non-conformities, correction, corrective and preventive actions ➢ Control of records
✓ DO
➢ Competence, training and awareness
➢ Communication ➢ Documentation ➢ Operational control ➢ Design
➢ Procurement
✓ ACT
➢ The organization puts into place correction and corrective actions to address any deficiencies in the system and introduces preventive actions to address any potential problem.
Fig. 4: Energy planning process
2.1 Data Collection
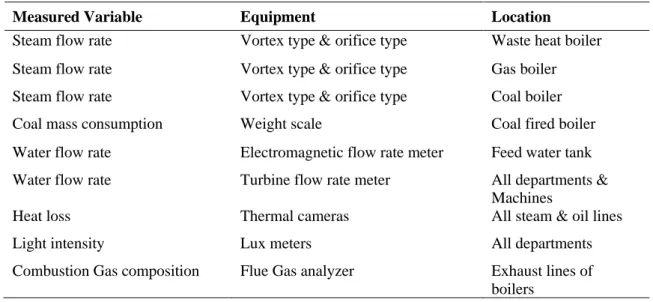
For the current case study, after careful examination of process energy flow, some key areas were identified where data collection was required. The equipment used to measure the variables affecting the key performance indicator are listed in table 1.
2.2 Energy Review
After the data collection, it was analyzed and reviewed for to establish and maintain an energy planning process, a system for identification and analysis of energy consumption and to identify
significant energy uses, also to find out the opportunities for energy efficiency and reduction in energy. The procedure of energy review included the following:
➢ Energy consumption data recorded and maintained on daily basis.
➢
All members of energy management team, comprising Energy Manager and HOD’s from theconcerned departments, conduct energy aspect identification and evaluation on yearly basis or whenever there is a major change in facilities, equipment’s, systems or processes. During this process, followings are considered:i. Past and present energy consumption and energy factors based on measurement and other data.
ii. Identification of areas of significant energy consumption particularly where significant energy changes occur during the last period. iii. An estimate of the energy consumption in
future.
2.3 Energy Performance Indicators
(EnPI)
The energy review resulted in identification and implementation of EnPI’s listed in table 2 in August 2015.
2.3.1 EnPI 01: Reduction in Coal
Consumption
for
Steam
Generation
Objective of EnPI 1: Reduction of coal consumption from 145kg/ton of steam to 125kg/ton of steam at 40-50% loading on boiler by proper
burning of coal and maximum usage of energy in exhaust gases.
Target: April, 2016
Project 01: The flue gas analysis revealed that the temperature of exhaust gases is high, although economizer was installed at the outlet of boiler to extract heat from flue gases but it was observed that when water level is full in boiler, water is not flowing through economizer and flue gases are just passing carrying heat. So, it was recommended to install a three-way valve after economizer which will divert water after economizer to feedwater tank when water level is full in boiler so water circulation will not stop even when water level is full hence extracting complete energy from flue gases which will ultimately increase the efficiency of boiler and reduce the coal consumption for steam generation. The boiler efficiency was calculated by Eq. 1.
𝐵𝑜𝑖𝑙𝑒𝑟 𝐸𝑓𝑓𝑖𝑐𝑖𝑒𝑛𝑐𝑦 (𝜂) =𝑄(𝐻−ℎ)𝑞(𝐺𝐶𝑉)∗ 100 (1)
Table 1: Equipment for data collection for analysis
Measured Variable Equipment Location
Steam flow rate Vortex type & orifice type Waste heat boiler Steam flow rate Vortex type & orifice type Gas boiler Steam flow rate Vortex type & orifice type Coal boiler
Coal mass consumption Weight scale Coal fired boiler
Water flow rate Electromagnetic flow rate meter Feed water tank Water flow rate Turbine flow rate meter All departments &
Machines
Heat loss Thermal cameras All steam & oil lines
Light intensity Lux meters All departments
Combustion Gas composition Flue Gas analyzer Exhaust lines of boilers
Table 2: EnPI’s to be expedited
EnPI # EnPI Title Area/Department Base line value Unit EnPI 01 Specific coal consumption
for steam generation
Utilities 125 kg of coal/Ton of steam
EnPI 02 Specific steam consumption
Processing 2.0 kg of
steam/meter of Fabric
EnPI 03 Specific coal consumption for Oil Heating
Utilities 200 kg of
coal/MkCal of heat transfer
Table 3: Action Plan for EnPI 01(Project 01)
Sr.
No. Activity Time Frame Responsibility
1. Installation of steam flow meter at boiler for cross check of water flow meter
15th September 2015
Maintenance Manager
2. Setting running frequencies at moderate level & educating operators to run boiler efficiently
30th October 2015
U.M & Boiler Engr.
3. Cost benefit & pay back analysis to reduce exhaust temperature up to 150°C
25th October 2015
Utilities Manager
4. Purchase & delivery of three-way water valve to install at exit of economizer to extract heat from exhaust gases
10th December 2015
Purchase Manager
5. Installation of valve 30th December
2015
Maintenance Mgr.
6. Results and comparisons 20th June 2016 Utilities Manager.
Q= Steam generated (kg/hr)
H = Enthalpy of steam at generated pressure (kJ/kg. K)
h = Enthalpy of water feed to boiler (kJ/kg. K)
q = Heat input OR coal consumed (kg/hr) GCV= Gross Calorific Value of coal Action Plan for project 01 is presented in table 3.
Project 02: During the flue gas analysis, it was also observed that CO percentage is high in exhaust gases which mean unburned fuel. Upon investigation it was found that coal size should be even for proper burning and furnace doors should be kept close. Also frequencies of induced and forced draft fans were adjusted to reduce the unburned coal and hence minimizing the coal consumption for oil heating.
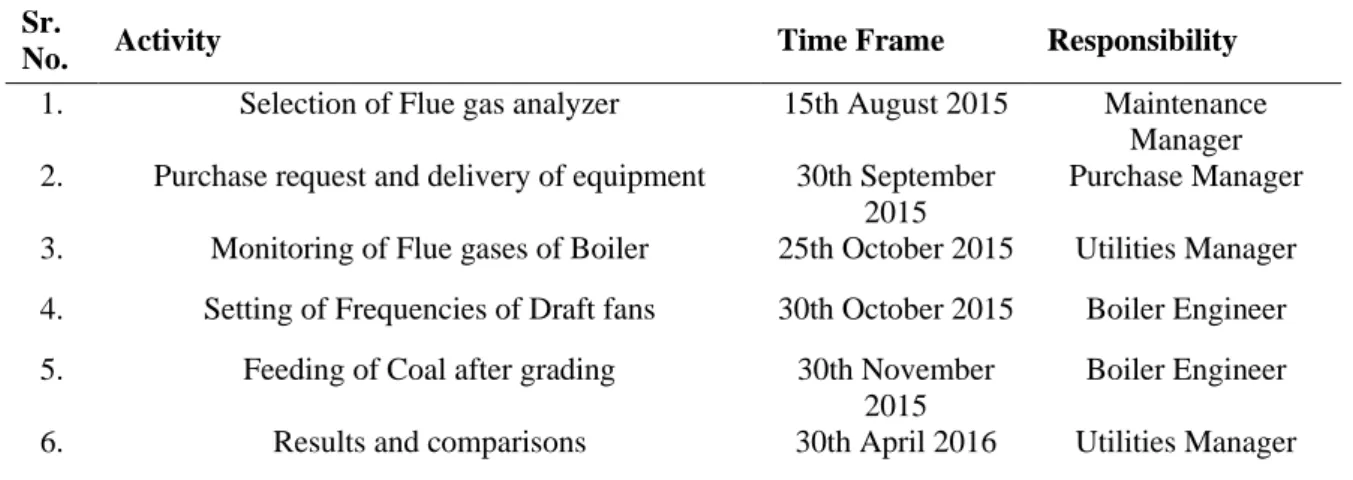
Action Plan for project 02 is presented in table 4.
2.4 EnPI02: Reduction in steam
consumption for processing of
Fabric
Objective of EnPI 02: Reduction of steam consumption from 2.7 kg of steam/meter of fabric to 2.0 kg of steam/meter of fabric.
Target: December, 2016
Project 01: It was observed that steam line losses are about 10%. Line losses were reduced to 5% through thermal graphic analysis of lines, valves and traps. Proper insulation was done and faulty traps were replaced with new ones.
Action Plan for project 01 is showed in table 5.
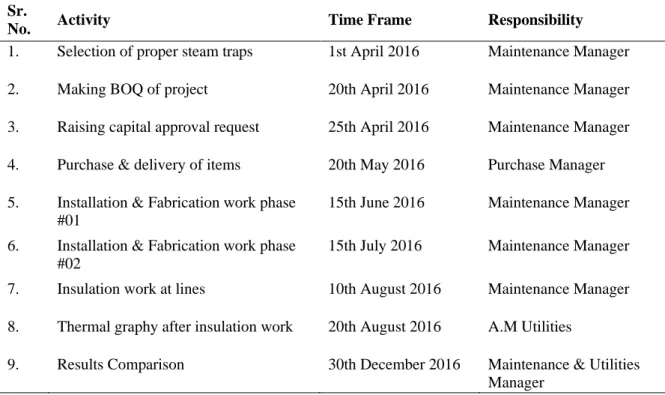
Project 02: Steam was used to increase the feed water temperature of boiler and it was allocated to fabric processed. Self consumption of steam was reduced by 2% through proper condensate recovery from processing unit. Hence it reduces the specific consumption of steam to process fabric. Action Plan for project 02 is presented in table 6.
Table 4: Action Plan for EnPI 01(Project 02)
Sr.
No. Activity Time Frame Responsibility
1. Selection of Flue gas analyzer 15th August 2015 Maintenance Manager 2. Purchase request and delivery of equipment 30th September
2015
Purchase Manager
3. Monitoring of Flue gases of Boiler 25th October 2015 Utilities Manager 4. Setting of Frequencies of Draft fans 30th October 2015 Boiler Engineer 5. Feeding of Coal after grading 30th November
2015
Boiler Engineer
Table 5: Action Plan for EnPI 02 (Project 01)
Sr.NO. Activity Time Frame Responsibility
1. Selection of proper steam traps 10th March. 2016 Maintenance Manager
2. Making BOQ of project 20th March. 2016 Maintenance Manager
3. Cost benefit and pay back analysis 25th March 2016 Maintenance Manager
4. Raising capital approval request 28th March 2016 Maintenance Manager
5. Purchase & delivery of Traps 30th April 2016 Purchase Manager
6. Installation & commissioning 30th May 2016 Maintenance Manager
7. Thermal Graphic of lines, valves etc. 10th June 2016 Maintenance & Utilities Manager
8. Insulation at lines and jackets on valves 30th June 2016 Maintenance Engineer
9. Results & comparison 30th October
2016 Utilities Manager
Table 6: Action Plan for EnPI 02 (Project 02)
Sr.
No. Activity Time Frame Responsibility
1. Selection of proper steam traps 1st April 2016 Maintenance Manager
2. Making BOQ of project 20th April 2016 Maintenance Manager
3. Raising capital approval request 25th April 2016 Maintenance Manager
4. Purchase & delivery of items 20th May 2016 Purchase Manager
5. Installation & Fabrication work phase #01
15th June 2016 Maintenance Manager
6. Installation & Fabrication work phase #02
15th July 2016 Maintenance Manager
7. Insulation work at lines 10th August 2016 Maintenance Manager
8. Thermal graphy after insulation work 20th August 2016 A.M Utilities
9. Results Comparison 30th December 2016 Maintenance & Utilities Manager
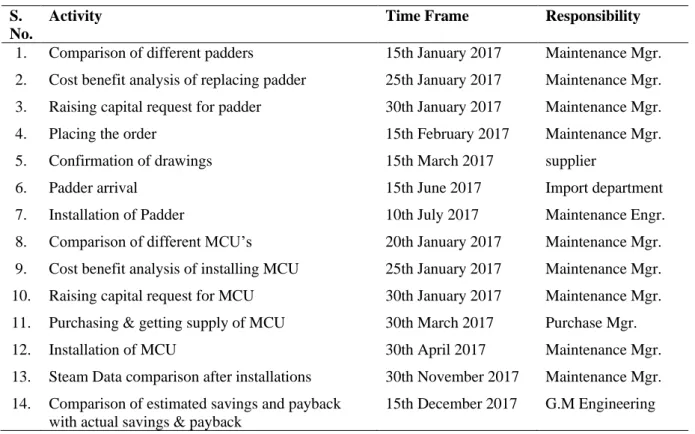
Project 03: In a processing unit, most of the steam is used in washing the fabric and then drying the fabric. If water extraction efficiency can be improved before drying then a huge quantity of steam can be saved. High pressure squeezing padders were used for this purpose.
Also to monitor the drying process, mostly no device is used and operator is doing this by feeling the moisture by hand, it was decided to install the moisture control units at the exit of dryers to check and control the moisture of fabric hence controlling the steam.
Table 7: Action Plan for EnPI 02 (Project 03)
S. No.
Activity Time Frame Responsibility
1. Comparison of different padders 15th January 2017 Maintenance Mgr. 2. Cost benefit analysis of replacing padder 25th January 2017 Maintenance Mgr. 3. Raising capital request for padder 30th January 2017 Maintenance Mgr.
4. Placing the order 15th February 2017 Maintenance Mgr.
5. Confirmation of drawings 15th March 2017 supplier
6. Padder arrival 15th June 2017 Import department
7. Installation of Padder 10th July 2017 Maintenance Engr. 8. Comparison of different MCU’s 20th January 2017 Maintenance Mgr. 9. Cost benefit analysis of installing MCU 25th January 2017 Maintenance Mgr. 10. Raising capital request for MCU 30th January 2017 Maintenance Mgr. 11. Purchasing & getting supply of MCU 30th March 2017 Purchase Mgr.
12. Installation of MCU 30th April 2017 Maintenance Mgr.
13. Steam Data comparison after installations 30th November 2017 Maintenance Mgr. 14. Comparison of estimated savings and payback
with actual savings & payback
15th December 2017 G.M Engineering
2.4.1 EnPI03: Reduction in coal
consumption for Oil Heating
Objective of EnPI 03: Reduction of coal consumption from 210 kg of coal/MKCal to 200 kg of coal/MKCal of heat transfer.
Target: December, 2016
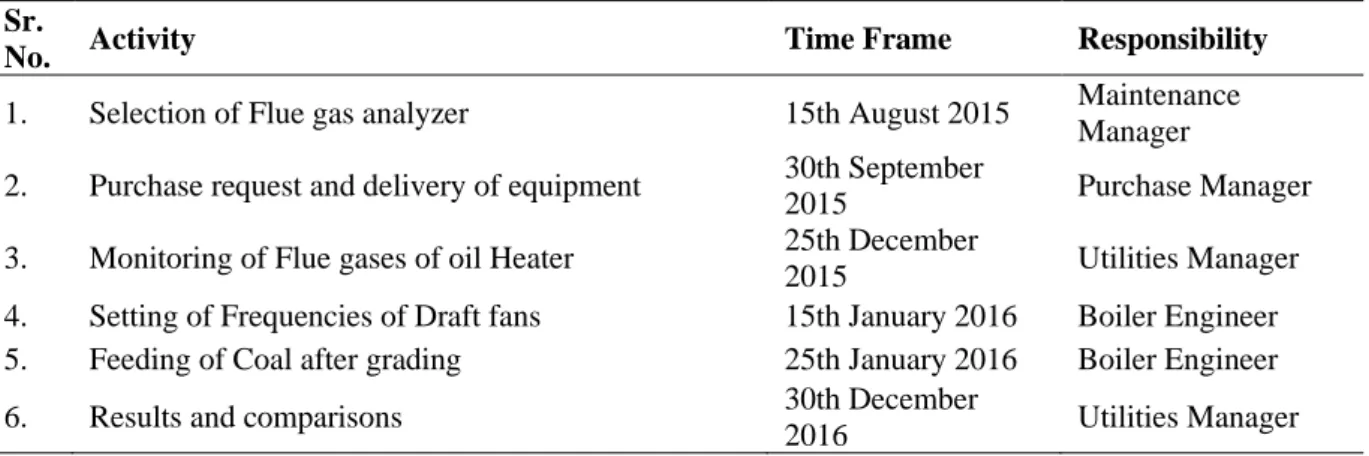
Project: During the flue gas analysis, it was observed that CO percentage is high in exhaust gases which mean unburned fuel. Upon investigation it was found that coal size should be even for proper burning and furnace doors should be kept close. Also frequencies of induced and forced draft fans were adjusted to reduce the unburned coal and hence minimizing the coal consumption for oil heating.
Action Plan for EnPI 03 is presented in table 8. The action plans to achieve the objectives were implemented and the results are presented in next section and discussed if objectives have been achieved or not.
3. Results & Discussion
EnPI 01: Table 9 presents the data collected from steam flow meters and the consumption of coal. It can be seen that the effect of action plans of EnPI 01 is visible as the efficiency of boiler has increased. Fuel consumption of boiler decreased
and efficiency increased from June-15 to June-16. SFC decreased from 145 kg of coal/ton of steam to 125 kg of coal/ton of steam and efficiency increased from 64.8 % to 75.6% which can be found in Fig 5.
Figure 5 represents the efficiency of boiler which was calculated using Eq. 1.
Fig. 5: Month wise efficiency of steam boiler
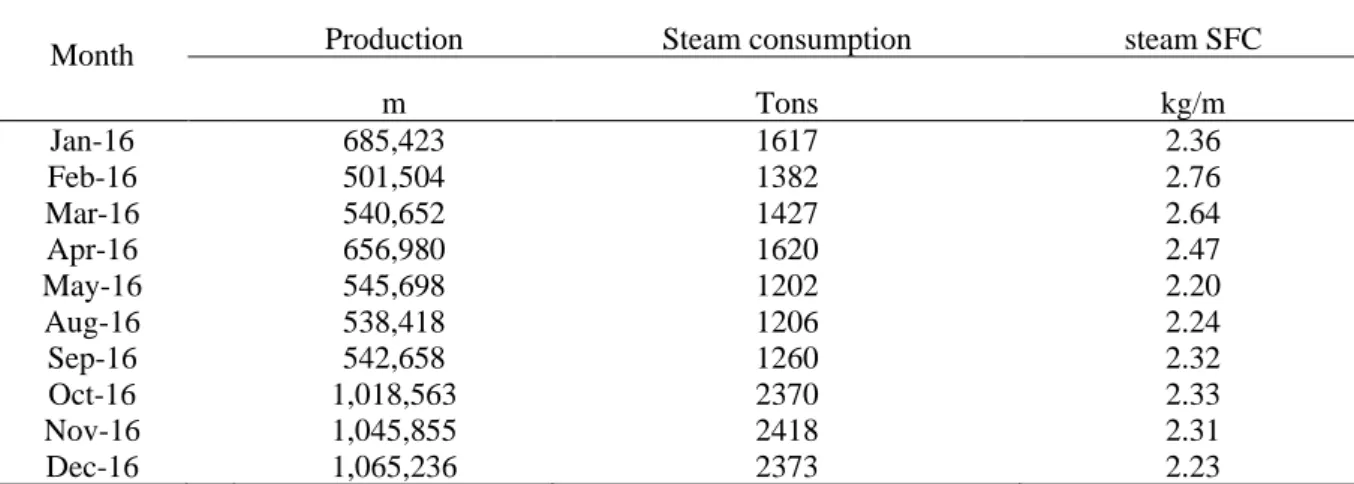
EnPI 02: Table 11 presents the data collected from steam flow meters of processing unit and fabric production of processing unit. It can be seen that the effect of action plans of EnPI 02 is visible as the steam SFC (kg/m) has decreased by an average of 10-13% after the month of April-16.
Table 8: Action Plan for EnPI 03
Sr.
No. Activity Time Frame Responsibility
1. Selection of Flue gas analyzer 15th August 2015 Maintenance Manager 2. Purchase request and delivery of equipment 30th September
2015 Purchase Manager
3. Monitoring of Flue gases of oil Heater 25th December
2015 Utilities Manager
4. Setting of Frequencies of Draft fans 15th January 2016 Boiler Engineer 5. Feeding of Coal after grading 25th January 2016 Boiler Engineer
6. Results and comparisons 30th December
2016 Utilities Manager
Table 9: Coal Consumption & Efficiency of coal boiler
Month Coal Consumption Steam Generated SFC
(kg) Tons kg of coal/ton of steam
Jun-15 340,754 2345 145
Jul-15 287,990 1967 146
Aug-15 321,930 2184 147
Sep-15 317,576 2352 135
Oct-15 328,005 2425 135
Nov-15 411,060 3055 135
Dec-15 517,820 3962 131
Jan-16 477,493 3649 131
Feb-16 396,575 3109 128
Mar-16 278,747 2191 127
Apr-16 274,423 2180 126
May-16 215,413 1718 125
Jun-16 193,820 1555 125
Table 10: Saving and payback by implementation of EnPI 01 objectives
Previous Coal Consumption
145 kg/Ton of steam Current Coal
consumption
125 kg/Ton of steam Avg. steam generated
from coal in one month
2500 Tons
Savings of Coal 50,000 kg's/Month Avg. Price coal
(imported)
15 Rs.
Total savings 750,000 Rs./Month
Implementation cost 800,000 Rs.
Pay Back Period 1.07 Months Table 10 shows the savings by implementing the two projects under EnPI 01. It can be seen that 20kg of coal were saved for every ton of steam and pay back is just one month.
EnPI 03: Table 13 presents the data collected from steam flow meters of processing unit and fabric production of processing unit. It can be seen that the effect of action plans of EnPI 02 is visible as the steam SFC (kg/meter) has decreased by an average of 10-13% after the month of April-16.
4.
Conclusion
It can be concluded from the work that implementation of ISO 50001, introduces a structure and basic framework for the
implementation of energy policy and energy management systems. It provides measureable
Table 11: Fabric Production & SFC of Steam
Month Production Steam consumption steam SFC
m Tons kg/m
Jan-16 685,423 1617 2.36
Feb-16 501,504 1382 2.76
Mar-16 540,652 1427 2.64
Apr-16 656,980 1620 2.47
May-16 545,698 1202 2.20
Aug-16 538,418 1206 2.24
Sep-16 542,658 1260 2.32
Oct-16 1,018,563 2370 2.33
Nov-16 1,045,855 2418 2.31
Dec-16 1,065,236 2373 2.23
The savings of EnPI 02 action plan is presented in table 12.
Table 12: Saving and payback by implementation of EnPI 02 objectives
Month
Steam saved steam cost Total savings
Tons Rs. Rs.
May-16 227.73 1591 362,318
Aug-16 160.5 1925 308,963
Sep-16 159 1960 311,640
Oct-16 298.64 1732 517,244
Nov-16 322.14 1919 618,187
Dec-16 417.92 1950 814,944
Total 2,933,296
Savings Avg./Month (Rs) Implementation cost (Rs) Payback period (Months)
488,914 1,300,000 2.66
Table 13: Coal consumption & efficiency of coal powered oil heater
Month
Coal Consumption Running
Hours SFC Flow Rate
Temperature
difference SFC
(kg) Hrs. (kg of
coal/ hour) m3/hr. ◦C
(kg of Coal/MkCal)
Jan-16 105,841 443 239 178 14 211
Feb-16 890,59 409 218 179 13 206
Mar-16 807,12 404 200 181 12 204
Apr-16 829,89 428 194 179 11 203
May-16 736,12 386 191 168 12 201
Jun-16 644,21 339 190 174 12 198
Jul-16 828,81 401 207 175 13 196
Sep-16 728,51 450 162 174 10 192
Oct-16 120,918 642 188 176 11 202
Nov-16 125,152 609 206 169 13 196
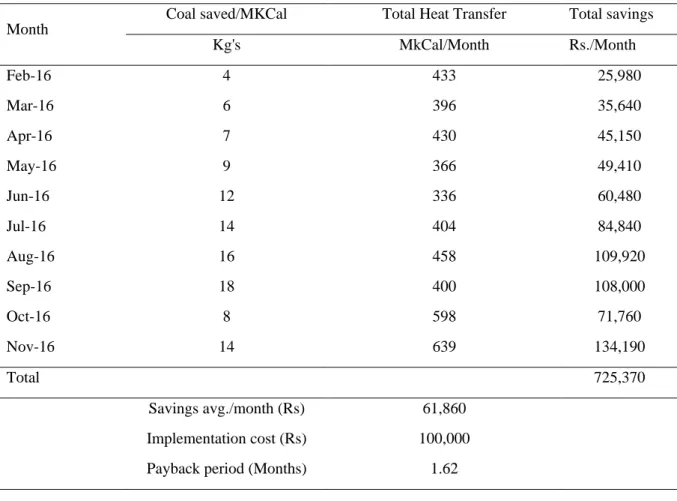
Table 14 presents the payback and savings in rupees by the implementation of EnPI 03 objectives.
Table 14: Saving and payback by implementation of EnPI 03 objectives
Month
Coal saved/MKCal Total Heat Transfer Total savings
Kg's MkCal/Month Rs./Month
Feb-16 4 433 25,980
Mar-16 6 396 35,640
Apr-16 7 430 45,150
May-16 9 366 49,410
Jun-16 12 336 60,480
Jul-16 14 404 84,840
Aug-16 16 458 109,920
Sep-16 18 400 108,000
Oct-16 8 598 71,760
Nov-16 14 639 134,190
Total 725,370
Savings avg./month (Rs) 61,860 Implementation cost (Rs) 100,000 Payback period (Months) 1.62
efficiency improvements and can also help in calculation of cost savings. The system also supports to distribute the energy system implementation plan at individual level in an organization and takes responsibilities are well defined. The implementation cost of the projects mentioned had a fairly small payback period (Under 3 months) and a total sum of Rs.13,00,000 could be saved per months which is approximately a savings of 15.6 million rupees with an investment of Rs. 2.2 Million.
5.
Acknowledgement
Authors greatly acknowledge the management of Shafi Texcel limited for the sharing of data and technological knowhow for the work.
6.
References
[1] Shahbaz, M., Chaudhary, A. R., and Ozturk,
I. (2017). Does urbanization cause increasing energy demand in Pakistan? Empirical evidence from STIRPAT model. Energy, 122, pp. 83–93.
[2] Anwar, J. (2016). Analysis of energy security, environmental emission and fuel import costs under energy import reduction targets: A case of Pakistan. Renew. Sustain. Energy Rev., 65, pp. 1065–1078.
[3] Awan, A. B., and Khan, Z. A. (2014). Recent progress in renewable energy - Remedy of energy crisis in Pakistan. Renew. Sustain. Energy Rev., 33, pp. 236–253. [4] Perwez, U., Sohail, A., Hassan, S. F., and
Zia, U. (2015). The long-term forecast of Pakistan’s electricity supply and demand: An application of long range energy alternative planning. Energy, 93, pp. 2423– 2435.
Saleem, M., and Anandarajah, G. (2017, Mar 24). Energy security and renewable energy policy analysis of Pakistan. Renew. Sustain. Energy Rev., pp. 1–14.
[6] Rafique, M. M., and Rehman, S. (2017). National energy scenario of Pakistan – Current status, future alternatives, and institutional infrastructure: An overview. Sustain. Energy Rev., 69, pp. 156–167. [7] Wakeel, M., Chen, B., and Jahangir, S.
(2016). Overview of energy portfolio in Pakistan. Energy Procedia, 88, pp. 71–75. [8] Aftab, S. S. H. W. (2015) “Energy
efficiency in Textile sector of Pakistan: Analysis of Energy consumption of Air conditioning Unit. Internation Journal of Enviornmental Science and Development, Vol. 6, No.7, pp. 498-503.
[9] International Energy Agency (IEA). (2008). Worldwide Trends in Energy Use and Efficiency Key Insights from IEA Indicator Analysis. IEA publications. [Online]. Available:
http://www.iea.org/publications/freepublica tions/publication/name,3778,en.html. [10] Aftab, S. S. H. W. (2015). Energy efficiency
in Textile sector of Pakistan: Analysis of Energy consumption of Air conditioning Unit. Internation Journal of Enviornmental Science and Development, Vol. 6, No.7, pp. 498-503.
[11] Afzal, H. M. Y. (2012). Impact of Electricity Crisis and Interest Rate on Textile Industry of Pakistan. Academy, 1(1),
pp. 32–35.
[12] Dhayaneswaran, Y., and Ashokkumar, L. (2013). A Study on Energy Conservation in Textile Industry. J. Inst. Eng. Ser. B, 94(1), pp. 53–60.
[13] Prashar, A. (2017). Adopting PDCA (Plan-Do-Check-Act) cycle for energy optimization in energy-intensive SMEs. J. Clean. Prod., 145, pp. 277–293.
[14] Antunes, P., Carreira, P., and Mira da Silva, M. (2014). Towards an energy management maturity model. Energy Policy, 73, pp. 803– 814.
[15] Dzene, I., Polikarpova, I., Zogla, L., and Rosa, M. (2015). Application of ISO 50001 for Implementation of Sustainable Energy Action Plans. Energy Procedia, 72, pp. 111–118.
[16] Laskurain, I., Heras-Saizarbitoria, I., and Casadess, M. (2015). Fostering renewable energy sources by standards for environmental and energy management-Renew. Sustain. Energy Rev., 50, pp. 1148– 1156.
[17] Tassou, S. A., Ge, Y., and Lewis, J. (2005). Fostering the Development of Technologies and Practices to Reduce the Energy Alternative and Emerging Refrigeration Technologies for Food Refrigeration Applications. Applied Thermal Engineering, Vol 30(4), pp. 263-276.