ISSN: 2252-8938, DOI: 10.11591/ijai.v9.i3.pp 402-408 402
Different mutation and crossover set of genetic programming in
an automated machine learning
Suraya Masrom1, Masurah Mohamad2, Shahirah Mohamed Hatim3, Norhayati Baharun4, Nasiroh
Omar5, Abdullah Sani Abd. Rahman6
1,2,3,4Faculty of Computer and Mathematical Sciences, Universiti Teknologi MARA, Perak Branch Tapah Campus,
Malaysia
5Faculty of Computer and Mathematical Sciences, Universiti Teknologi MARA, Shah Alam, Malaysia 6Faculty of Science and Information Technology, Universiti Teknologi PETRONAS, Perak, Malaysia
Article Info ABSTRACT
Article history: Received Feb 12, 2020 Revised Apr 17, 2020 Accepted May 10, 2020
Automated machine learning is a promising approach widely used to solve classification and prediction problems, which currently receives much attention for modification and improvement. One of the progressing works for automated machine learning improvement is the inclusion of evolutionary algorithm such as Genetic Programming. The function of Genetic Programming is to optimize the best combination of solutions from the possible pipelines of machine learning modelling, including selection of algorithms and parameters optimization of the selected algorithm. As a family of evolutionary based algorithm, the effectiveness of Genetic Programming in providing the best machine learning pipelines for a given problem or dataset is substantially depending on the algorithm parameterizations including the mutation and crossover rates. This paper presents the effect of different pairs of mutation and crossover rates on the automated machine learning performances that tested on different types of datasets. The finding can be used to support the theory that higher crossover rates used to improve the algorithm accuracy score while lower crossover rates may cause the algorithm to converge at earlier stage.
Keywords:
Automated machine learning Classification
Crossover
Genetic programming Mutation
This is an open access article under the CC BY-SA license.
Corresponding Author: Suraya Masrom,
Faculty of Computer and Mathematical Sciences,
Universiti Teknologi MARA, Perak Branch, Tapah Campus, Perak, Malaysia.
Email: [email protected]
1. INTRODUCTION
Despite the notable impact of machine learning techniques in a wide area of application domains [1-4], one major issue that emerged since the beginning of the application deployment is complexity of design [5-7]. In order to achieve state-of-the-art performance, machine learning techniques require cautious steps of data pre-processing and hyper-parameter tuning. Moreover, given with the ever-increasing number of machine learning models being developed, model selection is becoming increasingly important. With the demands from inexperienced data scientist to use machine learning models, automating the algorithm selection and optimizing the hyper-parameters tuning have been among of the preferred approaches of the data sciences community. Automated Machine Learning (AML) is the current approach proved beneficial to enexperienced data scientist and in some cases offered better performances than the conventional or manual approach [4-5].
Currently, AML has been given a wide attention by reseachers and major of works were directed to use meta-heuristics approach to optimize the machine learning pipelines [7-10]. Pipelines is a collection of machine learning models pooled from the pre-data processing to the hyper-parameters tuning. Examples of meta-heristics search algorithms in AML are Particle Swarm Optimization [11], Genetic Programming (GP) [12] and Bayesian [13-15]. Depending on the computational availability, the process to complete the minimum function of AML optimization is considerable costly. This is due to the complex proceses of machine learning algorithms that requires a model trained and performances evaluation with the set of hyper-parameters. The evaluation time will be extended when the dataset is not well constructed in such of excessive features selections or inappropriate imputation of missing values. Nevertheless, by understanding how the the hyper-parameters works in an AML, the complexities and completion time to complete might be effectively gained.
This paper presents the description of AML that used pipelines optimizations through its formal definition and conceptual explanation. Additionally, by focusing on GP based AML, the roles of some GP hyper-parameters namely mutation and crossover rates were also presented in this paper supported with the finding of empirical experiments that tested on variation sizes of dataset. To the best of our knowledge, there is very limited literature can be found on discussing and explaining detail of GP hyper-parameters in AML. Moreover, few claims were reported on the setting of the two important of control parameters (mutation and crossover) in the GP optimization of automated machine learning. The finding provides additional fundamental knowledge to the design and development of different setting of mutation and crossover rates for the AML based GP.
2. RESEARCH BACKGROUND
2.1. Formal definition of machine learning pipeline optimization in AML The formal definition of AML with search optimization is as the following:
1. The objective is to minimizes some predefined loss function ℒ(𝑋(𝑣); ℳ), where ℳ is the training model tested on the given validation dataset 𝑋(𝑣) with learning algorithm Α that learn the training dataset 𝑋(𝑡) pattern.
2. The training and validation dataset 𝑋(𝑡), 𝑋(𝑣) consists a set of features vector to be selected, pre-processed and well-constructed based on some featurization mechanisms.
3. The learning algorithm Α can be a single machine learning or a hybridization different algorithm that need to be configured with a set of hyperparameters Η[𝑗=1..𝑛] in such in the following (1).
ℳ = (Α𝑖=0(𝑋(𝑡𝑖);Η𝑖𝑗), where Α𝑖=𝑛(𝑋(𝑡𝑖);Η𝑖𝑗); Α) (1)
4. Therefore, the goal of the AML search is to find a set of hyperparameters Α∗ that yield an optimal model ℳ∗ which minimizes the ℒ(𝑋(𝑣); ℳ) function, formulated as the following (2).
Α∗= 𝑎𝑟𝑔
Α𝑚𝑖𝑛 ℒ(𝑋(𝑣); (Α𝑖=0(𝑋(𝑡𝑖); Η𝑖𝑗); Α𝑖=𝑛(𝑋(𝑡𝑖); Η𝑖𝑗)); Α) = 𝑎𝑟𝑔Αmin ℱ (Α; (Α𝑋(𝑣)𝑖=0(𝑋(𝑡𝑖
); Η
𝑖𝑗); Α𝑖=𝑛(𝑋(𝑡𝑖); Η𝑖𝑗)) , ℒ) (2)
The optimized pipeline is a set of machine learning model with the best selection of machine learning algorithm and the best optimal of hyper-parameters setting.
2.2. Genetic programming based AML
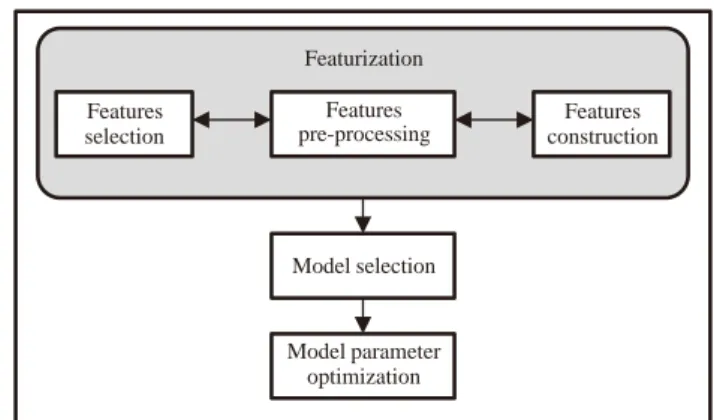
AML with GP is the interest of study reported in this paper, hence AML TPOT Python library has been used as the experimental tool [12, 16]. AML TPOT has capability to provide the best machine learning model on a training dataset from a series of processes called featurization, algorithm selection and parameter optimization as presented in Figure 1.
Featurization is the process of selecting the best possible of features from the dataset through the Principle Component Analysis (PCA) and polynomial approaches. It also incorporated with a set of imputation strategies in handling the missing values of the training dataset. The best optimized features will be passed to model selections modules that supported with various kinds of machine learning algorithms (more than fifty of classifiers and regressors). The selected algorithm or can be a hybridized model will be passed through for the best optimized parameters configurations. AML TPOT used Genetic Programming (GP) optimization approach in selecting the best model gained from the combinations of pipelines (featurization, model selections, parameters optimization) in the algorithm selection pool.
Featurization
Features selection
Features pre-processing
Features construction
Model selection
Model parameter optimization
Figure 1. AML TPOT main functions
As a family of evolutionary algorithm, the performance of GP is highly depending on the parameters configuration mainly population sizing, mutation and crossover rates. Mutation and crossover are two essential elements in an evolutionary based algorithm [17-19] like GP that can influence the search optimization landscape by means of exploitation and exploration. The optimization of best optimal result needs a balance between both exploitation and exploration [20]. Exploration can eliminate the search to converge prematurely by avoiding the solution from trapping in local optima while exploitation focuses to an intensity search direction so that the best potential solution can be converged at the global optima [21]. Mutation is highly related to the exploration aspect to control the search diversity, often be defined with a very small probability rate to produce a little modification to an individual (chromosome). On the other hand, crossover is used to identify the starting point of the best optimal solution at global optima and furtherly drives the search direction in achieving the best solution at local optima. Therefore, crossover is generally thought to enable the exploitation aspect. In simpler words, the purpose of mutation is to search locally around the promising areas found by the crossover operator.
Generally, the most appropriate mutation and crossover settings required by an evolutionary algorithm like GP to solve different optimization problems can be different [22-24]. In addition, evidences show that even for one specific optimization problem, the required best strategies for the both operators may vary during the evolutionary process [25-26].
3. RESEARCH METHOD
3.1. Experiments and parameters configuration
In this study, the experiment codes were developed with Pyhton 3.6 Jupyter Notebook platform and were implemented in the processor of Intel i7 7th Generation processor, 16 GB RAM.
The AML TPOT machine learning model has been set to employ 75:25 percent ratio between the training and cross validation for all the experiments. TPOT used cross validation for the machine learning training approach and the number of default value for the training and validation chunks is defined as 5. Therefore, for each population size p, the number of iterations for selecting the best pipelines is equivalent to 5 * p times. If the number of population size is 10, the GP iteration to finding the best pipelines is 50 times. A longer time will be required to complete if the number of iterations increased according to the population size and generation setting. Table 1 lists the parameters used in this research.
The number of iterations for the GP to set the final optimized pipelines is determined by the number of generations in such that the algorithm should work better with more generations. Nevertheless, longer time would be required to complete with bigger number of generation and 5 is the common setting used in many experiments. Population size is the number of individuals or potential pipelines that can be stored in the GP selection pool. Our previous experiments found that the default population size 10 is fit enough to the algorithm to produce best optimal result. The offspring_size by default is none so that it will be equal to the population_size. Mutation rate is a small value used to control the GP exploration search by applying random changes to some of the pipelines in the selection pool. The crossover furthermore is used to tell the GP how many pipelines to reproduced at each of the generation. The values for both must be in between 0.1 to 0.9 and not exceed 1.0. The mutation and crossover rates setting are divided into three sets of pair. First pair is MCR1 and MCR2, which the range is between 0.1 and 0.9, second pair is MCR3 and MCR 4 within 0.3 and 0.7 and lastly is moderate mutation and crossover rates (0.5,0.5). It is anticipated in this study that higher
crossover rates in MCR1 and MCR3 can help the algorithm to achieve better optimal results while lower crossover rates in MCR2 and MCR4 may affect on shortening the completion time.
Table 1. The important parameters
Parameters Configured value
generations 5
population_size 10
offspring_size none
Mutation & Crossover rates Divided into 5 groups: MCR1= MR 0.1, CR 0.9 MCR2 = MR 0.9, CR 0.1 MCR3 = MR 0.3, CR 0.7 MCR4 = MR 0.7, CR 0.3 MCR5 = MR 0.5, CR 0.5 *MCR=mutation and crossover rates, MR=mutation rate, CR=crossover rate
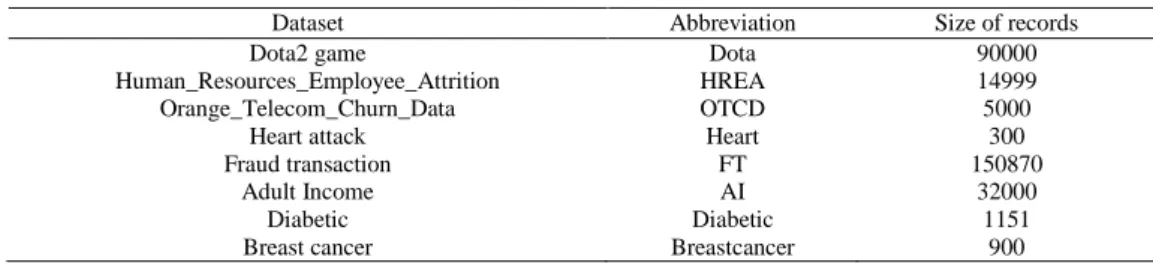
3.2. Datasets
The evaluation of this study has been conducted on a collection of 8 datasets with different sizes downloaded from Kaggle website (www.kaggle.com) as listed in the following Table 2.
Although the dataset sizes will not the major factor of machine learning performances, interesting information might be inferred when using dataset variations on testing the AML TPOT with different parameterizations of mutation and crossover.
Table 2. Datasets
Dataset Abbreviation Size of records
Dota2 game Dota 90000
Human_Resources_Employee_Attrition HREA 14999
Orange_Telecom_Churn_Data OTCD 5000
Heart attack Heart 300
Fraud transaction FT 150870
Adult Income AI 32000
Diabetic Diabetic 1151
Breast cancer Breastcancer 900
4. RESULTS AND DISCUSSION
In this section, the result of accuracy score and time to complete (TOC) of the algorithm with the five mutation and crossover rates is explained according to the data sizes : small and big. Heart, breastcancer, diabetic and OTCD were grouped as a small dataset while on the Breastcancer and OTCD datasets, the different setting of mutation and crossover rates did not present a much difference to the accuracy score. Different shapes of results can be seen on the Heart and Diabetics dataset. The highest score on Heart provided by MCR2 (0.9,0.1) while MCR5 (0.3,0.7) is the best setting on Diabetic.
4.1. Accuracy score
Figure 2 presents the results of accuracy score for the AML TPOT tested on the datasets with sizes less than 10000. The default configuration MCR1 (0.1,0.9) of the AML TPOT remain as the optimal setting for two datasets (Heart, Diabetic) but not much effect on the Breastcancer and OTCD datasets. By looking at each pair of mutation and crossover setting, there have been some performances effect to the accuracy score to the three of datasets (Heart, Breastcancer, Diabetic). Slightly improvement also can be seen on the OTCD dataset. Both higher crossover rates in MCR1 (crossover rate 0.9) and MCR3 (crossover rate 0.7) have achieved higher accuracy score compared to the lower crossover rate in MCR2 (crossover rate 0.1) and MCR4 (crossover rate 0.3). With the moderate setting of MCR5 (0.5,0.5), none of single pattern can be observed from all the datasets.
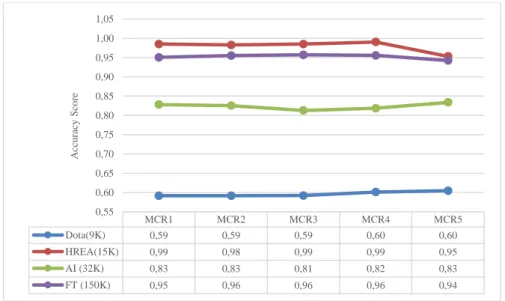
Figure 3 presents the accuracy scores of AML TPOT with different sets of mutation and crossover on the bigger size of datasets. Slightly different with the small datasets, higher crossover rates in MCR1 and MCR3 did not present a great improvement to the accuracy scores of all datasets. In fact, slightly higher accuracy score can be seen on HREA, AI and Dota with MRC4 (0.3 crossover rate). Nevertheless, with the very small improvement, the default setting of MCR1 (0.1,0.9) can be considered as the best setting for the AML TPOT.
Figure 2. Accuracy score for small size datasets
Figure 3. Accuracy score for large datasizes
Based on the results presented from the above Figure 2 and Figure 3, the general conclusion that can be made is that crossover with the exploitation aspect can be set to a higher value than mutation rates so that the search direction can go deep for better intensity in finding the best machine learning pipelines. However, for the case of big datasizes, futher empirical experiments with different factors might be essential to be conducted.
4.2. Time to complete (TTC)
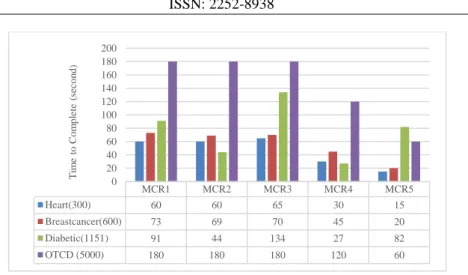
The TTCs in second that the algoritm has taken for each mutation and crossover rates are presented in Figure 4 and Figure 5. As the lower crossover rates should take smaller TTC, it is interesting to get ideas on how the different datasets may affect on the TTC. Based on the theory, MCR2 or MCR4 with lower crossover rates should able to complete faster than the MCR1 and MCR3.
As presented in Figure 4, only Breastcancer and Diabetic datasets that support the theory. MCR2 and MCR4 with lower crossover rates (0.1 and 0.3) has lower TTC than MCR1 and MCR3 (0.9 and 0.7). On the Heart and OTCD, lower crossover rate in MCR4 faced the lower TTC but found to be similar TTC values on MCR1 and MCR2. For all datasets, moderate crossover rate 0.5 is the lowest TTC. Major effect of lower crossover rates to the TTCs on all big datasets can be seen in Figure 5.
MCR1 MCR2 MCR3 MCR4 MCR5
Heart(300) 0,85 0,81 0,80 0,79 0,74
Breastcancer(600) 0,98 0,97 0,98 0,97 0,98
Diabetic(1151) 0,75 0,72 0,70 0,70 0,69
OTCD (5000) 0,96 0,96 0,95 0,95 0,95
0,65 0,70 0,75 0,80 0,85 0,90 0,95 1,00
A
cc
ur
ac
y
Sc
o
re
MCR1 MCR2 MCR3 MCR4 MCR5
Dota(9K) 0,59 0,59 0,59 0,60 0,60
HREA(15K) 0,99 0,98 0,99 0,99 0,95
AI (32K) 0,83 0,83 0,81 0,82 0,83
FT (150K) 0,95 0,96 0,96 0,96 0,94
0,55 0,60 0,65 0,70 0,75 0,80 0,85 0,90 0,95 1,00 1,05
A
cc
u
ra
cy
S
cor
Figure 4. TTC for small size datasets
Figure 5. TTC for large size datasizes
On all large size datasets, MCR2 (crossover rate 0.1) and MCR4 (crossover rate 0.3) have lower TTCs compared to MCR1 (crossover rate 0.9) and MRC3 (crossover rate 0.7). On the contrary with small datasets, the moderate setting in MCR5 did not have a pattern of effect the the TTCs.
Based on Figure 4 and Figure 5, it can be generally concluded that lower crossover rates encourage the GP optimization search to stop the process at earlier stage mainly on the big datasize.
5. CONCLUSION
This paper presents the theory, design of experiments and findings related to the effect of parameterizations of genetic programming to an automated machine learning. The genetic programming is a kind of meta-heuristics used as the search optimization of finding the best machine learning pipelines. Designing the best machine learning is a difficult endeavour and costly mainly for new data scientists. With the automated machine learning, the best setting of machine learning model can be effectively conducted. However, although with automation scheme, researchers keep on questioning the hyper-parameters setting of automated machine learning, in this case the role of crossover and mutation rates. Rather than using the default setting, it will be useful if the researhers is provided with the theory and reasonable finding for the parameterizations of AML TPOT. As for future works, it will be interesting to study more extensively on the nature of datasets, featurizations to the performances of AML TPOT and the implementation of parallel computing platform in executing the big datasets.
MCR1 MCR2 MCR3 MCR4 MCR5
Heart(300) 60 60 65 30 15
Breastcancer(600) 73 69 70 45 20
Diabetic(1151) 91 44 134 27 82
OTCD (5000) 180 180 180 120 60
0 20 40 60 80 100 120 140 160 180 200
T
im
e
to
C
om
pl
ete
(s
ec
on
d)
MCR1 MCR2 MCR3 MCR4 MCR5
Dota(9K) 3600 2400 25200 9000 18000
HREA(15K) 900 600 240 180 300
AI (32K) 1740 960 1080 270 540
FT (150K) 7200 6600 7200 5400 7200
0 5000 10000 15000 20000 25000 30000
T
im
e
to
C
om
pl
ete
(s
ec
on
ACKNOWLEDGEMENTS
The authors would like to thank Universiti Teknologi MARA and Ministry of Education Malaysia for the financial support of this project under FRGS grant No 600-IRMI/FRGS 5/3 (208/2019).
REFERENCES
[1] S. Harun and M. F. Ibrahim, “A genetic algorithm based task scheduling system for logistics service robots,” Bull. Electr. Eng. Informatics, vol. 8, no. 1, pp. 206-213, 2019.
[2] A. F. J. Al-Gburi, S. Naim, and A. N. Boraik, “Hybridization of Bat and Genetic Algorithm to Solve N-Queens Problem,” Bull. Electr. Eng. Informatics, vol. 7, no. 4, pp. 626-632, 2018.
[3] M. Moza and S. Kumar, “Routing in Networks using Genetic Algorithm,” Bull. Electr. Eng. Informatics, vol. 6, no. 1, pp. 88-98, 2017.
[4] S. Singh, M. Kaushik, A. Gupta, and A. K. Malviya, “Weather Forecasting using Machine Learning Techniques,” SSRN Electron. J., no. 6, pp. 38-41, 2019.
[5] F. R. Kamala, P. R. J. Thangaiah, and A. Info, “An improved hybrid feature selection method for huge dimensional datasets,” IAES Int. J. Artif. Intell., vol. 8, no. 1, pp. 77-86, 2019.
[6] V. S. Padala, K. Gandhi, and D. V Pushpalatha, “Machine learning : the new language for applications,” IAES Int. J. Artif. Intell., vol. 8, no. 4, pp. 411-421, 2019.
[7] A. Zakrani, M. Hain, and A. Idri, “Improving software development effort estimation using support vector regression and feature selection,” IAES Int. J. Artif. Intell., vol. 8, no. 4, pp. 399-410, 2019.
[8] R. S. Olson, N. Bartley, R. J. Urbanowicz, and J. H. Moore, “Evaluation of a tree-based pipeline optimization tool for automating data science,” in Proceedings of the Genetic and Evolutionary Computation Conference 2016, 2016, pp. 485-492.
[9] R. S. Olson, R. J. Urbanowicz, P. C. Andrews, N. A. Lavender, J. H. Moore, and others, “Automating biomedical data science through tree-based pipeline optimization,” in European Conference on the Applications of Evolutionary Computation, 2016, pp. 123-137.
[10] M. Suganuma, S. Shirakawa, and T. Nagao, “A Genetic Programming Approach to Designing Convolutional Neural Network Architectures,” in Proceedings of the Genetic and Evolutionary Computation Conference, 2017, pp. 497-504.
[11] C. Sui, M. Bennamoun, and R. Togneri, “Deep feature learning for dummies: A simple auto-encoder training method using Particle Swarm Optimisation,” Pattern Recognit. Lett., vol. 94, pp. 75-80, Jul. 2017.
[12] R. S. Olson and J. H. Moore, “TPOT: A Tree-based Pipeline Optimization Tool for Automating Machine Learning,” in Proceedings of the Workshop on Automatic Machine Learning, 2016, vol. 64, pp. 66-74.
[13] L. Kotthoff, C. Thornton, H. H. Hoos, F. Hutter, and K. Leyton-Brown, “Auto-WEKA 2.0: Automatic model selection and hyperparameter optimization in WEKA,” J. Mach. Learn. Res., vol. 18, no. 1, pp. 826-830, 2017. [14] E. Brochu, V. M. Cora, and N. De Freitas, “A tutorial on Bayesian optimization of expensive cost functions, with
application to active user modeling and hierarchical reinforcement learning,” arXiv Prepr. arXiv1012.2599, 2010. [15] M. Feurer, A. Klein, K. Eggensperger, J. Springenberg, M. Blum, and F. Hutter, “Efficient and robust automated
machine learning,” in Advances in neural information processing systems, 2015, pp. 2962-2970.
[16] P. Gijsbers, J. Vanschoren, and R. S. Olson, “Layered TPOT: Speeding up tree-based pipeline optimization,” CEUR Workshop Proc., vol. 1998, 2017.
[17] K. Kamil, K. H. Chong, H. Hashim, and S. A. Shaaya, “A multiple mitosis genetic algorithm,” IAES Int. J. Artif. Intell., vol. 8, no. 3, pp. 252-258, 2019.
[18] I. A. Humied, “Solving N-Queens Problem Using Subproblems based on Genetic Algorithm,” IAES Int. J. Artif. Intell., vol. 7, no. 3, pp. 130-137, 2018.
[19] N. K. and P. N. R., “A multiobjective genetic programming-based ensemble for simultaneous feature selection and classification,” F. Trans. Cybern., vol. 201646, no. 2, pp. 499-510, 2016.
[20] K. C. Tan, S. C. Chiam, a.a. Mamun, and C. K. Goh, “Balancing exploration and exploitation with adaptive variation for evolutionary multi-objective optimization,” Eur. J. Oper. Res., vol. 197, no. 2, pp. 701-713, Sep. 2009. [21] S. Masrom, I. Moser, J. Montgomery, S. Z. Z. Abidin, and N. Omar, “Hybridization of particle swarm optimization with adaptive genetic algorithm operators,” in 2013 International Conference on Intelligent Systems Design and Applications, 2013, pp. 1-6.
[22] S. Masrom, S. Z. Z. Abidin, N. Omar, and K. Nasir, “Time-Varying Mutation in Particle Swarm Optimization,” in Intelligent Information and Database Systems-LNCS, Springer-Verlag Berlin Heidelberg, 2013, pp. 31-40.
[23] S. Masrom, S. Z. Z. Abidin, N. Omar, A. S. A. Rahman, and Z. I. Rizman, “Dynamic parameterizations of particle swarm optimization and genetic algorithm for facility layout problem,” ARPN J. Eng. Appl. Sci., vol. 12, no. 10, 2017.
[24] N. Higashi and H. Iba, “Particle swarm optimization with Gaussian mutation,” in IEEE Swarm Intelligence Symposium- SIS ’03., 2003, pp. 72-79.
[25] S. Masrom, S. Z. Z. Abidin, N. Omar, K. Nasir, and A. S. Abd Rahman, “Dynamic Parameterization of the Particle Swarm Optimization and Genetic Algorithm Hybrids for Vehicle Routing Problem with Time Window,” Int. J. Hybrid Intell. Syst., vol. 12, no. 1, pp. 13-25, 2015.
[26] W. M. Dahalan, H. Mokhlis, R. Ahmad, A. H. A. Bakar, and I. Musirin, “Simultaneous network reconfiguration and DG sizing using evolutionary programming and genetic algorithm to minimize power losses,” Arab. J. Sci. Eng., vol. 39, no. 8, pp. 6327-6338, 2014.