Vol. 8, No. 1, March 2019, pp. 77~86
ISSN: 2252-8938, DOI: 10.11591/ijai.v8.i1.pp77-86 r 77
An improved hybrid feature selection method for huge
dimensional datasets
F.Rosita Kamala1, P.Ranjit Jeba Thangaiah2 1Department of Computer Science, Bharathiar University, India
2Department of Information Technology, Karunya Institute of Technology and Sciences, India
Article Info ABSTRACT
Article history: Received Nov 25, 2018 Revised Feb 1, 2019 Accepted Feb 22, 2019
High dimensions of data cause overfitting in machine learning models, can lead to reduction in accuracy during classification of instances. Variable selection is the most essential function in predictive analytics, that reduces the dimensionality, without losing an appropriate information by selecting a few significant features of machine learning problems. The major techniques involved in this process are filter and wrapper methodologies. While filters measure the weight of features based on the attribute weighting criterion, the wrapper approach computes the competence of the variable selection algorithms. The wrapper approach is achieved by the selection of feature subgroups by pruning the feature space in its search space. The objective of this paper is to choose the most favourable attribute subset from the novel set of features, by using the combination method that unites the merits of filters and wrappers. To achieve this objective, an Improved Hybrid Feature Selection (IHFS) method is performed to create well-organized learners. The results of this study shows that the IHFS algorithm can build competent business applications, which have got a better precision than that of the constructed which is stated by the previous hybrid variable selection algorithms. Experimentation with UCI (University of California, Irvine) repository datasets affirms that this method have got better prediction performance, more robust to input noise and outliers, balances well with the available features, when performed comparison with the present algorithms in the literature review.
Keywords: Feature selection Hybrid approach Machine learning Overfitting
Predictive analytics Variable selection
Copyright © 2019 Institute of Advanced Engineering and Science. All rights reserved. Corresponding Author:
Rosita Kamala F,
Department of Computer Science, Bharathiar University,
Coimbatore, Tamil Nadu, India. Email: [email protected]
1. INTRODUCTION
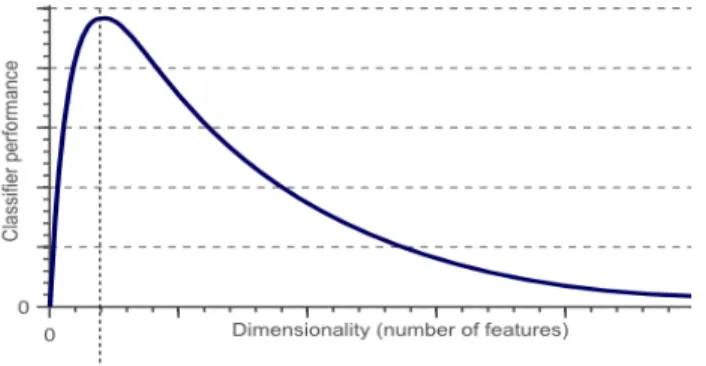
The machine learning problems use the term curse of dimensionality to refer an exponential increase of more number of dimensions of features in a mathematical space [1]. High dimensional data is found to be a major problem identified in supervised and unsupervised learning. High dimensionality often entails high variance, leading to unstable learning outcomes. To produce stable learning in statistical models of higher dimensions, a large number of samples are required. Larger volumes result high variance, causing unstable learning outcomes. Larger calculation is enforced for dealing with high-dimensional datasets. Nowadays, it is becoming a big challenge to data scientists and business analysts. The increase of features leads to various problems like noise, error and overfitting [2]. It also leads to increase in computing cost, storing cost and make data mining a challenging task in various ways. The reduction in classification performance with number of features is shown in Figure 1. The most effective way to identify relevant features in machine learning is feature selection. To achieve more accurate prediction, the concept of relevant features is used in
more stable learning models. These models are easy to understand and apply. Feature selection (FS) is a critical procedure to identify related subsets of features for making accurate prediction in large dimensional datasets [3]. The merits of variable selection are multifold and application dependent.
Figure 1. Classification performance Vs Dimensionality of features 1.1. Background
Variable selection postulates of algorithms are broadly classified into three categories to measure relevance and redundancy of features. They are filter, wrapper, and hybrid methods. Filter methods adopt a measure of statistics to allocate a count for each and every features like numerical or continuous, nominal or discrete and class label values. Based on the count, the features are ranked and either preferred to be kept or eliminated from the dataset. This is seemed to be very simple and scale as the number of samples and dimensions increase. The filters are selected as the most productive method in comparison with wrapper and embedded methods having learning independence, ease of implementation, good generalization ability and better computations [3]. The limitation of filter methods is the features are calculated one by one. It also ignores the association among features and overlooks the collaboration with the learner.
The choice of a feature subset is performed in wrapper methods as a search problem [4]. Searching refers to global and local search. Global search searches distinctive areas in the search space, and searching in the local search space is local search. A broad classification of subset examination approaches may be systematic such as a BFS(Best First Search) and a stochastic search, such as random hill climbing algorithm, branch and bound, and evolutionary methods. The kinds of greedy search strategies are heuristics. They are forward stepwise selecting option, which includes variables gradually into increasing feature subsets and backward stepwise eliminating option begins from all variables and gradually remove the minimum favourable ones [4]. Among all, greedy search methods are more advantageous collectively and strong against overfitting. But, the wrapper method interacts with a classifier. It usually evaluates the features conjointly and considers the contingency among them to select the most ideal features against the existing features set. Disadvantages of wrappers entail more expense computationally than the rest of the methods. It consumes more time, more vulnerable to cause overfitting, and more learning dependency. For this reason, hybrid methods are adopted to enhance the search algorithm. Hybrid strategies are more or less related to the wrapper strategies. Hybrid methods consider the good characteristics of more than one technique are joined to improve the significance of these techniques [5]. They learn which features contribute the best to the precision of the model, when the model is constructed. Feature subsets are enhanced by certain goodness criteria. Features are selected during training, but it is done separately in wrappers. The training data is used in a better way to evaluate subsets by not requiring a separate validation set. This method also supports fast training.
1.2. Objectives
In conceptual level, the concept learning task is divided into two subtasks: Selection of features and decision about feature combination. In this observation, the objective of this paper is outlined as below. - To build up a proposed methodology with the hybrid framework of filters and wrapper and to perform
experiments to evaluate the performance outcomes for continuous, categorical and hybrid data. - To get rid of features which are of irrelevant and redundant.
- To reduce error and to boost the accuracy of classification results - To select a subset of optimal features from the entire set.
1.3 Literature Review
The benefits of feature selection methods include good interpretability of models, take very short training computation time and reduce overfitting by improved generalization in classification models. In the most recent decades, several hybrid techniques based on Particle Swarm Optimization (PSO) have been put forward, with better outcomes. A combination method involving PSO and ACO (Ant Colony Optimization) was adopted in [6].This hybrid method overcomes the demerits of PSO, by not converting the nominal into binary and get rid of the preprocessing phase.This algorithm was modified to PSO/ACO1 for optimizing both the continuous and nominal attributes and PSO/ACO1 for managing continuous data. These methods prove better performance in generating small and simple rule sets. Nekka suggested a hybrid search method by the combination of Harmony Search Algorithm (HSA) and Stochastic Local Search (SLS) for learning problems in machine learning [7]. This wrapper algorithm uses Support Vector Machine (SVM) classifier. The experimentation outcomes vindicate that HSA-SLS is giving better results than HSA and Genetic Algorithm (GA). Abdullah Saeed Ghareb et al. proposed a hybrid methodology to improve the crossover and mutation operators of GA in consideration of the benefits of filter techniques [8]. In the next step, subsets of different sizes and importance were developed using hybrid approaches. Hybrid approaches proved an effective improvement in terms of performance and time. Afef Ben Brahim et al. suggested a filter wrapper hybrid method by selecting a few number of features in the filter phase, based on instance learning [9]. In the second phase, a cooperative subset search was used as a wrapper and classification algorithm. Experimentation with cancer datasets proved that the hybrid method outperforms the state-of-the-art algorithms.
Two hybrid FS algorithms, which are simple and efficient combine the wrapper method using a Binary Differential Evolution (BDE) algorithm by Apolloni et al [10]. Experimentations with microarray datasets lessen the quantity of the chosen features effectively, resulting a better accurate classifiers than in the majority occasions and robustness. Ezgi et al. suggested a hybrid method by combining artificial bee colony optimization method with different evolution algorithms for classification task in feature selection [11]. This study reveals that the hybrid method enhances the classification results and run time. A two step strategy is well-liked in feature selection on large dimensions of data, by employing filters to minimize the dimensions of features. A further two-phase in which Gain Ratio was adopted as a filter to choose the best scored dimensions and combined with backward elimination algorithm prior to executing PSO by Rosita et al. Outcomes vindicate that this method produced a better capability for the numerical datasets but not for nominal and microarray datasets with more execution time [12]. Huijuan Lu et al. suggested a hybridized FS algorithm using mutual information maximization and adaptive genetic algorithm combination for gene data to enhance the MIMAGA algorithm by employing four classifiers. Experimentation vindicates that the accuracy rates for all datasets proved to be higher than 80%, when demonstrated the robustness of the algorithm [13]. Mohamed et al. adopted a Hybrid Binary Bat Enhanced Particle Swarm Optimization Algorithm with bat algorithm and enhanced PSO for performance improvements in UCI datasets [14]. To enhance the k-Nearest Neighbour classifier(kNN), PSO is updated with the novel fitness function [15-16]. The outcomes have proved higher accuracy of very small feature subsets.
Literature study reveals that different hybrid methods have been proposed not only to solve feature selection issues but also to resolve optimization problems. Consequently, this paper proposes a methodology of the hybrid framework by combining the merits of filter and wrapper methods for FS problems in machine learning. In this paper, the filters chi square, F-statistic, and mutual information, and wrapper PSO are evaluated. The proposed methodology proves better outcomes against state of the art of the field mentioned in the literature survey using UCI and microarray datasets. The results obtained prove that the method IHFS is found to be the best regarding accuracy, and computation time when compared with the variety of methods in the existing literature. However, if its accuracy of classifiers is improved with the run time, it is considered as the top best and resulting better improvements for bigger dimensions. The organization of this paper is as follows. The detailed representation of the proposed hybrid framework is outlined in section 2. The experimentation outcomes of the proposed method and the comparative study with the relevant works are outlined in section 3. In the last part, the concluding observations and the information for future scope are presented in section 4.
2. METHOD AND MATERIALS
2.1. Methods of The Proposed Work
In this paper, a hybrid method is formulated from Chi square, F-Statistic, mutual information, and PSO algorithms to find solutions for FS problems in machine learning tasks.
2.1.1. Chi-Square Test(CHI)
CHI computes, how the observed frequency data values fits well with the expected frequency data values of independent variables. So, it is named a "goodness of fit" test [17]. The chi square attribute weight operator measures the attributes weight regarding the label attribute by means of the chi square statistic. If the attribute weight is higher, the attributes are considered more relevant. Normally, the CHI sum up the squares of the discrepancies between the expected occurrence and the observed occurrence, to the expected frequency of outcomes [18]. The CHI test is a nonparametric stochastic procedure. There are some advantages of nonparametric techniques. It is fairly easy to compute. It measures data on the basis of classification.
The CHI test can only be applied for labels of categorical variables. Hence, this study has taken CHI to achieve better results.
2.1.2. F -Statistic
F Statistic is a test in statistics in that under the null hypothesis, the test data have F distribution. One can measure it, if the dimension is numeric [19]. However, the class having one of C distinct nominal values is mentioned below.
𝐹 𝑖 ≔ &'()$% *' , -* , 2/ /-0)
(*3, -*' 3∈5' &
'() ,))6/ 7-/)
(1)
Where Pc - the sample indices partition {1,2,3,....n}, belonging to the partition indexed by c, and
𝑧% 𝑖 ∶= $%0 ;∈$%𝑧; 𝑖
.
This formula corresponds to the fraction of the variation amid clusters and the mean variance inside the clusters. Larger relevance implies high valued.2.1.3. Mutual Information(MI)
MI computes the frequent information amid any two features that are arbitrary in nature, if both the dimension and the class have nominal values [20]. Larger values show superior significance. A dimension set D = {d1, d2,...dn} of an example set of n dimensions, the dimension reduction process establishes a subset P
with k dimensions, where k ≤ n and P⊆D. Therefore, P the subset should yield equal or superior accuracy of classifiers when compared to the original dimension set. Specifically, the dimension reduction defines the subset of dimensions that improves MI with an output class C is MI (P, C) [3].
MI(X, Y) = H(Y) – H(Y|X) (2)
where entropy H( ), X and Y are random variables [21].
Definition 1. Dimension significance: Dimension di is more significant to the output class C then,
dimension dj in the perspective of the chosen subset P when,
MI (di, P;C) > MI (dj, P;C).
(3)
2.1.4. PSO
The wrapper PSO is selected on account of a number of merits outlined as below. - PSO is an evolutionary method based on population.
- Unlike many conventional techniques, it is an algorithm with fewer derivations and a low computation time.
- It is flexible to integrate with additional optimization techniques to formulate hybrid methods.
In 1995, James Kennedy and Russell Eberhart developed PSO, after being enthused by the biologist Frank Heppner's study of the bird flocking behaviour [22]. PSO is a methodology to discover solutions to problems and specified as a locus in a solution space of n dimensions. A cluster of arbitrary specks (solutions) initializes PSO search for optimum values, by modifying propagations. A large number of particles are chosen into action through this space randomly. They examine the "fitness" of these particles and their neighbours in each iteration to "emulate" thriving neighbours by advancing towards them [12]. There are different methods to group particles into challenging semi-independent flocks or a single global flock, including all the particles that belong. This seems to be very effective across the different problem domains.
2.2. The Proposed IHFS Algorithm.
The powers of filters and wrappers are combined in the improved hybrid Feature Selection algorithm [5-14]. A novel framework, named the Improved Hybrid Feature Selection (IHFS) Method is developed. The proposed IHFS algorithm's pseudocode is summarized in Figure 2. Lines 1-22 account for the phase-1 of IHFS. In the first phase, the two filter methods are selected as the initial partition, to eliminate the most unneeded or extraneous features. Chi square(CHI), F -Statistic(FStat), and Mutual Information (MI) are the central part of initial selection. These weighting functions are selected, based on the types of data attributes like numerical or continuous, nominal or discrete and class label values like FStat for numeric dimensions and MI for nominal dimensions. The methods outlined above, evaluate the importance of the features by evaluating for every feature of the dataset, the importance of the filter method with reference to the class label. The weights of features which contented the precise condition with reference to the weights of input features are selected for the datasets. The first selection fhigh is done by CHI. The second selection f1 or
f2 is done by either FStat or MI. From all existing features, these features are measured as the most relevant
label associated features. To arrive at better results, the framework is to successfully conjoin the two variable subsets, which eliminates the frequent features of both the sets. Thus variable selection is achieved to lessen the dimension of features. The two resultant feature subsets of the first phase have undergone a combination model to remove unrelated features and overfitting for the finetuned preprocessed feature subset. A merge procedure, for example the union is opted. As an outcome, the number of features are eliminated to an appreciable manner. Thus, the preliminary preprocessing step is performed for UCI and microarray repository datasets. By combining the resultant preprocessed feature subsets is not an excellent choice as the removal of redundancy will lead to an improvement of accuracy.
Input: Set of features F ={fi, i = 1...n} C:Class labels.
Output: S Selected features 1.S ←{}
2.For each fi in F
3.Weight(fi) = Find Chi(fi,C) 4.End for
5.Sort weight in accordance with weight. 6.fhigh = Choose features with more weight. 7.Append fhigh to S. (S←S ∪ {fhigh}) 8. if F isNumeric
9. For each fi in F
10. Weight(fi) = Find FStat(fi,C) using Eqn(1). 11. End for
12. Sort weight in accordance with weight. 13. f1 = Choose features with more weight. 14. Append f1 to S. (S←S ∪ {f1}) 15. else if F isNominal
16. For each fi in F
17. Weight(fi) = Find MI(fi, C) using Eqn 2. 18. End for
19. Sort weight in accordance with weight. 20. f2 = Choose features with more weight. 21. Append f2 to S. (S←S ∪{f2})
22. End if
23. Divide S into datasets for training and testing. Swarm initialized.
24. Specify the maximum iterations Imax
25. For the feature set S generate particles P their positions Pos(m, n) and velocity Vel(m, n) 26.Compute the maximum impedance peak max_imped(m) corresponding to m particles. 27. Describe the best local particle l_best and find the best global particle g_best.
28.While ( t ≤ Imax )
29. For each particle m = 1 : P
30. Update inertia weight ω, velocity, position. 31. ω = (ωm - ωf) Imax -1/ Imax
// ω to manage the influence of the preceding velocities on the present velocity.
32. Vel(m, n) = ω(t) Vel(m, n)+C1r1(l_best(m, n) -Pos(m, n)+C2r2(g_best) - Pos(m, n)
C1 -cognizance factor for learning, C2 -Social factor for learning, r1, r2 - Uniformly generated random numbers in the range[0, 1].
33. Pos(m, n) = Pos(m, n)+Vel(m, n)
34. Within the lower and upper bounds limit the positions and velocity
35. End for
36. Update l_best(m, n) and g_best(m, n) accordingly. 37. t ←t +1
38. End while
39. Return the best particle as solution.
40. Cross Validation(CV) for the number of nearest neighbors kmin and kmax
41. Training set having CV with values 1,2,3,...V. 42. For each k ∈ [kmin, kmax]
43. Computation of average error rate V
CVk = ∑ ev /V v=1
44. ev - error rate, Optimal k = arg {min CVk: kmin ≤ k ≤ kmax}
45. Classification results prediction performance for S as final selected subset of features.
Figure 2. The pseudocode of the proposed IHFS algorithm
iteration. The particle swarm optimizer traces the subsequent the best result attained until now by a few elements in the population are referred gbest, globally best. Whenever specks participate as topological neighbours in the population, the finest result is called lbest, locally best. The optimal search using PSO with improvement in Velocity Vel(m, n) and the search space Pos(m, n) of every particle is given in lines 32-33. Finally, Lines 40-45 correspond to the consequential feature set is applied by adopting 10 fold Cross Validation(CV) and stratified sampling to advance the classifiers accuracy. This is the excellent tuning step to yield the finest feature set. IHFS is very efficient in eliminating the irrelevant and useless features. Because, the majority of the insignificant features are ruled out, subsequent to the first step of the filter method. It also eliminates the exponential calculation problem of wrapper approach in the subsequent step. The experimental results recommend that the IHFS works well on an extensive range of problems.
2.3. k-Nearest Neighbour Classification (k-NN)
One of the most common nonparametric methods is the k-NN[15]. The one and only parameter, k is the quantity of nearby neighbours, can be determined and implemented easily. The key performance of the classification process is the number of nearby neighbours. k-NN calculates the minimum distance called Euclidean distance, is a new entity of test samples from the training samples [16]. To enhance the learning performance, the variable k must be modified in accordance with the various datasets distinctiveness. To classify n samples, they are subdivided into one test instance and n-1 training instances in every iterative process of evaluation.
The subsequent steps are required to perform k-NN.
- Selecting k: After some iterations, k value is ascertained by the finest result. - Calculating Displacement: Euclidean distance method is adopted.
- Sorting distance in ascending order: The minimum k distances are found by the distance sorted in ascending order.
3. RESULTS AND ANALYSIS
To assess the proposed methodology, an analysis is performed pragmatically. To accomplish analysis, an operational version of the proposed algorithm was executed in Java, with the RapidMiner technology. In turn to reach the best evaluation of the fitness function, a 10 fold stratified CV method is followed in all classifiers.
3.1. Datasets and Parameter Setting
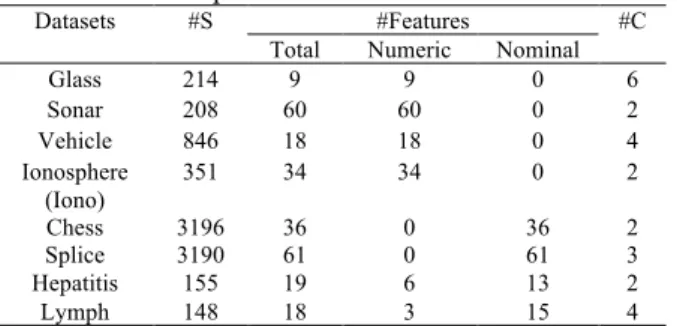
In this study, eight datasets are used from UCI repository [23] to confirm the success, and efficiency of the algorithms is described in Table 1. The experiments are accomplished on datasets with more than 30 features. The algorithm IHFS is also experimented with six well-known microarray datasets [24] summarized briefly in Table 2.
Table 1. Experimental dataset information. Datasets #S #Features #C
Total Numeric Nominal Glass 214 9 9 0 6 Sonar 208 60 60 0 2 Vehicle 846 18 18 0 4 Ionosphere
(Iono)
351 34 34 0 2 Chess 3196 36 0 36 2 Splice 3190 61 0 61 3 Hepatitis 155 19 6 13 2 Lymph 148 18 3 15 4 #S (No. of Samples) #C (No. of Classes)
Table 2. High dimensional microarray datasets. Datasets #Genes #S #C Ovarian Cancer
(Ovarian) 15154 253 2 MLL 12582 72 3 Leukemia2C
(Leuk-2C) 7129 72 2 Lung Cancer
(Lung) 12533 181 2 CNS 7129 60 2 (Leuk-4C) 7129 72 4 #S (No. of Samples) #C (No. of Classes)
The setting of parameters for PSO is as follows. Population size is 100. Upper limit number of generations is 30. The parameters like inertia weight, local best weight and global best weight are set to 1.0. Dynamic inertia weight is true so that the inertia weight is enhanced during execution.To evaluate the learning model, experiments are conducted on all instances with 10 - fold CV and adopted a k-NN technique to achieve a better performance. In kNN classifier, measure type is the 'Mixed Measure' and mixed measure is the 'Mixed Euclidean Distance'.
3.2. Performance Analysis
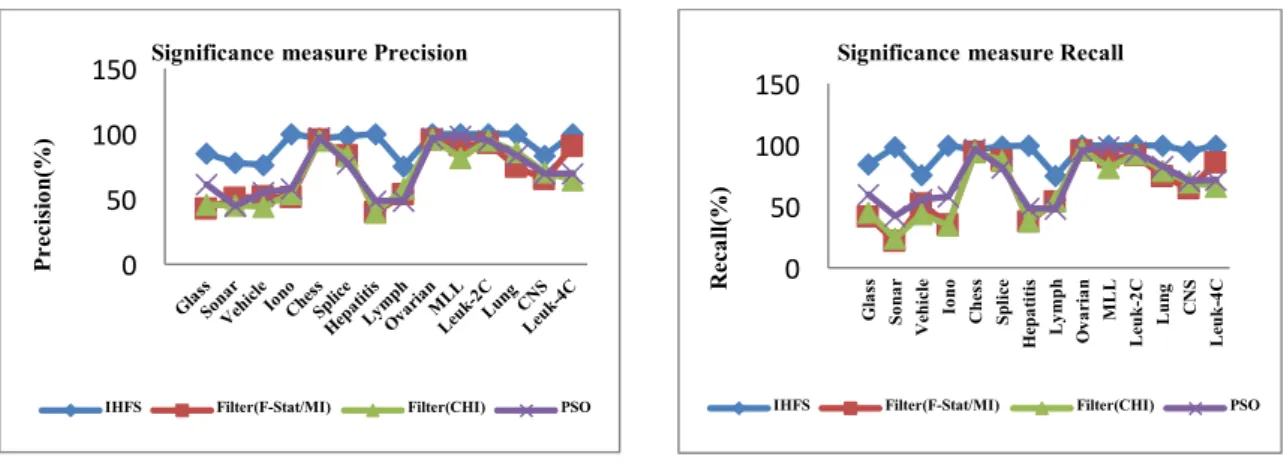
The CV maintains an apparent amount of data for testing and use the rest for training. The n fold CV classifies the sample data to n roughly equal divisions, one is used for testing, and the rest for training. Thus, the CV brings all instances to participate both in training and testing models. Classification performance is best interpreted by an appropriately named tool called the confusion matrix [25]. The classifier accuracy can be viewed in one of four possible ways. They are TP (True_Positive), FP (False_Positive), FN (False_Negative) and TN (True_Negative). The accuracy of the proposed IHFS algorithm is compared with the traditional methods of feature selection in Figure 3. The results of fitness functions Precision(Pr), and Recall(Rc) of the IHFS with different combinations are shown in Figure 4. Specificity is TN/(TN+FP). Precision is TP / (TP + FP). Recall is also given by TP / (TP + FN). Accuracy = [TP + TN]/[TP + FP + TN + FN]. The result of this study in Figure 3 depicts the most significant outcomes of the proposed algorithm. In almost all datasets the accuracy of the proposed study shows an enormous improvement than the traditional filter methods CHI, FStat, MI, and wrapper PSO. Depend on the outcomes obtained in Figure 4, the prospective method IHFS is found to be the best in terms of precision and recall in comparison with the different traditional methods in the literature like CHI, FStat, MI, and wrapper PSO and yields a massive improvement.
Figure 3. Accuracy Comparison of the framework IHFS with filters and wrappers.
Figure 4. Comparative study of Precision, and Recall of the IHFS with traditional existing methods. 3.3. Analysis of Performance Measure As Kappa
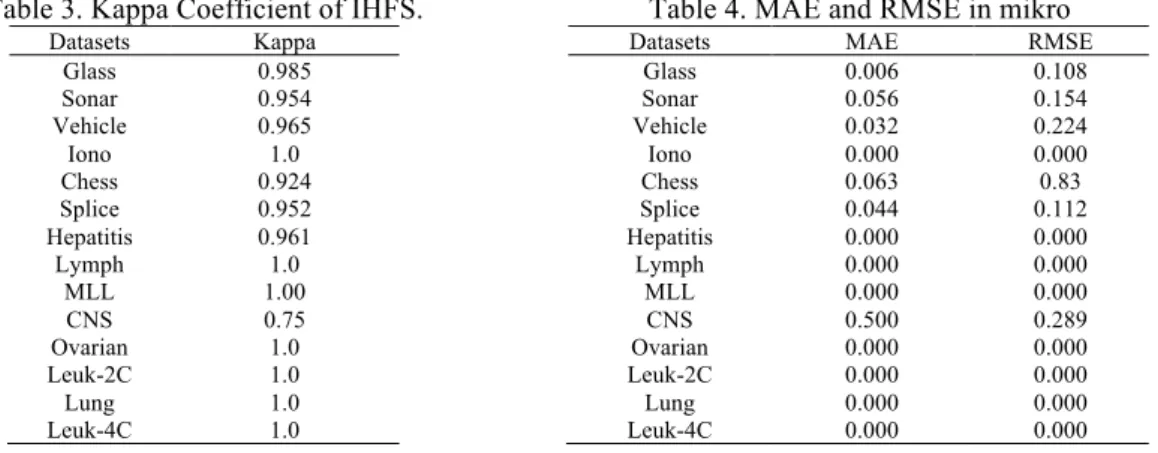
Cohens Kappa statistic is statistically strong [26]. It is considered as one of the evaluation measures in classification performance. It is supportive and acceptable to test, as an evaluation measure of the variable selection methods. Thus, the Kappa coefficient is beneficial, and it uses a smaller number of attributes. The proposed IHFS perfectly agrees with the above-mentioned Kappa interpretation is represented in Table 3. Kappa as an efficiency measure, enhances the strength of the feature selection strategies. This is because Kappa punishes randomness and not performance. The noisy features that do not affect the correct learning rate, but impact Kappa. Therefore, Kappa is the most appropriate measure, which selects the subsets
0 50 100 150
P
re
ci
si
on
(%)
Significance measure Precision
IHFS Filter(F-Stat/MI) Filter(CHI) PSO
0 50 100 150
Gl
as
s
So
na
r
Ve
h
ic
le
Io
n
o
Ch
es
s
Spl
ic
e
He
p
at
it
is
Ly
m
p
h
Ov
ar
ia
n
ML
L
Le
u
k
-2C
Lu
n
g
CNS
Le
u
k
-4C
R
ec
al
l(
%)
Significance measure Recall
of smaller size and does not include the noisy features. A Kappa of a limit from 0.81 to 0.99 entails almost an ideal agreement. Ideal agreement would equate to a Kappa of one.
3.4. MAE (Mean Absolute Error) and RMSE (Root Mean Squared Error) analysis
The two error measures MAE and RMSE estimate the accuracy prediction [27]. MAE is defined as the mean of the difference of two points like actual and fitted points. It can take values from zero to infinity. The ideal fit is prevailed if MAE is zero. RMSE is a measure of error in absolute value. It calculates the difference square of positive and negative deviations to cancel one another out. The least value of RMSE implies a model of good significance. Table 4 depicts the MAE and RMSE outcomes.
3.5. Comparative Analysis of The Proposed Work To State-of-The-Art Feature Selection Methods In summary, the outcomes in Table 5 and Table 6 well validate the efficiency of IHFS in terms of accuracy and CPU time respectively for UCI and large-scale microarray datasets.The datasets' accurateness achieved by this framework is compared in Table 5 with the results directly taken from each of the algorithms of the most relevant works in the recent literature. In glass, sonar, vehicle, and ionosphere datasets (numerical), the proposed IHFS outperforms the relevant study of [28, 21, 33, 12] by obtaining the most competitive results in terms of accuracy and CPU time. In chess dataset both the accuracy and run time are not superior over the results obtained in [21]. Even though the FSSMC methods in [31] giving significant computation time for splice dataset, the proposed IHFS outperforms the accuracy of the FSSMC methods with C4.5, and NB classifiers. The accuracy of IHFS also outperforms the ensemble classifier RCRF method used in [34] for splice dataset.
Table 3. Kappa Coefficient of IHFS. Datasets Kappa
Glass 0.985 Sonar 0.954 Vehicle 0.965 Iono 1.0 Chess 0.924 Splice 0.952 Hepatitis 0.961 Lymph 1.0
MLL 1.00 CNS 0.75 Ovarian 1.0 Leuk-2C 1.0 Lung 1.0 Leuk-4C 1.0
Table 4. MAE and RMSE in mikro Datasets MAE RMSE
Glass 0.006 0.108 Sonar 0.056 0.154 Vehicle 0.032 0.224 Iono 0.000 0.000 Chess 0.063 0.83 Splice 0.044 0.112 Hepatitis 0.000 0.000 Lymph 0.000 0.000 MLL 0.000 0.000 CNS 0.500 0.289 Ovarian 0.000 0.000 Leuk-2C 0.000 0.000 Lung 0.000 0.000 Leuk-4C 0.000 0.000
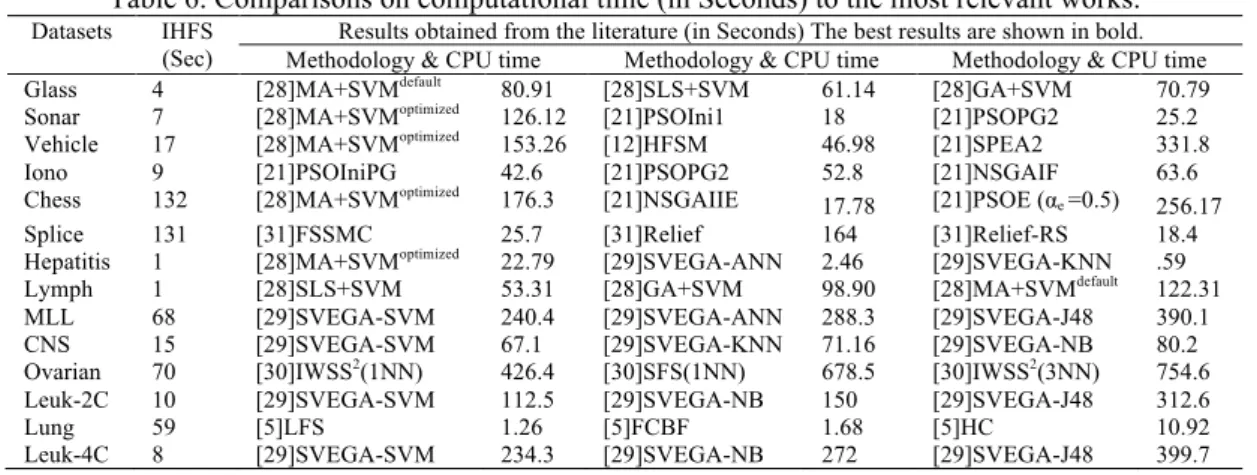
Even though the methods used in [28-29] could give better accuracy for hepatitis dataset, there is no significance in computation time. But the proposed IHFS gives significant results in terms of both accuracy and run time for hepatitis dataset. In lymph, Leukemia 2C and MLL datasets even though the existing methods in [29] could give similar results for accuracy but could not give better results in terms of CPU time and the proposed IHFS is superior in terms of run time for these datasets. In Ovarian cancer dataset even though the existing methods used in [30] and [10] could give competitive results for accuracy but could not give better results in terms of CPU time. In CNS dataset the accuracy is not significant than existing methods of [32] but the IHFS method shows significant improvement in computing time over the methods in [29]. Though the methods used in [5] could give better run time for lung dataset, there is no significance in accuracy. But the proposed IHFS gives significant results for lung dataset in terms of both accuracy and run time. In Leukemia 4C microarray datasets the proposed IHFS outperforms the relevant study in [29] by obtaining the best competitive results in terms of accuracy and CPU time.
As shown from Table 5 that, out of 14 datasets the proposed method shows significantly better on twelve datasets and worse on two datasets in terms of accuracy. In terms of computing time, the proposed method has ten significantly better results, two worse results (categorical) and no significant difference on two results (lung and Hepatitis). The success of IHFS could be attributable to its ability to identify strongly relevant features. These features increase the likelihood to ascertain an optimal feature subset. Even though the accuracies of the performance of the classifier for microarray datasets are very competitive in Table 5, the strength of the IHFS algorithm can be vindicated in Table 6 by the rapid computation time of the microarray datasets than the state-of-the-art works in the recent study, proves the improved performance of the framework IHFS. Overall, the IHFS had the best performance.
Table 5. Comparative analysis of the framework IHFS to the most appropriate works. Datasets IHFS
%
Results obtained from the literature (The most excellent results are shown in bold) Methodology & Accuracy Methodology & Accuracy Methodology & Accuracy Glass 98.84 [28]MA+SVMoptimized 85.98 [33]IEM 85.56 [28]MA+SVMdefault 76.63
Sonar 97.62 [28]MA+SVMoptimized 97.11 [12]HFSM 97.13 [21]PSOPG3 87.3
Vehicle 94.99 [21]PSOIni2 87.99 [21]PSOIni3 87.8 [28] MA+SVMoptimized 83.33
Iono 100 [28]MA+SVMoptimized 96.74 [21]PSOPG2 95.24 [21]PSOIni2 94.29
Chess 96.64 [21]PSOE-DT 99.44 [33]BPNN 99.28 [21]PSOMI-KNN 95.62 Splice 98.75 [34]RCRF 96.48 [31]FSSMC+C4.5 88.4 [31]FSSMC+NB 95.6 Hepatitis 100 [28] MA+SVMoptimized 100 [29]SVEGA-ANN 99.81 [29]SVEGA-KNN 88.45
Lymph 100 [29]SVEGA-ANN 100 [29] SVEGA-SVM 87.32 [29]SVEGA-KNN 91.56 MLL 100 [29]SVEGA-KNN 100 [29]SVEGA-NB 100 [29]SVEGA-SVM 98.61 CNS 91.67 [32]MF+GA+TS 99.33 [29] SVEGA-SVM 93.35 [29]SVEGA-ANN 95 Ovarian 100 [10]BDE-SVMRank 100 [30] IWSS3(1NN) 100 [30] IWSS3(3NN) 99.2
Leuk-2C 100 [29]SVEGA-NB 100 [32]MF+GA+TS 99.50 [29]SVEGA-SVM 97.2 Lung 100 [32]MF+GA+TS 99.17 [10]BDE-SVM 98.7 [10]BDE-KNNRank 98.7
Leuk-4C 100 [29] SVEGA-NB 97.22 [29]SVEGA-SVM 98.86 [29]SVEGA-ANN 98.61
Table 6. Comparisons on computational time (in Seconds) to the most relevant works. Datasets IHFS
(Sec)
Results obtained from the literature (in Seconds) The best results are shown in bold. Methodology & CPU time Methodology & CPU time Methodology & CPU time Glass 4 [28]MA+SVMdefault 80.91 [28]SLS+SVM 61.14 [28]GA+SVM 70.79
Sonar 7 [28]MA+SVMoptimized 126.12 [21]PSOIni1 18 [21]PSOPG2 25.2
Vehicle 17 [28]MA+SVMoptimized 153.26 [12]HFSM 46.98 [21]SPEA2 331.8
Iono 9 [21]PSOIniPG 42.6 [21]PSOPG2 52.8 [21]NSGAIF 63.6 Chess 132 [28]MA+SVMoptimized 176.3 [21]NSGAIIE
17.78 [21]PSOE (αe =0.5) 256.17
Splice 131 [31]FSSMC 25.7 [31]Relief 164 [31]Relief-RS 18.4 Hepatitis 1 [28]MA+SVMoptimized 22.79 [29]SVEGA-ANN 2.46 [29]SVEGA-KNN .59
Lymph 1 [28]SLS+SVM 53.31 [28]GA+SVM 98.90 [28]MA+SVMdefault 122.31
MLL 68 [29]SVEGA-SVM 240.4 [29]SVEGA-ANN 288.3 [29]SVEGA-J48 390.1 CNS 15 [29]SVEGA-SVM 67.1 [29]SVEGA-KNN 71.16 [29]SVEGA-NB 80.2 Ovarian 70 [30]IWSS2(1NN) 426.4 [30]SFS(1NN) 678.5 [30]IWSS2(3NN) 754.6
Leuk-2C 10 [29]SVEGA-SVM 112.5 [29]SVEGA-NB 150 [29]SVEGA-J48 312.6 Lung 59 [5]LFS 1.26 [5]FCBF 1.68 [5]HC 10.92 Leuk-4C 8 [29]SVEGA-SVM 234.3 [29]SVEGA-NB 272 [29]SVEGA-J48 399.7
4. CONCLUSION
The IHFS is explored in view of the advantages of both feature selection methods like filters and wrappers respectively. A drastic experimental study was conducted with datasets of UCI and microarray repository with more features. The performed outcomes are compared to measure the effectiveness of the proposed IHFS algorithm. The competence of the IHFS determines the best possible feature subsets with utmost efficiency, in comparison with other diverse up-to-date FS methodologies of the proven research findings with similar datasets. In view of this study, the IHFS has improved the classifier accuracy and computational time. The study findings are very noteworthy and have obtained a highly competitive methodology in feature selection problems, implying a better performance. For future studies, this framework can also be progressed to different types of dimension subsets of images, text and medical datasets. IHFS can also be customized to make hybridization with other PSO techniques.
REFERENCES
[1] Richard Ernest Bellman, "Dynamic Programming," Courier Dover Publications, 2003.
[2] B.S. Everitt, and A.Skrondal,"Cambridge Dictionary of Statistics,"Cambridge University Press, 2010.
[3] A.Guyon, and Elisseeff, "An introduction to variable and features selection," J. of Mach. Learn. Res., vol.3, pp.1157–1182, 2003.
[4] R.Kohavi, and GH.John, "Wrappers for feature subset selection," Artif. Intell., vol. 97(1-2), pp. 273–324, 1997. [5] Pablo Bermejo, Jose A Gamez, and Jose M Puerta, "A GRASP algorithm for fast hybrid (filter-wrapper) feature
subset selection in high-dimensional datasets," Pattern Recogn. Lett., vol. 32, pp. 701–711, 2011.
[6] N. Holden, and A. Freitas, "A Hybrid PSO/ACO algorithm for discovering classification rules in data mining," Hindawi Publishing Corporation Journal of Artificial Evolution and Applications Vol. 2008, Article ID 316145, 11 pages, 2008.
[7] M. Nekkaa and D. Boughaci, "Hybrid harmoy search combined with stochastic local search for feature selection," Neural Processing Letters, pp.1-22, 2015.
[8] Abdullah Saeed Ghareb, Azuraliza Abu Bakar, Abdul Razak Hamdan, "Hybrid feature selection based on enhanced genetic algorithm for text categorization," Expert Systems with Applications, vol. 49, pp. 31-47, 2016.
[9] Afef Ben Brahim, Mohamed Limam. "A hybrid feature selection method based on instance learning and cooperative subset search," Pattern Recognition Letters, vol. 69, pp. 28-34, 2016.
[10] Apolloni, Guillermo Leguizamón, and Enrique Alba, "Two hybrid wrapper-filter feature selection algorithms applied to high-dimensional microarray experiments," Appl. Soft. Comput., vol. 38, pp. 922–932, 2016.
[11] Ezgi Zorarpacı, and Selma Ayse Ozel, "A hybrid approach of differential evolution and artificial bee colony for feature selection," Expert Systems With Applications, vol.62, pp. 91-103, 2016.
[12] F. Rosita Kamala, and Dr. Ranjit Jeba Thangaiah P, "A proposed two phase hybrid feature selection method using backward Elimination and PSO," Int. J. of Appl. Eng. Res, vol. 11(1), pp. 77 - 83, 2016.
[13] Huijuan Lu, Junying Chen, Ke Yan, Qun Jin, and Zhigang Gao, "A hybrid feature selection algorithm for gene expression data classification," Neurocomputing, vol. 256, pp. 56-62, 2017.
[14] Mohamed A. Tawhid, and Kevin B. Dsouza, "Hybrid Binary Bat Enhanced Particle Swarm Optimization Algorithm for solving feature selection problems" Applied Computing and Informatics (Article in Press) Open Access, April 2018.
[15] Debojit Boro, Dhruba K. Bhattacharyya, “Particle Swarm Optimization based KNN for improving KNN and ensemble classification performance," International journal of innovative computing and applications(IJICA), vol. 6(3/4), pp.145-162, 2015.
[16] M. Jabbar "A Prediction of heart disease using k nearest neighbor and particle swarm optimisation," Biomedical Research, vol. 28(9), pp. 4154-4158, 2017.
[17] P. E. Greenwood, and M. S. Nikulin, "A guide to chi-squared testing," John Wiley & Sons, New York, 1996. [18] H. O. Lancaster, "The chi-squared distribution," John Wiley & Sons, New York, 1969.
[19] Paul J. Lavrakas, "Encyclopedia of Survey Research Methods," SAGE Publications, 2008.
[20] Christopher D. Manning, Prabhakar Raghavan, Hinrich Schutze,"An Introduction to Information
Retrieval,"Cambridge University Press, 2008.
[21] Bing Xue, "Particle Swarm Optimisation for Feature Selection in Classification," Ph.D Thesis, Victoria University of Wellington, Wellington, 2014.
[22] J. Kennedy, and R. C. Eberhart, "Particle swarm optimization," in Proc. of IEEE Int. Conf. on Neural Networks, Perth,27 November-1 December 1995, 1995, pp. 1942–1948.
[23] M. Lichman, "UCI Machine Learning Repository" Irvine, CA: University of California, School of Information and Computer Science. http://archive.ics.uci.edu/ ml. Last visit July 2018.
[24] Zhuzx. Microarray Datasets in Weka ARFF format, http:// csse.szu.edu.cn / staff / zhuzx / Datasets.html (8 July 2018, date last accessed).
[25] V. Stehman, and Stephen, "Selecting and interpreting measures of thematic classification accuracy," Remote Sensing of Environment, vol. 62(1), pp. 77–89, 1997.
[26] Anthony Viera J., and Joanne Garrett M., "Understanding Inter observer Agreement: The Kappa Statistic," Res. Series. Family Medicine, vol. 37( 5), pp. 360 - 363, 2005.
[27] Willmott, Cort J, Matsuura, Kenji, "Advantages of the mean absolute error (MAE) over the root mean square error (RMSE) in assessing average model performance,"Climate Research, vol 30, pp 79–82, 2005.
[28] Messaouda Nekkaa, and Dalila Boughaci, "A memetic algorithm with support vector machine for feature selection and classification," Memetic Comput., vol. 7, pp. 59–73, 2015.
[29] S.Sasikala, S. Appavu alias Balamurugan, and S. Geetha, "A novel adaptive feature selector for supervised classification," Information Processing Letters, vol. 117, pp. 25 – 34, 2017.
[30] Aiguo Wang, Ning An, Guilin Chen, Lian Li, and Gil Alterovitz, "Accelerating wrapper-based feature selection with K-nearest-neighbour," Knowl.-Based Syst., vol. 83, pp. 81–91, 2015.
[31] Yue Huang, Paul J. McCullagh, and Norman D Black, "An optimization of ReliefF for classification in large datasets," Data and Knowl. Eng., vol. 68, pp. 1348–1356, 2009.
[32] Edmundo Bonilla-Huerta, Alberto Hernandez-Montiel, Roberto Morales-Caporal, and Marco Arjona-Lopez, "Hybrid Framework Using Multiple-Filters and an Embedded Approach for an Efficient Selection and Classification of Microarray Data," IEEE/ACM Transactions on Computational Biology And Bioinformatics January/February, vol.13(1), pp. 12-26, 2016.
[33] Kung-Jeng Wang, Angelia Melani Adrian, Kun-Huang Chen, Kung-Min Wang, "An improved
electromagnetism-like mechanism algorithm and its application to the prediction of diabetes mellitus," Journal of Biomedical Informatics, vol. 54, pp. 220–229, 2015.
[34] Joaquin Abellan, Carlos J. Mantas, Javier G. Castellano, Serafin Moral-Garcia, "Increasing diversity in random forest learning algorithm via imprecise probabilities", Expert Systems With Applications, vol. 97, pp. 228–243, 2018.