Proceedings of the 23rd International Conference on Science and Technology Indicators
All papers published in this conference proceedings have been peer reviewed through a peer review process administered by the proceedings Editors. Reviews were conducted by expert referees to the professional and scientific standards expected of a conference proceedings.
Chair of the Conference
Paul Wouters
Scientific Editors
Rodrigo Costas Thomas Franssen Alfredo Yegros-Yegros
Layout
Andrea Reyes Elizondo Suze van der Luijt-Jansen
The articles of this collection can be accessed at https://hdl.handle.net/1887/64521
ISBN: 978-90-9031204-0
© of the text: the authors
© 2018 Centre for Science and Technology Studies (CWTS), Leiden University, The Netherlands
Effects of knowledge flows from public science to industrial
technologies
Lili Wang* and Zexia Li**
UNU-MERIT, Boschstraat 24, Maastricht, 6211 AX (The Netherlands)
**
National Science Library, Chinese Academy of Sciences Institution, Beijing (P.R.China)
Abstract
Scientific research has been well acknowledged as an important knowledge resource for developing technologies. Studying science-technology linkages is crucial to help understand the mechanism of innovation. Using nano technology as a case study, this paper investigates what types of science-technology linkages can help improve the quality of technologies. This study uses backward and forward citation analysis, extracted from the Derwent World Patents Index (DWPI). Our results show that a wide scope of scientific background and a high variety level generally has a positively significant effect on technology. Compared with unknown publications, highly cited publications are likely to lead to high-quality inventions. Moreover, newness of scientific knowledge also presents positive contribution to the quality of citing patents, in particular for university patents.
Keywords: Knowledge transfer, publications, patents, citations, science-technology linkages.
1. Introduction
There are many channels for knowledge transfer from science to technology (Bekkers and Bodas Freitas 2008), ranging from collaborations (Giunta et al. 2016) to sponsored research or consulting (Thursby and Thursby 2011). Scientific publications are found to be the most important instruments (Bekkers and Bodas Freitas 2008). The degree to which scientific publications have been involved in supporting the development of industrial innovations has been increasing over the past decade (Narin et al. 1997; Wang and Li 2018).
In the existing literature, studies have been carried out mainly in the context of advanced economies (McMillan et al. 2000; Narin et al. 1997). Limited research has been done in investigating the linkages of science and technology in emerging countries (Wang and Li 2018). The crucial question, how technologies can benefit from scientific knowledge, is still unanswered. What’s more, little is known about the science-technology linkages across countries. This paper aims to fill these gaps by looking at the types of science-technology linkages that can help improve the value of industrial technologies.
Freitas 2008; McMillan et al. 2000). Scientific research may play a more important role in stimulating more complex technologies. But for less complex technologies, scientific elements may not be crucial. In this study we focus on the field of nanotechnology, which is of one the promising and key enabling technologies (Heinze 2004; Wang et al. 2013).
2. Data collection and methodology
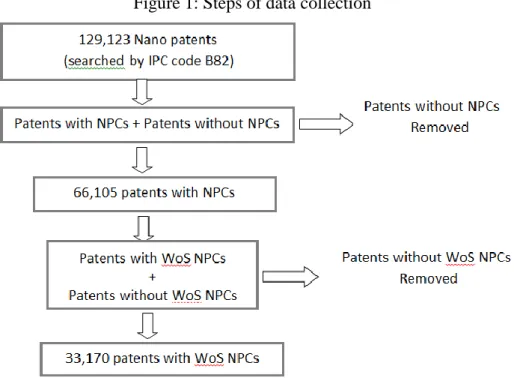
The patent data used in this study are collected from the Derwent World Patents Index (DWPI) via the platform Derwent Innovation (previously known as Thomson Innovation). Since 2011, all patent offices worldwide have classified nanotechnology uniformly under the International Patent Classification (IPC) system. The old Y01N system has been transformed to the B82Y category1. In the new system, all nanotechnology related patents are classified with an IPC code B82 2 . In total there are 129,123 patent applications related to nanotechnology in the studied period of 2000-2015. For each patent, both backward citations and forward citations are collected. Backward citations include both patent citations and non-patent citations (NPCs). After removing those nano non-patents without non-non-patent citations, we obtain 66,105 patents citing non-patent documents (see steps illustrated in Figure 1). NPCs consist of various types of references, including scientific articles, withdrawn patents, technical manuals, databases, web-based information, news, etc. This study aims to investigate the patents citing scientific articles published in Web of Science (WoS) indexed journals. Based on the DOI and title of the listed non-patent citations in each patent, we identify whether these NPCs are indexed by WoS journals. If they are not, we remove the patents from our sample. This step results in 33,170 nano patents.
Based on the information of assignees, the above patents are classified into three organizational types: 1) patents developed by firms, 2) patents developed by research institutes and universities3, and 3) firm –university collaborated patents. Country codes are extracted based on the addresses of inventors. For each patent, we collect its publication ID, application date, number of backward citations (including number of cited patents and number of cited WoS publications), number of forward citations, assignee countries. For the cited WoS publications, we collect the information on publication year, ut number, number of forward citations, countries of authors.
1http://www.epo.org/news-issues/issues/classification/nanotechnology.html.
2 There are two sub-categories covered, i.e. B82B and B82Y. The former refers to inventions related to nano-structures formed by manipulations of individual atoms, molecules, or limited collections of atoms or molecules as discrete units; manufacture of treatment thereof. The latter refers to inventions related to specific uses or applications of structures; measurement of analysis of nanostructures; manufacture of treatment of nano-structures (see more at
Figure 1: Steps of data collection
This study aims to explore the impact of science and technology linkages on the quality improvement of technologies. Patent forward citations are collected to represent the impact or quality of the investigated technology.
For each nano patent, we construct the following indicators.
Scope of technological background is represented by the number of cited patents (nr_cited_patents), . If there are a great number of patents cited by one new invention, this indicates that this new invention was developed based on a wide range of technologies. Otherwise, the scope of technological background is regarded narrow.
The scope of scientific background is denoted by the number of cited WoS articles (nr_cited_pubs), . Similar to the previous indicator, citing more scientific publications indicate a wider scope of scientific background.
Newness of cited scientific articles is measured by the average publication year of the cited WoS articles. Suppose one nano patent cited N WoS scientific articles and the publication year of each article is expressed as , then the value of newness of cited scientific articles
can be calculated by . A lower newness value indicates that this group of cited scientific articles is on average relatively old, while a higher newness value indicates that this patent has been developed based on a group of more recent scientific articles.
Quality of cited scientific articles is represented by the average forward citations of these cited scientific articles. If one nano patent cited N WoS scientific articles and the forward citation of each article is , then the average forward citation of this group of scientific
articles can be measured by . A higher level of average forward citation implies that a
Variety of scientific knowledge resources is measured by the number of author countries of the cited scientific articles. Duplicates have been removed from the list of countries. For instance, if a nano patent cites three WoS articles and the author countries for these three articles are U.S., Netherlands, and U.S., respectively, the value of ‘variety of scientific knowledge resources’ for this patent is counted as two4
.
To further explore different types of knowledge resources, we rely on the list of country names of authors. We use cited WoS articles from US to represent knowledge flows from advance countries, and cited WoS articles from China to represent knowledge flows from emerging economies.
3. Results and discussion
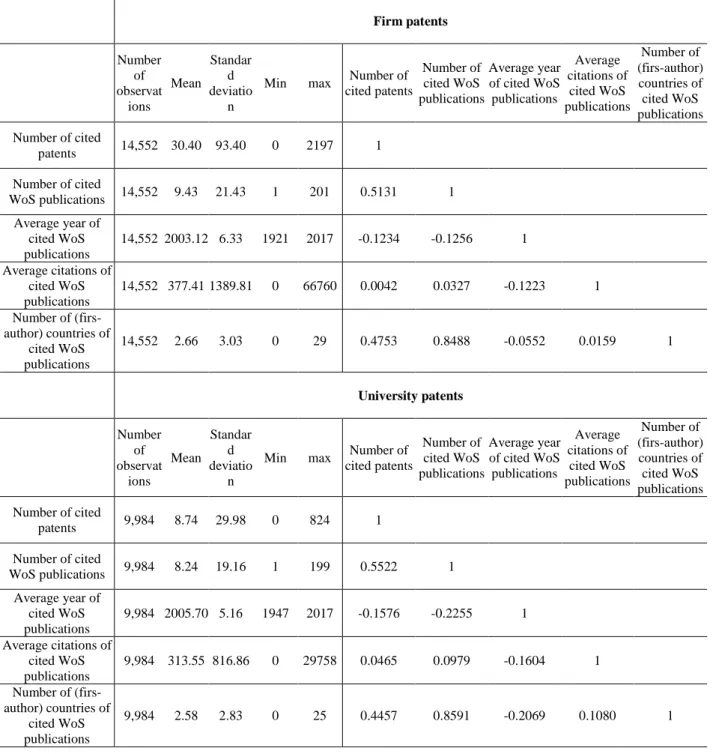
As the invention pattern of firms is different from that of research institutes or universities (Wang and Li, 2018), we provide a separate analysis of patents from different organizational types. Table 1 reports a summary of the main statistics for the variables used in our analysis. The scope of technological background (i.e. number of cited patents) varies greatly, ranging from 0 to 2197 for nano patents developed by firms and 0 to 824 for those developed by research institutes and universities. On average, the number of patents cited by firm patents is remarkably higher than that of university patents, with a mean of 30.40 for the former group and 8.74 for the latter. This shows that, as expected, innovation performance carried by firms is more closely related to the market than innovation performance carried by university.
Table 1: Statistical summary and correlations of variables Firm patents Number of observat ions Mean Standar d deviatio n
Min max Number of cited patents
Number of cited WoS publications
Average year of cited WoS publications Average citations of cited WoS publications Number of (firs-author) countries of cited WoS publications
Number of cited
patents 14,552 30.40 93.40 0 2197 1
Number of cited
WoS publications 14,552 9.43 21.43 1 201 0.5131 1
Average year of cited WoS publications
14,552 2003.12 6.33 1921 2017 -0.1234 -0.1256 1
Average citations of cited WoS publications
14,552 377.41 1389.81 0 66760 0.0042 0.0327 -0.1223 1
Number of (firs-author) countries of
cited WoS publications
14,552 2.66 3.03 0 29 0.4753 0.8488 -0.0552 0.0159 1
University patents Number of observat ions Mean Standar d deviatio n
Min max Number of cited patents
Number of cited WoS publications
Average year of cited WoS publications Average citations of cited WoS publications Number of (firs-author) countries of cited WoS publications
Number of cited
patents 9,984 8.74 29.98 0 824 1
Number of cited
WoS publications 9,984 8.24 19.16 1 199 0.5522 1
Average year of cited WoS publications
9,984 2005.70 5.16 1947 2017 -0.1576 -0.2255 1
Average citations of cited WoS publications
9,984 313.55 816.86 0 29758 0.0465 0.0979 -0.1604 1
Number of (firs-author) countries of
cited WoS publications
9,984 2.58 2.83 0 25 0.4457 0.8591 -0.2069 0.1080 1
Poisson and Negative Binomial are the two types of regressions used often to model count data. In our case, to evaluate the effect of various factors on the forward citations of nano patents, we experimented with both regression types and results stayed rather similar. Judging by the Pseudo R2 values5, we choose to use the set of Poisson regressions.
5 As explained by McFadden (1979), a R-squared in maximum likelihood (ML) estimation is different from that
Given that there is a time lag in receiving citations, it is of importance to take the age of patents into consideration. Therefore, regressions in this study all include year dummies6. To a lesser degree, the national economic environment may also influence the patenting performance in one country. Hence, country dummies7 are also introduced in the regression models.
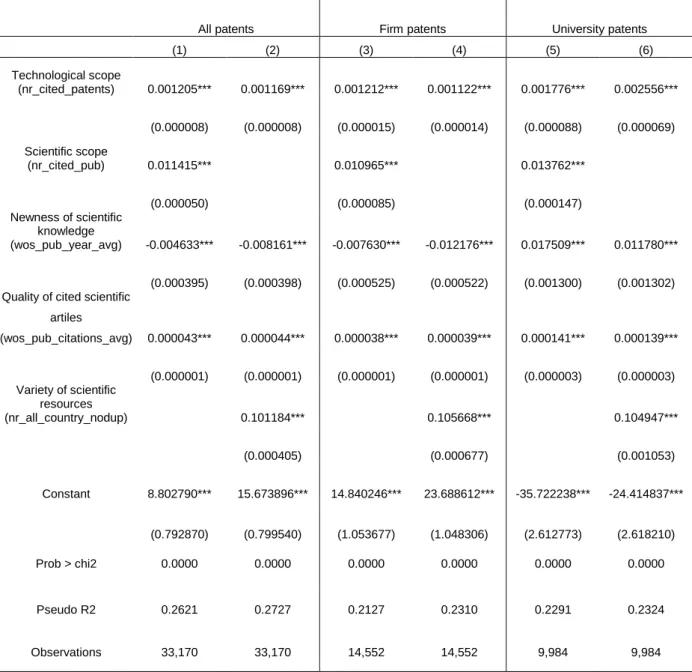
Table 2 documents the regression results of three samples: 1) all patents, 2) firm patents and 3) university patents8. Given that Scientific scope (nr_cited_pub) and Variety of scientific resources (nr_all_country_nodup) are highly correlated, these two variables are included in separate models.
In the first model, technological scope (i.e. number of cited patents) has a significant and positive effect on the dependent variable (i.e. forward citations of nano patents). This variable continues to have a positively significant coefficient in Model 2, as well as for firm patents (Models 3&4) and for university patents (Models 5&6).
The second variable, scientific scope (i.e. number of cited WoS publications) is positively significant in all three models. This implies that a wider scientific scope is likely to lead to a higher patent quality. With regard to the third variable, newness of scientific knowledge, a clear significant positive coefficient is mainly found for university patents (Models 5&6). This effect is significantly negative for firm patents (Models 3&4). This shows that citing more recent scientific publications is only beneficial to university inventions, not to firm patents. This will be further explained later in Table 3.
As this study aims to explore knowledge flows from science to technology, one may wonder whether the quality of science plays a role. The results in Table 2 show that the quality of cited scientific articles (forward citations of cited WoS publications) has a positive effect on the future quality of citing patents. This positive effect is highly significant for all models at the 0.01 level, indicating that a patent developed based on a group of high-quality scientific research is likely to receive more forward citations itself in the future.
Variety of scientific knowledge resources has a significant coefficient in all the models. This points out that it is valuable to refer to scientific knowledge from various origins.
Year dummies for all models are highly significant, which is due to the time lag of forward citations.
6 Based on the publication years of patent applications. 7
Based on the assignee countries.
Table 2: Poisson regression results for the full sample
All patents Firm patents University patents
(1) (2) (3) (4) (5) (6)
Technological scope
(nr_cited_patents) 0.001205*** 0.001169*** 0.001212*** 0.001122*** 0.001776*** 0.002556***
(0.000008) (0.000008) (0.000015) (0.000014) (0.000088) (0.000069)
Scientific scope
(nr_cited_pub) 0.011415*** 0.010965*** 0.013762***
(0.000050) (0.000085) (0.000147)
Newness of scientific knowledge
(wos_pub_year_avg) -0.004633*** -0.008161*** -0.007630*** -0.012176*** 0.017509*** 0.011780***
(0.000395) (0.000398) (0.000525) (0.000522) (0.001300) (0.001302) Quality of cited scientific
artiles
(wos_pub_citations_avg) 0.000043*** 0.000044*** 0.000038*** 0.000039*** 0.000141*** 0.000139***
(0.000001) (0.000001) (0.000001) (0.000001) (0.000003) (0.000003) Variety of scientific
resources
(nr_all_country_nodup) 0.101184*** 0.105668*** 0.104947***
(0.000405) (0.000677) (0.001053)
Constant 8.802790*** 15.673896*** 14.840246*** 23.688612*** -35.722238*** -24.414837***
(0.792870) (0.799540) (1.053677) (1.048306) (2.612773) (2.618210)
Prob > chi2 0.0000 0.0000 0.0000 0.0000 0.0000 0.0000
Pseudo R2 0.2621 0.2727 0.2127 0.2310 0.2291 0.2324
Observations 33,170 33,170 14,552 14,552 9,984 9,984
Note: 1) Standard errors in parentheses, *** p<0.01, ** p<0.05, * p<0.1.
2) The results on 15 year dummies and 46 country dummies are not reported in this table.
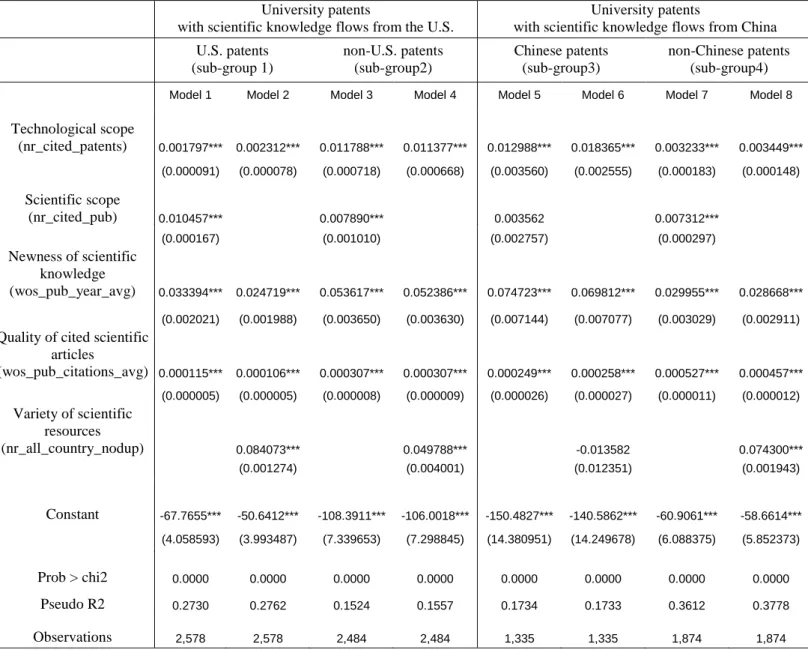
Following the results in Table 2, we extend the analysis on knowledge resources, using cited WoS articles from the U.S. to represent knowledge flows from advanced countries, and cited WoS articles from China to represent knowledge flows from emerging economies. Considering the difference of rationale on the inventions developed by different organizational types, firm patents and university patents are tested separately in Table 3 and Table 4.
The results on the newness of scientific knowledge are mixed, depending on the organizational types and knowledge resource countries. More recent scientific research is more beneficial to U.S. patents citing WoS publication from the U.S. (Models 1&2) and Chinese patents citing WoS publications from China (Models 5&6). Namely, more recent scientific knowledge is beneficial to patents developed by inventors from the same countries as the knowledge origins. For crossing knowledge flows – i.e. the knowledge resource country is different from the patent inventor country – relatively early knowledge is more beneficial (see Models 4&5 for non-U.S. patents citing scientific knowledge from the U.S. and Models 7 & 8 for non-Chinese patents citing scientific knowledge from China).
Table 3: Poisson regression results for the sub-samples_ firm patents
Firm patents
with scientific knowledge flows from the U.S.
Firm patents
with scientific knowledge flows from China
U.S. patents (sub-group 1)
non-U.S. patents (sub-group 2)
Chinese patents (sub-group 3)
Non-Chinese patents (sub-group 4)
Model 1 Model 2 Model 3 Model 4 Model 5 Model 6 Model 7 Model 8
Technological scope
(nr_cited_patents) 0.001462*** 0.001378*** 0.001034*** 0.000923*** 0.005626** 0.008996*** 0.001326*** 0.001241***
(0.000022) (0.000022) (0.000023) (0.000024) (0.002496) (0.002317) (0.000024) (0.000026)
Scientific scope
(nr_cited_pub) 0.007227*** 0.010288*** 0.052051*** 0.007450***
(0.000118) (0.000163) (0.011231) (0.000133)
Newness of scientific knowledge
(wos_pub_year_avg) 0.010565*** 0.007794*** -0.004233*** -0.007701*** 0.066108*** 0.046425*** -0.017651*** -0.004615**
(0.000927) (0.000942) (0.001197) (0.001187) (0.017154) (0.016140) (0.001816) (0.001890)
Quality of cited scientific articles
(wos_pub_citations_avg) 0.000071*** 0.000076*** 0.000206*** 0.000209*** 0.000228*** 0.000392*** 0.000153*** 0.000171***
(0.000004) (0.000004) (0.000005) (0.000004) (0.000083) (0.000076) (0.000006) (0.000006)
Variety of scientific resources
(nr_all_country_nodup) 0.076354*** 0.104061*** -0.051082* 0.088220***
(0.000897) (0.001695) (0.029157) (0.001139)
Constant -21.5073*** -16.2439*** 8.1250*** 14.8946*** -133.8205*** -94.0437*** 35.1117*** 8.5023**
(1.859425) (1.890867) (2.404012) (2.383574) (34.533627) (32.489379) (3.647085) (3.797581)
Prob > chi2 0.0000 0.0000 0.0000 0.0000 0.0000 0.0000 0.0000 0.0000
Pseudo R2 0.2475 0.2679 0.2616 0.2640 0.2904 0.2824 0.3572 0.3901
Observations 4,452 4,452 3,665 3,665 205 205 2,755 2,755
Note: 1) Standard errors in parentheses, *** p<0.01, ** p<0.05, * p<0.1
2) The results on 15 year dummies and 46 country dummies are not reported in this table.
Another interesting observation is that, related to the effect of scientific scope and variety of scientific resources, there is a difference between the groups. Except in the third sub-group (Models 5&6), the coefficients of scientific scope and variety of scientific resources are positively significant in all the remaining three sub-groups (Models 1, 2, 3, 4, 7 & 8). That is, for most cases, it is more beneficial to have a higher variety level of scientific resources. However, for Chinese patents developed based on Chinese science, the scientific scope does not play a role. And even a variety of scientific resources contribute negatively. In fact, the average level of scientific scope in sub-group 3 is much lower than that of other sub-groups (3.11 v.s. 18.18 for firm patents and 3.35 v.s. 17.04 for university patents). Similarly, on average the variety level in sub-group 3 is also remarkably lower than the mean of that of other sub-groups (1.84 v.s. 4.14 for firm patents and 1.50 v.s. 4.42 for university patents). This means that, for the group of Chinese patents developed based on Chinese science, the scientific scope and knowledge variety is considerably low.
Table 4: Poisson regression results for the sub-samples_ university patents
University patents
with scientific knowledge flows from the U.S.
University patents
with scientific knowledge flows from China
U.S. patents (sub-group 1)
non-U.S. patents (sub-group2)
Chinese patents (sub-group3)
non-Chinese patents (sub-group4)
Model 1 Model 2 Model 3 Model 4 Model 5 Model 6 Model 7 Model 8
Technological scope
(nr_cited_patents) 0.001797*** 0.002312*** 0.011788*** 0.011377*** 0.012988*** 0.018365*** 0.003233*** 0.003449***
(0.000091) (0.000078) (0.000718) (0.000668) (0.003560) (0.002555) (0.000183) (0.000148)
Scientific scope
(nr_cited_pub) 0.010457*** 0.007890*** 0.003562 0.007312***
(0.000167) (0.001010) (0.002757) (0.000297)
Newness of scientific knowledge
(wos_pub_year_avg) 0.033394*** 0.024719*** 0.053617*** 0.052386*** 0.074723*** 0.069812*** 0.029955*** 0.028668***
(0.002021) (0.001988) (0.003650) (0.003630) (0.007144) (0.007077) (0.003029) (0.002911)
Quality of cited scientific articles
(wos_pub_citations_avg) 0.000115*** 0.000106*** 0.000307*** 0.000307*** 0.000249*** 0.000258*** 0.000527*** 0.000457***
(0.000005) (0.000005) (0.000008) (0.000009) (0.000026) (0.000027) (0.000011) (0.000012)
Variety of scientific resources
(nr_all_country_nodup) 0.084073*** 0.049788*** -0.013582 0.074300***
(0.001274) (0.004001) (0.012351) (0.001943)
Constant -67.7655*** -50.6412*** -108.3911*** -106.0018*** -150.4827*** -140.5862*** -60.9061*** -58.6614***
(4.058593) (3.993487) (7.339653) (7.298845) (14.380951) (14.249678) (6.088375) (5.852373)
Prob > chi2 0.0000 0.0000 0.0000 0.0000 0.0000 0.0000 0.0000 0.0000
Pseudo R2 0.2730 0.2762 0.1524 0.1557 0.1734 0.1733 0.3612 0.3778
Observations 2,578 2,578 2,484 2,484 1,335 1,335 1,874 1,874
To further understand the age of contributing scientific knowledge in different sub-samples, Figures 2&3 present the distribution of publication year of cited scientific publications from China and the U.S., respectively.
Focusing on the scientific flow from China, Figure 2 compares the firm patents (in red lines) with university patents (in yellow lines). This figure shows that university patents tend to cite more recent articles than firm patents do. Furthermore, the citing patents are classified into Chinese and non-Chinese patents, represented by solid lines and dashed lines respectively. For the patents from the same type of organizations (in the same color), the dashed lines are located on the left side compared with the solid lines. This means that patents developed by Chinese inventors tend to cite more recent Chinese articles, while foreign patents tend to cite earlier Chinese articles. This rule applies to both firm and university patents. The peak of average publication year of articles cited by Chinese university patents was after 2010.
Figure 2: Density of publication year of cited Chinese scientific articles
0
.0
5
.1
.1
5
d
e
n
si
ty
o
f
p
u
b
lica
ti
o
n
y
e
a
r
o
f
ci
te
d
a
rt
ic
le
s
1970 1980 1990 2000 2010 2020
year
Chinese firm patents non-Chinese firm patents
Chinese university patents non-Chinese university patents
Figure 3: Density of publication year of cited scientific articles from the U.S. 0 .0 2 .0 4 .0 6 .0 8 .1 d e n si ty o f p u b lica ti o n y e a r o f ci te d a rt ic le s
1970 1980 1990 2000 2010 2020
year
US firm patents non-US firm patents
US university patents non-US university patents
Note: Observations earlier than 1970 are not included in this figure.
4. Conclusions
Using backward and forward citations and focusing on nano technologies, this study investigates what types of science-technology linkage can help improve the quality of new technologies. Our results show that, in general, a wider scientific scope is likely to lead to a higher patent quality. This emphasizes the importance of applying scientific knowledge in developing industrial technologies. We also find that, in most cases, the variety of scientific resources plays an important role in supporting patents. However, there is also an exceptional circumstance. When Chinese patents are developed based on Chinese science – in which case the scientific scope and variety level is very low – the significant positive contribution is missing.
The newness of scientific knowledge contributed positively and significantly to the quality of patents developed by universities. This contribution is mixed in the sub-groups of firm patents, depending on the country origins of cited science and citing patents. Irrespective of patent types or country origins, our findings show that the quality of cited science has been always crucial in affecting the quality of citing patents. A high-quality scientific base can help lead to a high-quality patent.
advanced countries. Our findings also strengthen the importance of international knowledge spillovers.
This calls for future attention on stimulating science-technology interactions. It is beneficial, in particular for inventors in firms, to be aware of scientific research, no matter the country origins. By bringing related scientific research to the sight of industry, one may help spur more valuable innovations.
The analyses of this study are based on the patent citations. Although citation analysis provides important means to track knowledge flows, it is limited to published scientific research. Citations reveal the formal and direct linkages between science and technology. Nevertheless, the informal or indirect linkages beyond citation analysis can be subjects of future studies.
References
Bekkers, R., & Bodas Freitas, I. M. (2008). Analysing knowledge transfer channels between universities and industry: To what degree do sectors also matter ? Research Policy, 37, 1837–1853. doi:10.1016/j.respol.2008.07.007
Cameron, A. C., Windmeijer, F. A. G., & Cameron, A. C. (1996). R-Squared Measures for Count Data Regression Models With Applications to Health-Care Utilization. Journal of
Business and Economic Statistics, 14(2), 209–220.
Giunta, A., Pericoli, F. M., & Pierucci, E. (2016). University-Industry collaboration in the biopharmaceuticals: the Italian case. Journal of Technology Transfer, 41(4), 818–840. doi:10.1007/s10961-015-9402-2
Heinze, T. (2004). Nanoscience and Nanotechnology in Europe: Analysis of Publications and Patent Applications including Comparisons with the United States. Nanotechnology Law
& Business, 1(4), 1–19. http://papers.ssrn.com/sol3/papers.cfm?abstract_id=1394375
McMillan, G. S., Narin, F., & Deeds, D. L. (2000). An analysis of the critical role of public science in innovation: the case of biotechnology. Research Policy, 29(1), 1–8.
doi:10.1016/S0048-7333(99)00030-X
Narin, F., Hamilton, K. S., & Olivastro, D. (1997). The increasing linkage between U.S. technology and public science. Research Policy, 26, 317–330.
Thursby, J., & Thursby, M. (2011). University-industry linkages in nanotechnology and biotechnology: Evidence on collaborative patterns for new methods of inventing.
Journal of Technology Transfer, 36(6), 605–623. doi:10.1007/s10961-011-9213-z
Van Raan, a. F. J. (2004). Sleeping Beauties in science. Scientometrics, 59(3), 467–472. Wang, L., & Li, Z. (2018). Knowledge Transfer from Science to Technology—The Case of
Nano Medical Device Technologies. Frontiers in Research Metrics and Analytics, 3(11), 1–8. doi:10.3389/frma.2018.00011