EXAMINING AN ELABORATED SOCIOCULTURAL MODEL OF DISORDERED EATING AMONG COLLEGE WOMEN: THE ROLES OF SOCIAL COMPARISON AND BODY
SURVEILLANCE
Ellen E. Fitzsimmons-Craft
A dissertation submitted to the faculty of the University of North Carolina at Chapel Hill in partial fulfillment of the requirements for the degree of Doctor of Philosophy in the Department
of Psychology (Clinical Psychology).
Chapel Hill 2013
Approved by:
© 2013
ABSTRACT
Ellen E. Fitzsimmons-Craft: Examining an Elaborated Sociocultural Model of Disordered Eating in College Women: The Roles of Social Comparison and Body Surveillance
(Under the direction of Anna M. Bardone-Cone)
College represents a unique vulnerability period for the development of body
dissatisfaction and disordered eating among women. These negative health concerns may be at least partially explained by social comparison and objectification theories. This study extended previous research by examining how these theories fit into an elaborated version of the
ACKNOWLEDGMENTS
First and foremost, I would like to express my deepest gratitude to my advisor, Anna Bardone-Cone. I could not have asked for a more supportive, thoughtful, and caring mentor and will be forever grateful for the opportunity to work with such a wonderful researcher and person. I would also like to thank my dissertation committee for their thoughtful feedback and the undergraduate research assistants who made this project possible: Alexandra Armor, Caitlin Crawford, Shelby Godfrey, Ayat Hamza, Caline Hou, Stephanie Jernigan, Jessica Maldonado, Chelsea Parker, Nicole Pradel, and Caroline White. I would like to acknowledge my mother, Joan Fitzsimmons, for her unwavering validation and Meg Harney for her support both inside and outside the lab. Finally, I would like to thank my husband, Tim Craft, for being such an encouraging, grounding, and loving presence in my life.
This research was supported by the following grants: NIH F31MH093978; University of North Carolina at Chapel Hill Department of Psychology Earl and Barbara Baughman
TABLE OF CONTENTS
LIST OF TABLES………...viii
LIST OF FIGURES………ix
LIST OF ABBREVIATIONS………..x
INTRODUCTION………...1
Social comparison………4
Self-objectification……….10
The current study………...14
Preliminary studies……….18
METHOD………..21
Participants and procedure……….21
Measures at Time 1 (T1) and Time 2 (T2)………25
Ecological momentary assessment (EMA) measures………33
Analytic strategy………34
RESULTS………..40
Descriptive statistics………..40
Hypothesis 1: Examining the elaborated sociocultural model of disordered eating……..42
Hypothesis 3: Examining social comparison and body surveillance as
mediators of the thin ideal internalization-body dissatisfaction relation
using momentary data………52
DISCUSSION………59
Hypothesis 1: Examining the elaborated sociocultural model of disordered eating……..59
Hypothesis 2: Examining the effects of momentary social comparison and body surveillance on momentary body dissatisfaction………...63
Hypothesis 3: Examining social comparison and body surveillance as mediators of the thin ideal internalization-body dissatisfaction relation using momentary data………66
Strengths………69
Limitations……….71
Future directions………73
Clinical implications………..75
Conclusion……….78
APPENDIX 1: BODY, EATING, AND EXERCISE COMPARISON ORIENTATION MEASURE (BEECOM)………97
APPENDIX 2: EMA QUESTIONS………100
ENDNOTES………113
LIST OF TABLES
Table 1: Demographic information………80
Table 2: Schedule of study activities……….81
Table 3: Means and standard deviations of the measured variables at T1 (n = 226)……….82
Table 4: Correlations among the measured variables at T1 (n = 226)………...83
Table 5: Separate generalized estimating equations analyses using a gamma distribution of the effects of momentary body-, eating-, and exercise-related social comparison and body surveillance on momentary body dissatisfaction……….85
LIST OF FIGURES
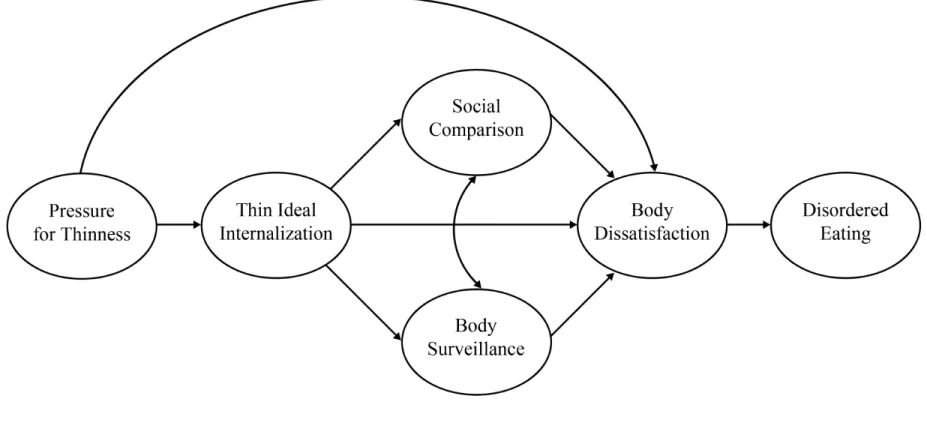
Figure 1: An elaborated version of Stice’s (1994) sociocultural model of disordered eating. Social comparison and body surveillance are conceived
as mediators of the thin ideal internalization-body dissatisfaction link……….88 Figure 2: Standardized path coefficients and factor loadings for the traditional
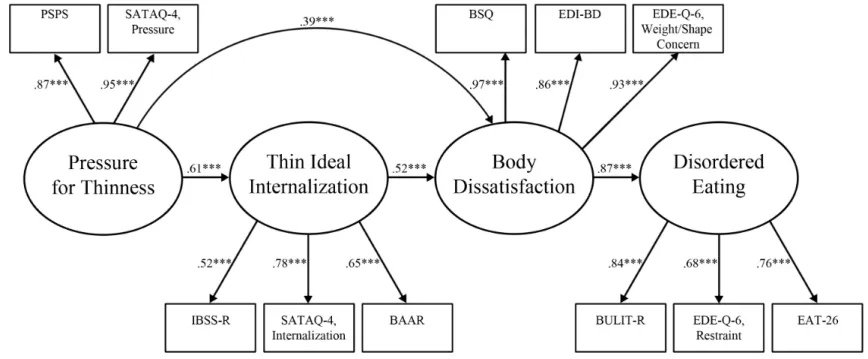
sociocultural model of disordered eating structural model………89 Figure 3: Standardized path coefficients and factor loadings for the elaborated
sociocultural model of disordered eating structural model………91 Figure 4: Illustration of the full 2-1-1 mediation model with unstandardized
path coefficients……….93 Figure 5: Illustration of the full 1-1-1 mediation model with unstandardized
LIST OF ABBREVIATIONS
BAAR Beliefs About Attractiveness Scale-Revised BC Bias-corrected
BEECOM Body, Eating, and Exercise Comparison Orientation Measure BMI Body mass index
BSQ Body Shape Questionnaire BULIT-R Bulimia Test-Revised CFA Confirmatory factor analysis CFI Comparative fit index CI Confidence interval EAT-26 Eating Attitudes Test-26
EDE-Q Eating Disorder Examination-Questionnaire EDI-BD Eating Disorder Inventory-Body Dissatisfaction EFA Exploratory factor analysis
EMA Ecological momentary assessment GEEs Generalized estimating equations IBSS-R Ideal-Body Stereotype Scale-Revised ICC Intraclass correlation
MCAR Missing completely at random MLM Multilevel modeling
RMSEA Root mean square error of approximation
SATAQ-4 Sociocultural Attitudes Toward Appearance Questionnaire-4 SEM Structural equation modeling
SRMR Standardized root-mean-square residual TLI Tucker-Lewis Index
T1 Time 1
INTRODUCTION
In university settings, the statistics regarding eating disorder prevalence are alarming, as between 4% and 9% of college women suffer from diagnosable eating disorders (Hesse-Biber, Marino, & Watts-Roy, 1999; Keel, Heatherton, Dorer, Joiner, & Zalta, 2006; Pyle, Neuman, Halvorson, & Mitchell, 1991). When disordered eating estimates for this group are broadened to include subthreshold presentations, prevalence estimates range from 34% to 67% of college women (e.g., Berg, Frazier, & Sherr, 2009; Franko & Omori, 1999; Hoerr, Bokram, Lugo, Bivins, & Keast, 2002; Krahn, Kurth, Gomberg, & Drewnowski, 2005; Mintz & Betz, 1988; Mintz, O’Halloran, Mulholland, & Schneider, 1997). Of note, Mintz and Betz (1988) reported that only 33% of the college women in their study could be classified as “normal eaters,” indicating that disordered eating is relatively “normative” for this group. Furthermore, body dissatisfaction, which has been described as one of the “most consistent and robust risk and maintenance factors for eating pathology” (Stice, 2002, pp. 832-833) is experienced by up to 80% of college women (Heatherton, Nichols, Mahamedi, & Keel, 1995; Neighbors & Sobal, 2007; Silberstein, Striegel-Moore, Timko, & Rodin, 1988; Spitzer, Henderson, & Zivian, 1999; Vohs, Heatherton, & Herrin, 2001).
Both environmental and genetic factors and their interplay influence risk for eating disorders (Bulik, 2005; Bulik & Tozzi, 2004). Not all individuals who are exposed to societal pressures for thinness develop eating disorders and not all individuals with a genetic
we will focus on better understanding certain environmental risk factors (i.e., sociocultural influences) for eating pathology. Indeed, there is support for a sociocultural model of disordered eating among college women (e.g., Stice, 1994; Stice, Nemeroff, & Shaw, 1996; Thompson, Heinberg, Altabe, & Tantleff-Dunn, 1999). According to Stice’s sociocultural model, disordered eating is a result of pressure for women in Western society (e.g., from media, family, and peers) to achieve an ultraslender figure (Striegel-Moore, Silberstein, & Rodin, 1986). As described by Chernin (1981), there is a “tyranny of slenderness” that rules over women in the United States. For example, the media has espoused a viewpoint that the ultraslender look is both desirable and achievable, when in fact, this “ideal” is very difficult or nearly impossible for most women to achieve without engaging in extreme weight loss efforts (Brownell, 1991). Typically, for these sociocultural pressures to have harmful effects on an individual, they must be internalized. If a woman does not “buy in” to these pressures, it is less likely that they would lead to disordered eating. However, if a woman does assimilate and internalize the thin ideal and the values
Cross-sectional research has demonstrated a robust link between thin ideal internalization and body dissatisfaction, and prospective research has indicated that thin ideal internalization predicts increased body dissatisfaction (e.g., Keery, van den Berg, & Thompson, 2004; Shroff & Thompson, 2006; Stice & Whitenton, 2002); such dissatisfaction can in turn lead to eating pathology (Halliwell & Harvey, 2006). However, sociocultural models of disordered eating (e.g., Stice, 1994; Stice et al., 1996) currently lack comprehensive explanations as to how thin ideal internalization leads to body dissatisfaction and subsequent eating pathology. Theoretically, women who have internalized the thin ideal would be at risk for developing body dissatisfaction when the ideal is not actualized; yet, how do these individuals come to know that they have not realized such an ideal – through what mechanisms does this occur? How does a woman come to know that there is a discrepancy between what she would ideally like to look like and what she currently looks like? A better understanding of the mechanisms by which thin ideal
internalization translates itself into body dissatisfaction would inform prevention efforts and provide researchers and clinicians with a more comprehensive understanding of the sociocultural influences underlying the development of body dissatisfaction.
Carey, 2001; Hays & Oxley, 1986; Paul & Kelleher, 1995). Second, weight and shape become increasingly salient and important in women’s everyday lives in the college setting (Berscheid, Walster, & Bohrnstedt, 1973; Cash & Green, 1986; Cook-Cottone & Phelps, 2003; Fallon & Rozin, 1985). Furthermore, a woman’s understanding of her body is based not only on her own views of it, but also on how she believes others view it (Davison & McCabe, 2005). Thus, the implications of social comparison and self-objectification (i.e., two ways to gain information about one’s and others’ view of the body) may be especially far-reaching during the college years, a time when many people undergo significant changes in self-concept (Lindner, Hughes, & Fahy, 2008; Pascarella, Smart, Ethington, & Nettles, 1987) and when peer interaction and weight and shape are particularly salient. College women may be particularly vulnerable to the effects (e.g., body dissatisfaction and disordered eating) of social comparison- and
objectification-related behaviors if they result in an individual coming to the conclusion that there is a gap between her actual and ideal selves (i.e., between her current appearance and her ideal appearance; Cash & Szymanski, 1995). Thus, overall, college women represent an at-risk group given this confluence of factors, and a better understanding of the social psychological underpinnings of body dissatisfaction and disordered eating may identify specific behaviors (i.e., social comparison, body surveillance – the behavioral indicator of self-objectification; Moradi & Huang, 2008) that may adversely influence these women and which could be targeted with prevention efforts.
Social Comparison
comparisons (and even at times when they are; Klein, 1997), individuals look to their social environments and make comparisons with available others (Corning, Krumm, & Smitham, 2006). Indeed, comparison with others, both intentionally and unintentionally, is a common and basic social phenomenon and has been described as a “core element of human conduct and experience” (Suls, Martin, & Wheeler, 2002, p. 159) that pervades nearly all life domains (Gibbons & Buunk, 1999; Gilbert, Price, & Allan, 1995).
Festinger (1954) originally suggested that the affective consequences of such comparison processes are influenced by the direction (i.e., upward or downward) and characteristics of the target (i.e., universalistic or particularistic). Upward social comparisons are said to occur when an individual compares herself to someone whom she perceives to be “better off,” while
downward social comparisons occur when an individual compares herself to someone whom she perceives to be “worse off” (Myers & Crowther, 2009). Research findings have generally
demonstrated deleterious effects of upward comparisons (e.g., Gibbons, 1986; Hackmiller, 1966) and positive effects of downward comparisons (e.g., Marsh & Parker, 1984; Testa & Major, 1990). Festinger (1954) further hypothesized that people typically have a drive to make comparisons that result in favorable, as opposed to unfavorable, outcomes, and that whenever possible, individuals will compare themselves to those with whom they are most similar (i.e., particularistic targets – e.g., friends, peers, family) rather than with individuals who are
perceived to be more dissimilar (i.e., universalistic targets – e.g., distant sources of influence like the mass media; Bosveld, Koomen, & van der Pligt, 1994; Morrison, Kalin, & Morrison, 2004).
(Myers & Crowther, 2009). For one, women frequently make appearance-related social comparisons (Leahey, Crowther, & Mickelson, 2007) and continue to do so even when they perceive themselves as “coming up short” (Strahan, Wilson, Cressman, & Buote, 2006). Indeed, comparisons made on appearance-related dimensions are generally upward, as women tend to compare themselves to media images and other women they perceive to be thinner and/or more attractive than themselves (Morrison et al., 2004; van den Berg, Thompson, Obremski-Brandon, & Coovert, 2002), and college women engage in more upward than downward comparison (e.g., Cattarin, Thompson, Thomas, & Williams, 2000; Heinberg & Thompson, 1992a; Leahey & Crowther, 2008; Leahey et al., 2007; O’Brien et al., 2009). Despite the fact that such upward comparisons often result in feelings of discontent and dissatisfaction (Thompson et al., 1999), women continue to engage in these comparisons on a regular basis. It is possible that college women may be motivated to make upward comparisons in order to gain information about and learn how to be more like individuals that they “look up to” in some sense (i.e., for purposes of self-improvement; Buunk & Gibbons, 2007; Taylor & Lobel, 1989). Although Festinger’s (1954) original theory also purported that individuals are most likely to compare themselves with
similar others, research has indicated that women often compare themselves to unrealistic, thin ideal media images (Engeln-Maddox, 2005; Strahan et al., 2006). It may be that women believe making comparisons with individuals who are perceived to have much expertise in a particular area (in this case, women in the media who represent the thin ideal) could provide a good deal of information (Martinot & Redersdorff, 2002) and serve as a source of inspiration (e.g., Collins, 1996; Mills, Polivy, Herman, & Tiggemann, 2002; Myers & Biocca, 1992). In general, the perceived relevance of comparison targets may be determined by individual motives. For
images that reflect this ideal may be deemed as particularly relevant for her (Strahan et al., 2006).
College campuses are settings that may lend themselves to appearance-related social comparisons. Women are surrounded by many other women of approximately the same age with whom they interact both directly (e.g., in class, roommate interactions) and indirectly (e.g., passing another woman on campus) on a daily basis (Lindner et al., 2008). Buunk and Gibbons (2007) noted that three features characterize the “typical” individual who engages in social comparison: high chronic activation of the self (e.g., Stapel & Tesser, 20011), a strong interest in being a part of a group and in what others think and feel, and uncertainty of the self – all of which also tend to characterize college women (e.g., Lindner et al., 2008). Not surprisingly, social comparison behavior has been found to be pervasive among college women (e.g., Summerville & Roese, 2008).
There is ample evidence that college women engage in frequent comparisons with peers in order to gain an understanding of their weight/shape status relative to others (e.g., Striegel-Moore et al., 1986), and research and theory have suggested that social comparison with peers, which are usually in the upward direction, may be one pathway through which internalized sociocultural pressures for thinness develop into body dissatisfaction and disordered eating (Dittmar, 2005; Dittmar & Howard, 2004; Fitzsimmons-Craft et al., 2012c; Leahey et al., 2007; Wood, 1996). It may be that via social comparison, individuals come to know that they have not yet actualized their ideal.
Indeed, frequent engagement in social comparisons with peers has generally been
Regarding the effects of upward versus downward and particularistic versus universalistic comparisons, Heinberg and Thompson (1992b) gave female college students feedback that their own body size was either smaller or larger than average with reference to either the “average student” (i.e., particularistic comparison target) or the “average USA citizen” (i.e., universalistic target). Interestingly, a main effect for feedback type did not emerge, but a main effect for target comparison group did. Specifically, participants who compared themselves to peers displayed greater body image anxiety and distress than participants who compared themselves to the average citizen. Thus, regardless of the type of information they were given (that they were either smaller or larger), participants experienced negative consequences from making a particularistic comparison. Research has indicated that women also make comparisons with idealized media images (i.e., universalistic targets) and that these may be associated with negative outcomes (e.g., Cattarin et al., 2000; Halliwell & Dittmar, 2005). However, as
Other experimental work has also investigated the effects of social comparison with peers. For example, Lin and Kulik (2002) examined the impact of exposure to images of thin or overweight peers on self-evaluation. College women who were exposed to and who believed they were competing with a thin peer in a mock “dating game” (i.e., told a male would choose which of the two women he would prefer to go on a date with) experienced decreased body satisfaction and confidence. Exposure to the overweight peer had no influence – that is, exposure to such an image did not produce a compensatory, elevating effect on body satisfaction and confidence. Similarly, Krones, Stice, Batres, and Orjada (2005) found that undergraduate women who were exposed to a thin ideal confederate demonstrated significant increases in body
dissatisfaction relative to those in the control condition (i.e., those who were exposed to an average-sized female peer).
relations between social comparison behavior with peers and later body dissatisfaction and disordered eating.
Self-Objectification
Objectification theory (Fredrickson & Roberts, 1997) is another social psychological theory that may help explain the development and maintenance of body dissatisfaction and disordered eating in college women. Within dominant American culture, theorists have posited that the feminine body has been constructed as an object to be looked at (Fredrickson & Roberts, 1997; McKinley & Hyde, 1996) and sexually gazed upon (Spitzack, 1990). It is not uncommon for a woman to feel sexually objectified (often by men), as her “sexual parts or functions are separated out from her person, reduced to status of mere instruments, or else regarded as if they were capable of representing her” (Bartky, 1990, p. 35). Such sexualization may occur in many forms, such as via sexual violence or through gaze (i.e., visual inspection of the body;
Fredrickson & Roberts, 1997). Because the female body exists in this sociocultural context and because women often experience sexual objectification (i.e., the experience of being treated solely as a body that exists for the use and pleasure of others; American Psychological
self-objectification describes a perspective of oneself, while body surveillance is the active, behavioral manifestation of this viewpoint.
Women also receive the message that they have the ability to control their bodies and that given the appropriate amount of effort, they can comply with cultural standards of thinness (McKinley & Hyde, 1996). Thus, many women feel they must engage in constant body
surveillance in order to ensure their compliance with the thin ideal (Gilbert & Thompson, 1996; McKinley, 2004; Thompson & Stice, 2001). It is via this self-surveillance that many women realize there is a discrepancy between what they see and what they would ideally like to look like, and thus, may experience negative consequences (e.g., McKinley & Hyde, 1996). The development of body image disturbance in college women can be at least partially explained by body surveillance (Fredrickson & Roberts, 1997; McKinley, 1998; McKinley & Hyde, 1996). Specifically, when an individual focuses attention on herself and has an awareness of cultural standards of beauty but cannot reduce the discrepancy between the two, she feels badly (Carver & Scheier, 1981; Knauss, Paxton, & Alsaker, 2008). Thus, body surveillance may serve as an additional explanation as to how thin ideal internalization leads to body dissatisfaction and disordered eating (e.g., Fitzsimmons-Craft et al., 2012c).
refers to the importance of appearance to one’s sense of self, diminishes with age (e.g., Cash, Winstead, & Janda, 1986; Pliner, Chaiken, & Flett, 1990). Perhaps for these reasons, disordered eating tends to decline following college and during the transition to early adulthood (e.g., Heatherton, Mahamedi, Striepe, Field, & Keel, 1997). Thus, despite the fact that body dissatisfaction is a very strong predictor of disordered eating (e.g., Stice, 2002), it remains relatively stable across the life span in a way that disordered eating does not (Tiggemann & Lynch, 2001) – likely because of the changes in appearance investment that occur. Although older women may still feel unhappy with their bodies, they may be less likely to actually do something to alleviate such discontent since appearance becomes less important to them. Given all of this, it is important to examine processes, such as self-objectification, that leave women feeling particularly invested in appearance and vulnerable to engaging in disordered eating during the college years.
self-objectification can last beyond the self-objectifying situation itself among college women; in particular, results indicated that women who tried on the swimsuit continued to have thoughts about their body even after putting their street clothes back on. Other experimental procedures designed to heighten state self-objectification, such as using a sentence scrambling task with objectifying words (Roberts & Gettman, 2004) or leading participants to believe they would be interacting with a male stranger (and anticipating a male gaze; Calogero, 2004), have also been found to lead negative outcomes, such as increased body shame and appearance anxiety.
A host of correlational research has also linked trait-level self-objectification and body surveillance with body dissatisfaction and disordered eating among college women (e.g.,
Greenleaf, 2005; Greenleaf & McGreer, 2006; Moradi, Dirks, & Matteson, 2005; Muehlenkamp & Saris-Baglama, 2002; Muehlenkamp, Swanson, & Brausch, 2005; Noll & Fredrickson, 1998; Tiggemann & Kuring, 2004; Tiggemann & Slater, 2001; Tylka & Hill, 2004). In an effort to extend this research, we wanted to investigate how body surveillance, the behavioral indicator of self-objectification, may fit into an elaborated sociocultural model of disordered eating. In particular and as was proposed earlier, body surveillance may explain the relation between thin ideal internalization and body dissatisfaction and disordered eating. Indeed, Myers and Crowther (2007) and Fitzsimmons-Craft and colleagues (2012c) found that both the process of
self-objectification and the behavior of body surveillance mediated the relation between
The Current Study
While there is some evidence to support the roles of social comparison and body
and to date, researchers have yet to use EMA methodology to further research on the sociocultural model of disordered eating.
Second, research on this sociocultural model of disordered eating lacks a comprehensive understanding as to how thin ideal internalization leads to body dissatisfaction and subsequent disordered eating. Third, although aspects of the sociocultural model of disordered eating have been tested longitudinally (e.g., Stice, Shaw, & Nemeroff, 1998), much of the work in this area has been cross-sectional (e.g., Stice, Schupak-Neuberg, Shaw, & Stein, 1994; Twamley & Davis, 1999), which has precluded understanding causal mechanisms. Further, the longitudinal work that has been done has typically not controlled for the temporal stability of study constructs (Stice, 2001; Stice & Bearman, 2001). This study addresses these limitations. Data were collected from female undergraduates using the methodologies of: 1) questionnaires
administered at two time points (i.e., Time 1 (T1; beginning of an academic semester) and Time 2 (T2; end of an academic semester), which were about three months apart), and 2) EMA using participants’ personal computers and online surveys (3x/day) across two weeks.
Hypothesis 1: An elaborated version of the sociocultural model of disordered eating that includes social comparison and objectification theories was examined; in particular, we included social comparison and body surveillance as mediators of the thin ideal internalization-body dissatisfaction relation in this model (see Figure 1). All paths specified between constructs in the model were grounded in previously discussed empirical findings and/or in theory. It was
hypothesized that a sociocultural model incorporating traditional self-report measures of social comparison and body surveillance would provide a good fit to the data and that social
disordered eating (i.e., a model not including the constructs of social comparison and body surveillance) in order to ascertain what (if anything) is gained by incorporating these constructs in the model. These models were examined cross-sectionally (i.e., using only the T1 data).
If the elaborated sociocultural model provides a good fit to the data and social comparison and body surveillance emerge as significant mediators of the thin ideal
internalization-body dissatisfaction relation, we will explore the potential prospective relations among the constructs involved in the mediational component of this model (i.e., thin ideal internalization, social comparison, body surveillance, body dissatisfaction). First, we will examine if thin ideal internalization at T1 prospectively predicts social comparison and body surveillance at T2 and if social comparison and body surveillance at T1 prospectively predict body dissatisfaction at T2 both without and with controlling for baseline levels of the outcome variable. In other words, we were interested in both whether these constructs predicted future levels of one another and whether these constructs predicted change in one another over time. We hypothesized that these constructs would significantly predict future levels of one another. However, the analyses regarding these constructs’ ability to predict change in one another over the course of three months were considered more exploratory in nature; thus, no specific hypotheses were made.
possibility that social comparison and body surveillance would mediate the thin ideal internalization-body dissatisfaction relation using prospective data was also seen as more exploratory.
Finally, given the dearth of research examining the prospective relations between social comparison/body surveillance and disordered eating, we conducted exploratory analyses investigating this possibility. In particular, we determined if social comparison and body surveillance at T1 prospectively predicted disordered eating at T2 both without and with controlling for baseline levels of disordered eating. That is, we were interested in both whether social comparison and body surveillance predicted future levels of disordered eating and whether social comparison and body surveillance predicted change in disordered eating over the course of three months.
Hypothesis 2: The EMA data were used to examine momentary social comparison and body surveillance (i.e., engagement in these behaviors over the past several hours) and their relations to momentary body dissatisfaction (i.e., body dissatisfaction experienced over the past several hours). It was expected that momentary reports of social comparison and body
surveillance would be contemporaneously associated with momentary body dissatisfaction both within- and between-persons.
Preliminary Studies
A pilot study of aspects of the current study was conducted in 2010. Using a sample of 265 college women, we examined whether, in a cross-sectional design, general social
comparison and body surveillance mediated the relation between thin ideal internalization and body dissatisfaction. Using bootstrapping analyses, results indicated that the total indirect effect had a standardized point estimate of .18 (p < .001) and a 95% bias-corrected (BC) bootstrap confidence interval (CI) of .10 to .26. Thus, social comparison and body surveillance partially mediated the relation between thin ideal internalization and body dissatisfaction. The specific indirect effects of each mediator showed that body surveillance was a unique and significant mediator, with a standardized point estimate of .19 (p < .001) and a 95% BC CI of .10 to .27. However, general social comparison did not add significantly to the model, with a standardized point estimate of -.01 (p = .674) and a 95% BC CI of -.05 to .03. A contrast confirmed that the indirect effect of body surveillance in the thin ideal internalization-body dissatisfaction relation was significantly stronger (p < .001) than the indirect effect of general social comparison. Similar results emerged when utilizing a measure of appearance-related social comparison (see Fitzsimmons-Craft et al. (2012c) for more details).
However, we believe that that the general measure of social comparison used in this pilot study may have been too general and that the appearance-related social comparison measure may have been too narrow. For example, other social comparison domains, such as those related to eating and exercise, may stem from thin ideal internalization and lead to body image disturbance. Appearance-related social comparison certainly plays a role in the development of body
included to derive the most potent and comprehensive assessment of social comparison. Further, although likely related to the construct of appearance-related social comparison, eating and exercise comparisons focus on the actions associated with achieving the appearance-related goal gleaned from the body-related comparison (Fitzsimmons-Craft, Bardone-Cone, & Harney, 2012a). Based on such comparisons, a woman may conclude that she must behave differently in terms of eating and exercise if she is to achieve her ideal weight/shape. Thus, examining the roles of body, eating, and exercise comparisons may be important in terms of coming to a more comprehensive understanding of the ways in which social comparison behavior contributes to body dissatisfaction and disordered eating.
eating disorder symptomatology both concurrently and one year later (Fitzsimmons-Craft & Bardone-Cone, 2014; Fitzsimmons-Craft et al., 2012a). The final version of the measure is comprised of 18 items and three subscales, Body Comparison Orientation, Eating Comparison Orientation, and Exercise Comparison Orientation, and is provided in Appendix 1. Given prior research demonstrating the potential need to use a comprehensive measure of eating disorder-related social comparison when examining social comparison as a mediator of the thin ideal internalization-body dissatisfaction relation (i.e., Fitzsimmons-Craft et al., 2012c), we assessed body-, eating-, and exercise-related social comparisons in this study. We assessed individuals’ engagement in such behavior both in the EMA portion of the study and in the questionnaire batteries that were administered at T1 and T2.
In sum, the current project is significant because it addresses two clinically concerning behaviors (i.e., social comparison, body surveillance) in a vulnerable population (i.e., college women). By developing and testing an elaborated sociocultural model of disordered eating that incorporates these clinically concerning behaviors, this study has the potential to improve scientific knowledge in the body dissatisfaction and eating disorder fields and inform prevention programming for college women by identifying relevant, mutable behaviors that may play a role in body dissatisfaction/disordered eating development. By using both longitudinal and EMA methods, knowledge about social comparison and body surveillance across time, as well as on a more momentary level, is obtained in the context of an elaborated sociocultural model of
METHOD Participants and Procedure
Participants were 238 women attending a large, public Southeastern university.
Demographic information on these individuals at the first study assessment is provided in Table 1. Of note is this sample’s mean score on the Eating Attitudes Test-26 (EAT-26; Garner,
Olmsted, Bohr, & Garfinkel, 1982), which was 9.24 (SD = 7.30). The EAT-26 is a commonly
used measure of eating disorder attitudes and behaviors, and a score of 20 or more indicates a probable eating disorder (King, 1989, 1991). Thus, on average, this sample exhibited a level of disordered eating that was moderate and similar in magnitude to that observed in other studies of college women (e.g., Fitzsimmons-Craft et al., 2012a; Fitzsimmons-Craft, Harney, Brownstone, Higgins, and Bardone-Cone, 2012b).
Table 2 includes all the project activities, their timing, and the participating sample (i.e., Spring 2012 Semester participants, Fall 2012 Semester participants). A questionnaire battery was administered at baseline (beginning of semester, T1) and then again at the end of the semester (T2; about three months later), so as to complete data collection within a single semester and maximize retention. Informed consent was obtained at T1. Questionnaire completion occurred online in private locations of the participants’ choosing (e.g., their homes).
methodology is ideally suited to the current project given the emphasis on social comparison and body surveillance behaviors as they occur and the potential prevention and intervention
implications of this project. Research has indicated that reactivity is at most a minimal concern (generally, in EMA studies of social comparison, in EMA studies of body image, and in EMA studies that measure negative health behaviors – e.g., binge eating, alcohol use; Crosby et al., 2009; Heron & Smyth, 2013; Hufford, Shields, Shiffman, Paty, & Balabanis, 2002; Leahey et al., 2007; Stein & Corte, 2003), that participant burden is not excessive (Smyth et al., 2001; Wegner et al., 2002), and that collecting EMA data via personal computers is feasible in college students with good compliance rates (Zuckerman & O’Loughlin, 2006).
In the current project, participants provided data three times per day on thoughts, emotions, and behaviors from the period between the last and current signal. In particular, they completed surveys on a computer in the late morning, late afternoon, and before going to sleep. They were given time guidelines for filling out the surveys (i.e., late morning: 10:30 am-1:30 pm; late afternoon: 3:30 pm-6:30 pm; before going to sleep: 10:00 pm-1:00 am) and were also sent reminder emails with the survey link during each of these time periods on each day of the EMA data collection period. Additionally, all but one of the participants were sent reminder text messages for the first three days of the EMA period (i.e., this one participant opted out of receiving study-related text messages). These text messages reminded them to fill out a survey soon and to check their email for the survey link.
with a short manual containing information discussed, as well as the phone numbers and email addresses for myself and one of my research assistants (i.e., their assigned research assistant) for round-the-clock availability in case of any questions/problems recording data. Shiffman (2009) notes that participant-management procedures, such as training, feedback, and check-ins with participants contribute to high compliance, and thus, participants were contacted by their assigned research assistants at least 1x/week via phone and 2x/week via email to check in and address any problems. On each morning of the EMA period, we checked whether participants completed a bedtime report for the previous day and called and emailed those who failed to do so; we reminded them of the incentives for completing most of the EMA question sets and asked them to fill out the reports for that day.
Of note, we considered several EMA issues carefully. First, we considered using portable measurement devices (e.g., study-provided smartphones) instead of participants’ personal
computers. Although using such devices would provide an even more accurate study of thoughts, emotions, and behaviors in the natural environment (as these devices can be carried/used
frequently as is the case in some EMA work, reports on thoughts, emotions, and behaviors were much more frequent/less retrospective than is the case in many studies. We hope to conduct a similar study using more intensive EMA methods in the future. This study is viewed as a “jumping-off point” for future EMA work on social comparison and self-objectification.
Participants were provided with research credit in their introductory psychology courses for participating in this study. Each battery of questionnaires (T1 and T2) took about one hour to complete. Because the university’s psychology department offers one credit for one hour of research participation, participants received one credit for completing each questionnaire session (two credits total for the questionnaires). For their two weeks of EMA participation (with
question sets taking about five minutes, 3x/day for a total of 42 surveys), participants received 3.5 research credits if they filled out the short EMA question sets at least 30 times (credit was prorated if they responded less frequently). Of note, the university’s introductory psychology courses require students to obtain 5.5 credits of research participation – this study was advertised as one in which individuals were able to earn all of their credits within a single study.
Participants were also entered into a drawing for one of six $100 prizes if they completed both questionnaire sessions and at least 36 (85%) of the EMA question sets. Of note, incentives have been identified as important in boosting compliance in EMA studies (Shiffman, 2009). This study was reviewed and approved by the university’s Institutional Review Board.
completed only T1 were used for analyses involving only T1 data. Additionally, in an attempt to control for random responding and inattentiveness, a validity check item was included in both the T1 and T2 questionnaire batteries. These items asked participants to choose a specific response choice (i.e., Please choose “Disagree Strongly”); not responding appropriately to these items suggests possible random or inattentive responding. Of the 238 participants who completed T1, 12 “failed” the T1 validity check (5.1%), and of the 235 participants who completed T2, eight “failed” the T2 validity check (3.4%). Of the 235 participants who completed both T1 and T2, 16 “failed” either the T1 or T2 validity check or both validity checks (6.8%). For analyses involving T1 but not T2 data, we excluded all who failed the T1 validity check (resulting in n = 226), and for analyses involving T2 but not T1 data (e.g., obtaining alphas for measures at T2), we excluded all who failed the T2 validity check (resulting in n = 227). For analyses involving both T1 and T2 data, we excluded all who failed either validity check or both validity checks (resulting in n = 219). For analyses involving only the EMA data, we did not exclude
participants based on these validity checks. Although an incorrect validity check suggests that a participant may not have been paying close enough attention during a self-report questionnaire session, we do not believe that we can necessarily generalize a participant’s inattention to the EMA component of the study.
Measures at Time 1 (T1) and Time 2 (T2)
comprehensively assesses eating disorder-related social comparison behavior with three
subscales. For SEM analyses, these three subscales were used as indicators of an eating disorder-related social comparison behavior latent variable. Given that, to our knowledge, only one measure of body surveillance exists, this was the only measure of this construct that was administered, and the items that comprise this measure were used as indicators of a body surveillance latent variable in SEM analyses. In the case of pressure for thinness, we used only two measures to assess this construct given that we identified only two psychometrically-supported existing measures of this construct in the literature.
Demographics. Demographic data for age, parents’ highest levels of education, and race/ethnicity were collected at T1 via a set of questionnaires created for this study. Additionally, participants reported on their current weight and height at T1, and we used this information to compute body mass index (BMI), as we were interested in the ways in which BMI may relate to the study constructs. There is evidence that individuals are generally accurate with their self-reported weights (Shapiro & Anderson, 2003).
nervosa (Cronbach’s alphas from .83-.88; Stice & Agras, 1998; Stice et al., 1996). Further, research has indicated that this construct remains relatively stable over time (two-week test-retest reliability: r = .93; Stice & Agras, 1998; Stice et al., 1996). In the current study, alpha was .79 at T1.
We also used the Pressures subscale of the Sociocultural Attitudes Toward Appearance Questionnaire-4 (SATAQ-4; Schaefer et al., 2013) to assess pressure for thinness. This subscale of the SATAQ-4 assesses perceived pressure from family, peers, and the media to be thin/to strive for cultural ideals of beauty. The subscale consists of 12 items that are rated on a 1
(definitely disagree) to 5 (definitely agree) scale, and an example item is, “I’ve felt pressure from family members to look thinner.” Items are summed to create a total score. Schaefer et al. (2013) reported high internal consistency (Cronbach’s alphas = .85-.96) in a large sample of college women collected from four sites and demonstrated excellent construct validity (e.g., the
Pressures subscale correlated with a measure of eating disorder psychopathology). In the current study, alpha was .92 at T1.
Thin ideal internalization. The construct of thin ideal internalization was assessed using three measures. First, we used the Ideal-Body Stereotype Scale-Revised (IBSS-R; Stice & Agras, 1998; Stice et al., 1996), which assesses participants’ level of agreement with statements
concerning what attractive women look like. This measure consists of six items that are rated on a 1 (strongly disagree) to 5 (strongly agree) scale, and an example item is, “Slender women are more attractive.” Items are averaged to create a total score. Regarding convergent and
females and individuals with bulimia nervosa (Cronbach’s alphas from .89-.91; Stice & Agras, 1998; Stice et al., 1996). In the current study, alpha was .72 at T1.
Thin ideal internalization was also measured via the Internalization-Thin/Low Body Fat subscale of the SATAQ-4 (Schaefer et al., 2013), which assesses endorsement and acceptance of messages that espouse unrealistic ideals for female beauty and the striving toward such ideals. This subscale consists of five items that are rated on a 1 (definitely disagree) to 5 (definitely agree) scale, and an example item is, “I want my body to look very lean.” Items are summed to
create a total score. Evidence of good construct validity has been demonstrated (e.g., relatively high correlation with a measure of eating disorder pathology; Schaefer et al., 2013) and high internal consistency has been reported in a large sample of college women from four sites (alphas of .87-.92; Schaefer et al., 2013). In the current study, alpha was .83 at T1.
Social comparison. Social comparison behavior, including body, eating, and exercise social comparison tendencies, was assessed using the Body, Eating, and Exercise Comparison Orientation Measure (BEECOM; Fitzsimmons-Craft et al., 2012a). This measure consists of 18 items that are rated on 1 (never) to 7 (always) scale. Example items are, “I compare my body shape to that of my peers, “During meals, I compare what I am eating to what others are eating,” and “When I am exercising (e.g., at the gym, running outdoors), I pay attention to the length of time that those around me work out.” Items are summed to create subscale scores (i.e., Body Comparison Orientation, Eating Comparison Orientation, and Exercise Comparison Orientation) and the total score (i.e., eating disorder-related social comparison orientation). Evidence of construct validity is demonstrated by the subscales’ and total score’s significant positive correlations with general social comparison orientation (rs of .42-.58), eating disorder symptomatology (rs of .60-.70), and body dissatisfaction (rs of .61-.75) in a female college sample (Fitzsimmons-Craft et al., 2012a). Fitzsimmons-Craft and colleagues (2012a) found estimates of internal consistency for the subscale and total scores that ranged from .93 to .97. In the current study, alphas for the BEECOM total and subscale scores were all .91 or greater at both T1 and T2.
with how other people look”); in order to minimize issues related to construct overlap, this item was not included when computing the subscale score, so that all analyses were run using the 7-item version of the OBCS Body Surveillance score. Also of note, if more than two 7-items are missing on an OBCS subscale (with a “not applicable” response option being counted as
missing), then the score for that subscale is not computed (McKinley & Hyde, 1996). However, no study participants had more than two items missing on the Body Surveillance subscale at either T1 or T2. Construct validity in a sample of college women is demonstrated by high correlations with public self-consciousness (r = .73) and nonsignificant relations with private self-consciousness (McKinley & Hyde, 1996). McKinley and Hyde (1996) reported a coefficient alpha of .89 in a sample of student and nonstudent women. In the current study, alpha was .79 at T1 and .86 at T2 for the 7-item version of the OBCS Body Surveillance subscale.
reliability has indicated the measure’s stability (r = .88; Rosen et al., 1996). In the current study, alpha was .97 at T1 and .98 at T2.
Next, we measured body dissatisfaction via the Body Dissatisfaction subscale of the Eating Disorder Inventory (EDI-BD; Garner, Olmsted, & Polivy, 1983), which assesses the belief that specific parts of the body are too large (e.g., hips, thighs, buttocks). This measure consists of nine items that are rated on a six-point scale ranging from never to always, and an example item is, “I think that my stomach is too big.” Garner et al. (1983) originally
recommended that item responses never, rarely, and sometimes receive a score of 0, and the responses often, usually, and always receive scores of 1, 2, and 3 respectively; however, because this reduces the variability in responses in non-clinical samples, we coded these responses using the continuous six-point scale (see Tylka & Subich, 2004). Items are summed to create a total subscale score. Construct validity in samples of college women is demonstrated by the measure’s high correlations with body preoccupation (Tylka & Subich, 2004) and eating disordered
behavior (Spillane, Boerner, Anderson, & Smith, 2004). Reliability coefficients for college women range from .83 to .93 (Garner et al., 1983). In the current study, alpha was .91 at T1 and .92 at T2.
Finally, body dissatisfaction experienced over the past 28 days was assessed via the Weight Concern and Shape Concern subscales of the Eating Disorder
one underlying factor (Peterson et al., 2007). In particular, the 12 items that comprise these two subscales were rated on a 0 to 6 scale (with items either rated on a no days to everyday scale or a not at all to markedly scale), and an example item is, “How dissatisfied have you been with your
weight?” Items are averaged to create a total body dissatisfaction score. The Weight Concern and Shape Concern subscales have demonstrated good internal consistency (alphas of .89-.93; Luce & Crowther, 1999) and convergent validity (Fairburn & Beglin, 1994; Grilo, Masheb, & Wilson, 2001) among samples of college women and community and patient groups. In the current study, alpha for this combined subscale was .94 at both T1 and T2.
Disordered eating. We used several measures of disordered eating in order to capture various facets of this construct. First, we used the Bulimia Test-Revised (BULIT-R; Thelen, Farmer, Wonderlich, & Smith, 1991) to assess bulimic attitudes and behaviors. This measure consists of 36 items (with 28 items contributing to the BULIT-R score) that have a five-option multiple choice format. Construct coverage is broad, with items on binge eating, purging, and negative attitudes related to weight and shape. Items are summed to create a total score. The BULIT-R has well-established psychometric properties and has been successfully used to aid in the diagnosis of bulimia nervosa and in the measurement of bulimic symptom severity in clinical and nonclinical populations (Thelen et al., 1991; Williamson, Anderson, Jackman, & Jackson, 1995). In the current study, alpha was .93 at both T1 and T2.
We used the Restraint subscale of the EDE-Q (Fairburn & Beglin, 2008) to assess
create a total subscale score. The Restraint subscale has demonstrated good internal consistency (alphas of .84-.85; Luce & Crowther, 1999) and convergent validity (Fairburn & Beglin, 1994; Grilo et al., 2001) among samples of college women and community and patient groups. In the current study, alpha was .81 at T1 and .83 at T2.
Finally, the Eating Attitudes Test-26 (EAT-26; Garner et al., 1982) was used to assess eating disorder symptoms more generally. The EAT-26 is one of the most widely used
standardized measures of eating disorder attitudes and behaviors (Garner, 1993). This measure consists of 26 items that are rated on a 1 (never) to 6 (always) scale, and an example item is, “Avoid eating when I am hungry.” Items endorsed as 1, 2, or 3 are scored as “0,” while items marked as 4, 5, or 6, are scored as “1,” “2,” or “3,” respectively. Items are then summed to create a total score. Studies have found the EAT-26 to be effective as a screening measure, with a cutoff score of 20 indicating a probable eating disorder (King, 1989, 1991). Additionally, good internal consistency (α = .83-.90) and test-retest reliability (r = .84) have been demonstrated in samples of young women (Carter & Moss, 1984; Garner et al., 1982). In the current study, alpha was .81 at both T1 and T2.
Ecological Momentary Assessment (EMA) Measures
The questions that participants were asked to fill out 3x/day during the EMA period of the study are provided in Appendix 2. These questions were designed to tap into social
comparison and body surveillance behavior, their effects, and other components of the
to indicate the level of BODY comparison behavior you have engaged in since the last time you were signaled, where 0 = No Body Comparisons and 100 = Constantly Making Body
Comparisons,” was used to assess body-related social comparison. Similar questions assessing
level of eating- and exercise-related social comparison behavior were administered, as well. For body surveillance, we modified the Body Surveillance subscale of McKinley and Hyde’s (1996) OBCS to be more momentary, similar to the approach of Breines et al. (2008). As when we computed scores for the Body Surveillance subscale using the T1 and T2 data, in order to minimize issues related to construct overlap, the one comparison-related item (i.e., “I rarely compare how I look with how other people look”) was not included when computing the subscale score. All analyses using the EMA data were run using the 7-item version of the more momentary OBCS Body Surveillance subscale, with response options ranging from 1 = strongly disagree to 7 = strongly agree. Lastly, the question, “Please slide the bar to indicate how
dissatisfied with your WEIGHT you have been since the last time you were signaled, where 0 = Not at All Dissatisfied and 100 = Very Dissatisfied,” was used to assess weight dissatisfaction. A
similar question assessing level of shape dissatisfaction was administered, as well. The two items assessing levels of weight and shape dissatisfaction were averaged to create a measure of “body dissatisfaction.”
Analytic Strategy
Hypothesis 1: Examining the traditional versus the elaborated sociocultural model of disordered eating (cross-sectionally) and examining if social comparison and body surveillance
mediate the thin ideal internalization-body dissatisfaction relation both in the context of this
model (i.e., cross-sectionally) and in a separate prospective model. Exploring the prospective
data from T1 will be used to examine the traditional sociocultural model of disordered eating and the elaborated sociocultural model of disordered eating (i.e., including social comparison and body surveillance as mediators of the thin ideal internalization-body dissatisfaction relation). Because these two models are not nested, it will not be possible to test the difference in fit between them using a nested chi-square difference test (Widaman & Thompson, 2003). Instead, we will focus more on determining whether the total and specific indirect effects of thin ideal internalization on body dissatisfaction via social comparison and body surveillance are
significant in the context of the sociocultural model of disordered eating and on the size of the residual direct effect from thin ideal internalization to body dissatisfaction once these mediators are included in the model.
If the elaborated sociocultural model provides a good fit to the data and social comparison and body surveillance emerge as significant mediators of the thin ideal internalization-body dissatisfaction relation, we will examine if thin ideal internalization prospectively predicts social comparison and body surveillance and if social comparison and body surveillance prospectively predict body dissatisfaction both without and with controlling for baseline levels of the outcome variable. We will use latent variables and SEM for
investigating these possibilities and will use a similar strategy for investigating the prospective relations between social comparison/body surveillance and disordered eating, as well. If we determine that these constructs (i.e., thin ideal internalization, social comparison, body
surveillance, body dissatisfaction) significantly predict change in one another over time, we will then proceed with examining whether social comparison and body surveillance mediate the relation between thin ideal internalization and body dissatisfaction prospectively.
these researchers note, mediation models tested using longitudinal designs allow for more rigorous inferences about causal relations. Since our data come from two time points, “half-longitudinal” tests will be employed in this study (Cole & Maxwell, 2003). We will first estimate the paths in the regression of the T2 mediators onto T1 thin ideal internalization controlling for T1 mediator values (i.e., the a1 and a2 regression coefficients). Then we will estimate the paths in the regression of T2 body dissatisfaction onto the T1 mediators controlling for T1 levels of body dissatisfaction (i.e., the b1 and b2 regression coefficients). Estimates of the specific indirect effects can be calculated by means of multiplying together the a1 and b1 terms and the a2 and b2 terms. The total indirect effect associated with the two mediators can then be calculated using the formula a1b1 + a2b2, where the two terms represent the indirect effect of thin ideal internalization on body dissatisfaction through social comparison and the indirect effect of thin ideal
internalization on body dissatisfaction through body surveillance. Assuming that the conditions for stationarity (i.e., stable casual relationship between two variables over time; Kenny, 1979) are met, paths between the T1 mediators and T2 body dissatisfaction would be equal to the paths between T2 mediators and a hypothetical T3 body dissatisfaction. Under this assumption, the aibi product terms provide estimates of the mediational effect of thin ideal internalization on body dissatisfaction through social comparison and body surveillance. Mplus Version 6.1 (Muthén & Muthén, 2010) will be used to run the Hypothesis 1 analyses.
Cole and Maxwell (2003) purport that this approach is superior to the methods typically applied to “half-longitudinal designs” (e.g., testing the prospective relations between the
wave (Cole & Maxwell, 2003), we note that two limitations emerge. First, although we can test whether the mediators are partial mediators, we cannot test whether they completely mediate the relation between our independent and dependent variables. Second, the assumption of
stationarity may not hold; if this assumption is false, aibi estimates will likely be biased. Problematically, without at least three waves of data, the assumption of stationarity cannot be tested. Despite these limitations, Cole and Maxwell (2003) suggest that failing to control for prior levels of the dependent variables will likely lead to more problems than failing to take into account potential violations of stationarity.
Hypothesis 2: Examining if momentary reports of social comparison and body surveillance are contemporaneously associated with body dissatisfaction both within- and
between-persons. Multilevel modeling (MLM) will be used to examine the influences of (a)
effects) will be entered into the models. Of note, we will examine separate models of the effects
of body, eating, and exercise comparisons and body surveillance on body dissatisfaction, as well as a single model examining all of these effects (so that they can be pitted against one another). Analyses will be performed using SPSS Version 19.0.
Hypothesis 3: Examining if momentary instances of social comparison mediate the relation between trait thin ideal internalization and momentary body dissatisfaction. We will use
multilevel structural equation modeling (MSEM; Preacher, Zyphur, & Zhang, 2010) to examine this hypothesis. Upper-level mediation techniques will be used (Kenny, Kashy, & Bolger, 1998; Krull & MacKinnon, 1999); in particular, thin ideal internalization is conceptualized as a trait assessed at Level 2 (and comes from the T1 traditional self-report data), and social comparison, body surveillance, and body dissatisfaction are assessed in a more momentary fashion at Level 1. Of note, for this type of 2-1-1 mediation model, it is important to separate within- and between-person mediated effects (Zhang, Zyphur, & Preacher, 2009), and using MSEM, it is possible to do that. A benefit of using MSEM versus the MLM framework is that MSEM can overcome possible conflation or bias of the within- or between-person indirect effects (Preacher et al., 2010). Additionally, MSEM uses a robust maximum likelihood estimation method, which accommodates for missing data and unbalanced clusters (i.e., number of observations for each person; Preacher et al., 2010). Further, this method of estimation does not assume normality and generates robust estimates of asymptotic covariances of parameter estimates (Preacher et al., 2010).
We will also examine a lower-level mediation model (i.e., a 1-1-1 mediation model), in which we will investigate whether momentary instances of social comparison and body
body dissatisfaction. Of note, before examining such a model, it will be important to investigate the intraclass correlation (ICC) for our predictor, thin ideal internalization. Here, the ICC
RESULTS Descriptive Statistics
Data collection for this study occurred over the course of two semesters; 120 participants took part in the study during the Spring 2012 semester and 118 participants took part in the study during the Fall 2012 semester. Thus, EMA data collection occurred during two separate two-week periods at different points in the calendar year. In particular, the spring semester EMA data collection occurred from March 19-April 1, 2012 (just after the university’s spring break that year), and the fall semester EMA data collection occurred from September 24-October 7, 2012 (just before the university’s fall break that year). It is possible that these two separate two-week periods may have differed systematically in various ways – including in the weather occurring at those times. The weather across the two EMA periods was important to consider given that social comparison, body surveillance, and body dissatisfaction may be amped up (or down) for some individuals depending on the weather, the types of clothes others are wearing, etc.
However, to our knowledge, there have been no studies conducted that assess the effects of season and/or temperature on these constructs.
tested for group (i.e., spring semester versus fall semester participants) differences in average levels of thin ideal internalization, body-, eating- and exercise-related social comparison behavior, body surveillance, and body dissatisfaction reported during the EMA period. Results indicated that the groups did not differ in average levels of exercise-related social comparison behavior (spring semester: M = 9.01, SD = 18.27; fall semester: M = 9.44, SD = 18.37; t(8486) = -1.07, p = .284) or body surveillance (spring semester: M = 3.95, SD = 1.39; fall semester: M = 3.96, SD = 1.59; t(8644) = -.06, p = .953). However, groups did significantly differ in average levels thin ideal internalization (spring semester: M = 2.78, SD = 1.31; fall semester: M = 2.84, SD = 1.30; t(8758) = -2.33, p = .020), average levels of body-related social comparison behavior
(spring semester: M = 17.62, SD = 22.69; fall semester: M = 19.06, SD = 23.79; t(8552) = -2.86, p = .004), average levels of eating-related social comparison behavior (spring semester: M =
11.65, SD = 19.44; fall semester: M = 13.36, SD = 21.57; t(8462) = -3.85, p < .001), and average levels of body dissatisfaction (spring semester: M = 30.27, SD = 26.91; fall semester: M = 33.55, SD = 29.24; t(8387) = -5.36, p < .001). Given this, we were curious to know whether these
internalization, body-related social comparison, eating-related social comparison, and body dissatisfaction than the spring semester participants. Given this, all analyses that used the EMA data were re-run controlling for semester of participation. Patterns of significance remained the same whether or not this covariate was included in the model, and semester of participation was never a significant predictor of the outcome variable (i.e., body dissatisfaction experienced over the past several hours).2 As such, results without semester of participation as a covariate are presented for the sake of parsimony.
Hypothesis 1: Examining the Elaborated Sociocultural Model of Disordered Eating Some of the study participants had missing data for their T1 and/or T2 questionnaire assessments. Regarding the T1 and T2 study measures, missing data ranged from a low of 0% for the T1 and T2 OBCS Body Surveillance subscale scores to a high of 13.22% for the T2 EAT-26 scores. Further, no individual item at T1 or T2 had more than 2.2% of values missing. We ran two separate Little’s Missing Completely at Random analyses: one including the T1
measures/items that were to be to be used in analyses related to Hypothesis 1 and one including the T2 measures/items that were to be used in analyses related to Hypothesis 1. Both of these analyses were non-significant, T1: χ2(744) = 784.44, p = .148; T2: χ2(526)= 210.13, p = 1.00, indicating that the data for all of the study measures/items that were to be used in Hypothesis 1-related analyses were largely consistent with MCAR (missing completely at random). Overall, this information suggests that the amount and pattern of missingness should not be problematic.
measures/item exhibited kurtosis values greater than 10. Standardized skewness values greater than three may be problematic (Kline, 2005); eight measures/items exhibited values greater than three at both T1 and T2 and one measure (that was only used at T1) exhibited a value greater than three at T1. Given that tests of variances and covariances (e.g., SEM analyses) are affected by kurtosis more so than skew (DeCarlo, 1997; Jobson, 1991; Mardia, Kent, & Bibby, 1979) and the fact that in large samples (i.e., greater than 200), skewness cutoffs should not be applied because of the problem of small standard errors (Field, 2005), these measures/items were not transformed. Their kurtosis values were in the acceptable range and in examining their actual distributions, which Field (2005) recommends should be done in large samples, although skewed, their distributions appeared acceptable.
Table 3 contains means and standard deviations for the study variables at T1, and Table 4 contains correlations among the study variables at T1. Correlations were in the directions
We used maximum likelihood estimation to examine the traditional and elaborated versions of the sociocultural model of disordered eating cross-sectionally using latent variables. Goodness-of-fit was evaluated using the root mean square error of approximation (RMSEA), the standardized root-mean-square residual (SRMR), the comparative fit index (CFI), and the
Tucker-Lewis Index (TLI). Good model fit was defined by the following criteria: RMSEA values of about .08 or below (Browne & Cudeck, 1993), SRMR values less than about .08 (Hu &
Bentler, 1999), CFI values of about .95 or above (Bentler, 1990; Hu & Bentler, 1999), and TLI values above about .90 (Hu & Bentler, 1999). Multiple fit indices were used together because they provide a more conservative and reliable approach to the evaluation of model fit than the examination of a single index of fit.
test the traditional sociocultural model of disordered eating structural model. Correlations between the latent variables were all positive and significant (rs of .54-.86, all ps < .001), and factor loadings are included in Figure 2.
Next, we evaluated the traditional sociocultural model structural model. As with the measurement model, the structural model provided an acceptable fit to the data. The SRMR (.048), CFI (.951), and TLI (.933) all approximated good fit. However, the RMSEA (.093; 90% confidence interval: .074-.113) again indicated mediocre model fit (MacCallum et al., 1996). Considering that the other fit indices indicated good model fit, we concluded that the traditional sociocultural model structural model had an acceptable fit. All model paths were positive and significant and are presented in Figure 2. Results indicated that pressure for thinness accounted for 37.7% of the variance in thin ideal internalization. Pressure for thinness and thin ideal internalization accounted for 65.7% of the variance in body dissatisfaction. Lastly, body dissatisfaction accounted for 75.2% of the variance in disordered eating.
Elaborated sociocultural model of disordered eating. We next examined an elaborated sociocultural model of disordered eating that incorporated social comparison and body
surveillance as mediators of the thin ideal internalization-body dissatisfaction relation. We again first tested the measurement model before analyzing the structural model. The RMSEA (.068; 90% confidence interval: .058-.078), SRMR (.054), CFI (.935), and TLI (.921) all approximated good fit according to the aforementioned criteria. Further, all measures/items loaded significantly onto their respective latent factors. This information suggests that the latent factors were
adequately operationalized, and thus, this measurement model was used to examine the