Wang Xueying (Orcid ID: 0000-0002-6350-7998)
Mixture Drug-Count Response Model for the High Dimensional
Drug Combinatory Effect on Myopathy
Xueying Wang
ab*, Pengyue Zhang
b*, Chien-Wei Chiang
b,
Hengyi Wu
b, Li Shen
bg, Xia Ning
bh, Donglin Zeng
i, Lei Wang
abc,
Sara K. Quinney
bef, Weixing Feng
a, †and Lang Li
bcd, †a
Institute of Intelligent System and Bioinformatics, College of Automation, Harbin Engineering University, NO.145-1, Nantong Street, Nangang District, Harbin, 150001, Heilongjiang, China.
b
Center for Computational Biology and Bioinformatics, School of Medicine, Indiana University, 410 W. 10th St., Suite 5000, Indianapolis, IN, 46202, USA.
c
Department of Medical and Molecular Genetics, School of Medicine, Indiana University, 975 West Walnut Street, Medical Research and Library Building, IB 130, Indianapolis, 46202, IN,
USA.
d
Indiana Institute of Personalized Medicine, School of Medicine, Indiana University, Research Institute (R2), Room 402, 950 West Walnut Street, Indianapolis, 46202, IN, USA.
e
Department of Obstetrics and Gynecology, School of Medicine, Indiana University, 550 University Blvd, Indianapolis, 46202, IN, USA.
f
Division of Clinical Pharmacology, School of Medicine, Indiana University, Research Institute (R2), Room 402, 950 West Walnut Street, Indianapolis, 46202, IN, USA.
g
Department of Radiology, School of Medicine, Indiana University, 355 W. 16th Street, Suite 4100, Room 4099, Indianapolis, 46202, IN, USA.
h
Computer & Information Science, IUPUI, 723 W Michigan St, SL 265 Indianapolis, IN, 46202, USA.
i
* Wang X and Zhang P have the equal contribution to this paper.
†
To whom correspondence should be addressed: [email protected] and [email protected]
Abstract
Drug-drug interactions (DDIs) are a common cause of adverse drug events (ADEs). The electronic medical record (EMR) database and the FDA's Adverse Event Reporting System (FAERS) database are the major data sources for mining and testing the ADE associated DDI signals. Most DDI data mining methods focus on pair-wise drug interactions, and methods to detect high-dimensional DDIs in medical databases are lacking. In this paper, we propose two novel mixture drug-count response models for detecting high dimensional drug combinations that induce myopathy. The “count” indicates the number of drugs in a combination. One model is called fixed probability mixture drug-count response model with a maximum risk threshold (FMDRM-MRT). The other model is called count-dependent probability mixture drug-count response model with a maximum risk threshold (CMDRM-MRT), in which the mixture probability is count-dependent. Compared to the previous mixture drug-count response model (MDRM) developed by our group, these two new models show a better likelihood in detecting high dimensional drug combinatory effects on myopathy. CMDRM-MRT identified and
models’ parameters and local false discovery rate estimates are evaluated through statistical simulation studies.
Key words: Drug-count response model, Electronic medical record, FDA's Adverse Event Reporting System, High dimensional drug interactions, and Myopathy.
1. Introduction
Adverse drug events (ADEs) are a significant cause of morbidity and mortality. ADEs lead to 125,000 hospital admissions each year; prolong hospital stays by nearly 1.7 to 4.6 days [1]; and result in as many as 4.6% of deaths in the United States [2]. It has been reported that 26% to 59.1% of ADEs are related to DDIs [3-5]. DDIs occur due to pharmacokinetic or
pharmacodynamic interactions between co-administrated drugs. The risk of DDI-induced ADEs increases exponentially with the number of drugs taken by a patient [6]. A study from National Center for Health statistics (NCHS) showed that the number of patients taking more than 3 drugs and 5 drugs has increased 1.8- and 2.5-fold in the past decade, respectively [7]. Therefore, the evaluation of DDIs’ clinical impact, especially for high dimensional drug interactions, is an important issue. Some pre-marketing clinical trials focus on two-way drug interactions and often are limited to specific populations, in which adverse drug events are usually not primary
rely on pharmaco-epidemiology studies on large-scale health record databases to investigate drug interactions [8]. The spontaneous reporting system (SRS) and the electronic medical record (EMR) are two major types of health record data sources for post-marketing pharmacovigilance [9-12]. Recently, as these big health record data sets become increasingly available to the general research community, novel data mining algorithms have shown promise in detecting potential drug- or DDI-induced ADEs [13-15].
error and false discovery rate (FDR) while retaining good power and sensitive for identifying signals. Thakrar et al. [24] proposed multiplicative and additive models to detect DDIs in the FDA’s Adverse Event Reporting System (FAERS) database. These two model assumptions characterize the relationship between the relative risk of the two-drug combination and the relative risk from two single drugs. In the DDI detecting algorithm outlined by Tatonetti et al. [25], they considered and adjusted the confounding variables by using propensity score derived from logistic regression analysis. Harpaz et al. [26] applied an association rule mining (ARM) to detect the multi-item ADE associations in the FAERS. In order to overcome the computational challenge of the ARM, Xiang et al. [27] proposed a Frequent Closed Item set Mining and filtering (filter) based on UMLS mapping for mining multiple drug interactions; and FCI-filter has been applied to FAERS data as well.
Data mining methods to detect the single drug and two-drug DDI induced ADEs cannot be easily expanded to evaluate high-dimensional drug interactions. In our FAERS and EMR database, the report frequency for most of 5-way to 6- way drug combinations is no more than 20.Although ARM and FCI-filter methods have the advantage of handling high-dimensional drug and ADE combinations freely, they are indeed constructed and limited to ADE cases only drugs/ADEs combinations. These structural limited methods cannot easily be expanded to handle drug combinations whose ADE frequencies are moderate or low.
combination, and in which the same dimensionality of drug combinations shared the same ADE risk model. In this risk model, the same dimensionality of drug combinations either share the baseline risk that doesn’t depend on the dimensionality of combination drugs, or follows a drug-count response model that depends on the dimensionality of combination drugs. This model allows high-dimensional drug combinations share their ADE risks, such that they can borrow data strength from each other and make up the small sample size deficiency. Using the empirical Bayes mixture model framework, this model will give each drug combination a probability of belonging to a constant risk model, and a probability of following the drug-count response model. This drug combination specific probability allows us to evaluate, interpret and rank the high dimensional drug interaction evidence from the data. This probability also has a local discovery rate interpretation. Using the EMR data, we successfully identified 2- to 6-way drug combinations that increased myopathy risk at a low local false discovery rate [28]. However, while this model is highly powerful in detecting high dimensional drug interactions, it possesses intrinsic deficiencies and needs further improvement. Statistically, the baseline model and drug-count response model do not meet continuity when the number of drug equals to one. Also, the mixture probability (i.e. the proportion of drug combinations belonging to the drug-count response model) is fixed and assumed to be the same regardless of the number of drug
validated. In this paper, our novel mixture drug-count response models address these statistical and pharmacology challenges. In order to identify which drug combination follows the drug-count response model or constant risk model, we use both EMR and FAERS datasets to derive their drug-count response models, and evaluate and validate top myopathy associated high-dimensional drug interactions.
2. Methods
2.1 Data Sources
The data sources used in this analysis are the FDA’s Adverse Event Reporting System (FAERS) and the Indiana Network of Patient Care data, which is an Electronic Medical Record (EMR) database.
2.1.1 FAERS Data Set
FAERS contains spontaneous adverse drug event reports from healthcare professionals,
frequency greater than 1000 were manually checked and mapped. After data clean-up, the FAERS dataset contained 4,280,322 reports with 1,753 generic drug names and 15,445 MedDRA PT ADE names.
2.1.2 Indiana Network of Patient Care Data Set
Indiana Network for Patient Care (INPC) is a local health information infrastructure that has been approved as exempt research by institutional review board (IRB) [30]. A subset of INPC called Common Data Model (CDM) are de-identified and extracted. This data set contains coded prescription medications, diagnoses, and lab tests for 2.2 million patients between 2004 and 2009. The CDM data have been processed with the Observational Medical Outcomes Partnership Common Data Model [31].
2.2 Case and Control Definitions
2.2.1 Myopathy Case and Control Definitions in FAERS
From 4,280,322 reports in the FAERS dataset, we defined myopathy “cases” as those reports listing myositis, myoglobinuria, muscle fatigue, muscle spasms, myalgia, muscle injury,
muscular weakness, polymyositis and rhabdomyolysis (Table S1). All other reports that do not contain these ADEs are defined as controls. Based on this definition, we identified 140,071 cases and 4,140,251 controls in the FAERS database.
The myopathy cases (Table S1) in the INPC are similar to the myopathy cases defined in the FAERS.
For the EMR database, we defined two types of myopathy events: 1) the first event of myopathy that occurs more than 6 months after the start of the database (01/01/2004), and 2) any additional myopathy event(s) that occur(s) more than 6 months after the previous myopathy event. In another word, for patients with multiple myopathy events, a 6-month myopathy free window was used for selecting any additional myopathy event(s).
Patients who experienced a myopathy event are considered cases. For each case, a drug exposure window is set as 1 month prior to the index event, and the drug(s) prescribed during this time period are classified as being associated with myopathy. For the control group, we randomly selected 50 patients who did not experience a myopathy event during the same time interval as the case. Drugs prescribed to these patients during the one month period before the index date are classified as not being associated with myopathy [32, 33].
2.3 Drug and Drug Combination Selections
For the 20 drugs, we selected all their possible 2-way to 6-way drug combinations in EMR and FAERS resulting in 60,460 possible drug combinations. To avoid false positive signals, both the FAERS and EMR datasets were filtered so that only those drug combinations with a total report number (case number plus control number) greater than 4 (𝑛ij > 4) were evaluated. This filtering
step reduced the number of drug combinations in the EMR to 20,161 and FAERS to 31,476 combinations (Figure S1).
2.4 Mixture Drug-Count Response Models
2.4.1. Previously Defined Drug-Count Response Model
Our group has previously described a mixture drug-count response model (MDRM) [28] for identifying myopathy induced by high-dimensional drug interactions. In this model, “count” indicates the number of drug combinations. The primary novelty of this model was a mixture of two model components: one component represents a constant myopathy risk regardless of the dimensionality of drug combinations while the other component characterizes an increasing drug-count response relationship between the dimensionality of drug combinations and the myopathy risk.
In the mixture drug-count response model, i indicates the number of drugs for i-way drug combinations; j is the jth i-way drug combinations; 𝑁𝑖𝑗 is the total number of patients taking jth
i-way drug combination; and 𝑌𝑖𝑗 is the number of cases among those 𝑁𝑖𝑗 patients. Additionally,
response model, 𝑍𝑖𝑗 equals to 1; otherwise 𝑍𝑖𝑗 equals to 0 when 𝑌𝑖𝑗 follows the constant model.
The joint distribution of �𝑌𝑖𝑗,𝑍𝑖𝑗� is
P�𝑦𝑖𝑗,𝑧𝑖𝑗�=�(1− 𝜋 ) × Bin�𝑛𝑖𝑗,𝑦𝑖𝑗,𝑞0��1−𝑧𝑖𝑗×�π× Bin�𝑛𝑖𝑗,𝑦𝑖𝑗,𝑞1��𝑧𝑖𝑗. (1)
Where 𝜋 is the proportion of drug combinations that follow the drug-count response component;
𝑞0 =1+expexp (𝛽 (0𝛽)0) represents the constant ADE risk; and 𝑞1 =1+expexp (𝛽 (0𝛽+𝛽0+𝛽1𝑖1)𝑖) represents the
drug-count response ADE risk. Then, the marginal distribution of 𝑌𝑖𝑗 can be written as a
two-component mixture distribution (2):
𝑃(𝑦𝑖𝑗) = (1− 𝜋 )Bin�𝑛𝑖𝑗,𝑦𝑖𝑗,𝑞0�+𝜋 Bin�𝑛𝑖𝑗,𝑦𝑖𝑗,𝑞1�. (2)
2.4.2 Novel Mixture Drug-Count Response Models
Here, we propose two novel drug-count response models to identify the myopathy risk induced by high-dimensional drug combinations: a fixed probability mixture drug-count response model with a maximum risk threshold (FMDRM-MRT) model, and a count-dependent probability mixture drug-count response model with a maximum risk threshold (CMDRM-MRT) model. As in our previous model, “count” indicates the number of drug combinations.
Fixed Probability Mixture Drug-Count Response Model with a Maximum Risk Threshold
In the FMDRM-MRT, the definitions of i (1<i<6) and j; the random variables 𝑁𝑖𝑗, 𝑌𝑖𝑗 and 𝑍𝑖𝑗;
and the parameter𝜋 are the same as in the MDRM. We also assume that the marginal
distribution function of 𝑌𝑖𝑗 follows a two-component mixture distribution (same as equation 1).
However, in the FMDRM-MRT model 𝑞0 and 𝑞1 are defined as: 𝑞0 = exp (𝛽0)
1+exp (𝛽0)×𝑐 and
𝑞1 =1+expexp (𝛽 (𝛽0+𝛽0+𝛽1(1𝑖−1(𝑖−1))))×𝑐,𝑐 ∈ (0,1).
The FMDRM-MRT has two noticeable differences from the MDRM. First, the 𝛽1(𝑖 −1) is revised on the 𝛽1𝑖 in the MDRM, when i = 1, 𝑞0and 𝑞1 are equal. This follows a continuity assumption. Second the maximum ADE risk of FMDRM-MRT is bounded by c, while the maximum risk of MDRM is 1.
Under FMDRM-MRT, the joint distribution function of �𝑌𝑖𝑗,𝑍𝑖𝑗� can be written as
𝑃(𝑦𝑖𝑗,𝑧𝑖𝑗) =�(1− 𝜋 )𝐵𝑖𝑛 �𝑛𝑖𝑗,𝑦𝑖𝑗,𝑒𝑥𝑝1+𝑒𝑥𝑝(𝛽0()×𝛽0𝑐)�� 1−𝑧𝑖𝑗
×�𝜋𝐵𝑖𝑛 �𝑛𝑖𝑗,𝑦𝑖𝑗,1+𝑒𝑥𝑝�𝛽𝑒𝑥𝑝[𝛽0+𝛽0+𝛽1(𝑖−11(𝑖−1)]×)𝑐��� 𝑧𝑖𝑗
. (3)
The marginal distribution function of 𝑌𝑖𝑗 is
𝑃(𝑦𝑖𝑗) = (1− 𝜋 )Bin�𝑛𝑖𝑗,𝑦𝑖𝑗,1+expexp(𝛽0 ()×𝛽0c)�+𝜋 Bin�𝑛𝑖𝑗,𝑦𝑖𝑗,1+expexp [𝛽0 (+𝛽𝛽0+𝛽1(𝑖−11(𝑖−1)]×))c�. (4)
𝑙𝑓�𝒏
𝒊𝒋,𝒚𝒊𝒋;𝜽�=∑ ∑𝑖 𝑗log P(𝑦𝑖𝑗) , 𝜽= (𝜋 ,𝛽0,𝛽1,𝑐). (5)
Count-dependent Probability Mixture Drug-Count Response Model with a Maximum Risk
Threshold (CMDRM-MRT)
In this model, we assume that the proportion of drug combinations following the drug-count response model will depend on the dimensionality of drug combinations. Therefore, the joint
distribution function of �𝑌𝑖𝑗,𝑍𝑖𝑗� changes to (6).
𝑃(𝑦𝑖𝑗,𝑧𝑖𝑗) =�(1− 𝜋𝑖 )𝐵𝑖𝑛 �𝑛𝑖𝑗,𝑦𝑖𝑗,𝑒𝑥𝑝1+𝑒𝑥𝑝(𝛽0()×𝛽0𝑐)�� 1−𝑧𝑖𝑗
×�𝜋𝑖𝐵𝑖𝑛 �𝑛𝑖𝑗,𝑦𝑖𝑗,1+𝑒𝑥𝑝�𝛽𝑒𝑥𝑝[𝛽0+𝛽0+𝛽1(𝑖−11(𝑖−1)]×)𝑐��� 𝑧𝑖𝑗
. (6)
where 𝜋𝑖 (𝑖 = 1,2, … , 6 and 0 <𝜋𝑖 < 1) is the proportion of i-way drug combinations that follow the drug-count response component. The marginal distribution function for (6) is
𝑃(𝑦𝑖𝑗) = (1− 𝜋𝑖 )Bin�𝑛𝑖𝑗,𝑦𝑖𝑗,1+expexp(𝛽0 ()×𝛽0c)�+𝜋𝑖 Bin�𝑛𝑖𝑗,𝑦𝑖𝑗,1+expexp [𝛽0 (+𝛽𝛽0+𝛽1(𝑖−11(𝑖−1)]×))c�. (7)
The log-likelihood function for (7) can be written as
𝑙𝑐�𝒏
𝒊𝒋,𝒚𝒊𝒋;𝜽�=∑ ∑𝑖 𝑗log P(𝑦𝑖𝑗) , 𝜽= (𝜋1, … ,𝜋6 ,𝛽0,𝛽1,𝑐). (8)
As 𝑍𝑖𝑗 is not observed, the maximum likelihood estimators (MLEs) of parameters in equations
(3) and (6) can be obtained through an expectation-maximization (EM) algorithm. Hence, we
define 𝑙�𝒏𝒊𝒋,𝒚𝒊𝒋,𝒛𝒊𝒋;𝜽� =∑ ∑𝑖 𝑗log P�𝑦𝑖𝑗,𝑧𝑖𝑗� as the log-likelihood for equations (3) and (6). The EM algorithm is an iterative method and after the 𝑡th iteration, 𝜽𝒕 is the estimator of 𝜽. First,
in the E-step, 𝑄�𝒏𝒊𝒋,𝒚𝒊𝒋,𝒘𝒊𝒋;𝜽�=𝐸𝒁|𝒀�𝑙�𝒏𝒊𝒋,𝒚𝒊𝒋,𝒛𝒊𝒋;𝜽�|𝒚𝒊𝒋,𝜽𝒕� is computed, and 𝑤𝑖𝑗 is the estimator of 𝑍𝑖𝑗.
For CMDRM-MRT, the 𝑤𝑖𝑗 can be written as
𝑤𝑖𝑗=𝐸�𝑧𝑖𝑗|𝑦𝑖𝑗,𝜽�=
πBin�𝑛𝑖𝑗,𝑦𝑖𝑗,1+expexp [𝛽0+𝛽1 (𝛽0+𝛽1(𝑖−1(𝑖−1)]×))c�
(1−π )Bin�𝑛𝑖𝑗,𝑦𝑖𝑗,1+expexp(𝛽0 (𝛽0)×c)�+πBin�𝑛𝑖𝑗,𝑦𝑖𝑗,1+expexp [𝛽0+𝛽1 (𝛽0+𝛽1(𝑖−1(𝑖−1)]×))c�
. (9)
Correspondingly, for DMDRM-MRT 𝑤𝑖𝑗 is
𝑤𝑖𝑗 =𝐸�𝑧𝑖𝑗|𝑦𝑖𝑗,𝜽�=
𝜋𝑖Bin�𝑛𝑖𝑗,𝑦𝑖𝑗,1+expexp [𝛽0+𝛽1 (𝛽0+𝛽1(𝑖−1(𝑖−1)]×))c�
(1−𝜋𝑖 )Bin�𝑛𝑖𝑗,𝑦𝑖𝑗,1+expexp(𝛽0 (𝛽0)×c)�+𝜋𝑖Bin�𝑛𝑖𝑗,𝑦𝑖𝑗,1+expexp [𝛽0+𝛽1 (𝛽0+𝛽1(𝑖−1(𝑖−1)]×))c�
. (10)
Second, we find𝜽𝒕+𝟏in the M-step, where 𝜽𝒕+𝟏 = arg max𝛳𝑄�𝒏𝒊𝒋,𝒚𝒊𝒋,𝒘𝒊𝒋;𝜽�.
2.6 Local False Discovery Rate
The local false discovery rate (lfdr) was introduced by Efron et al. [36] for analyzing data from microarray experiments, and was defined as the posterior probability of a gene’s expression belonging to “null distribution” [37]. In both FMDRM-MRT and CMDRM-MRT, drug combinations have either a constant myopathy risk (“null distribution”) or a drug-count response risk. Thus, both models follow the same model framework of Efron et al. [37]. The lfdrs for FMDRM-MRT and CMDRM-MRT are defined in (11) and (12), respectively:
𝑙𝑓𝑑𝑟�𝑦𝑖𝑗�=(1−𝜋)𝐵𝑖𝑛�𝑛(1−𝜋𝑖𝑗,𝑦)Bin�𝑛𝑖𝑗,𝑞0�+𝜋𝐵𝑖𝑛�𝑛𝑖𝑗,𝑦𝑖𝑗,𝑞0�𝑖𝑗,𝑦𝑖𝑗,𝑞1�. (11)
𝑙𝑓𝑑𝑟�𝑦𝑖𝑗�=(1−𝜋𝑖)Bin�𝑛(1−𝜋𝑖𝑗,𝑦𝑖)𝑖𝑗Bin�𝑛,𝑞0�+𝜋𝑖𝑗,𝑦𝑖Bin�𝑛𝑖𝑗,𝑞0�𝑖𝑗,𝑦𝑖𝑗,𝑞1�. (12)
lfdrs in (11) and (12) represent the posterior probabilities that a drug combination has a constant myopathy risk; i.e. lfdr represents the odds that myopathy risk will be constant as the dimensionality of drug combination increases.
2.7 Likelihood Ratio Test
considered the null model, and the CMDRM-MRT be the alternative model. The likelihood ratio can then be defined as
Λ=𝑙𝑓�𝑛𝑖𝑗,𝑦𝑖𝑗;𝜃�
𝑙𝑐�𝑛𝑖𝑗,𝑦𝑖𝑗;𝜃�. (13)
According to Wilks’ theorem [38], the test statistic −2log (Λ) can be assumed to follow a chi-squared distribution. Our model has 4 degrees of freedom.
−2 log(Λ) ~𝜒2(4) (14)
2.8 Simulation Study
To evaluate the performance of our models, a simulation study was conducted to assess local false discovery rate estimates. In the simulation, 𝜆𝑖 is the mean of 𝑁𝑖𝑗 in i-way drug
combinations, and 𝑘𝑖 is the number of i-way drug combinations in the simulation. 𝑁𝑖𝑗 is the
number of patients taking the jth i-way drug combinations and it follows a Poisson distribution with the mean equals to 𝜆𝑖.𝑌𝑖𝑗 is the number of drug combinations with myopathy cases in 𝑁𝑖𝑗.
distribution with size 𝑁𝑖𝑗 and probability equal to 𝑞0 or 𝑞1, it depends on the value of 𝑍𝑖𝑗, either
follows the drug-count response myopathy risk or the constant myopathy risk.
In order to assess the consistency of the lfdr estimate, we calculate the model based 𝑙𝑓𝑑𝑟�𝑖𝑗
estimate and the empirical 𝑙𝑓𝑑𝑟𝑖𝑗 estimate in the simulation study. The simulation data
�𝑛𝑖𝑗,𝑦𝑖𝑗 ,𝑧𝑖𝑗,𝑙𝑓𝑑𝑟�𝑖𝑗�, are divided into 100 intervals according to the value of 𝑛𝑖𝑗 and 𝑦𝑖𝑗/𝑛𝑖𝑗. In
each interval, we calculate the model based lfdr which is defined as the mean of 𝑙𝑓𝑑𝑟�𝑖𝑗𝑠 and the
empirical lfdr which is the proportion of𝑧𝑖𝑗 = 0.
3. Results
3.1 Model Performance Comparisons among CMDRM-MRT, FMDRM-MRT and MDRM
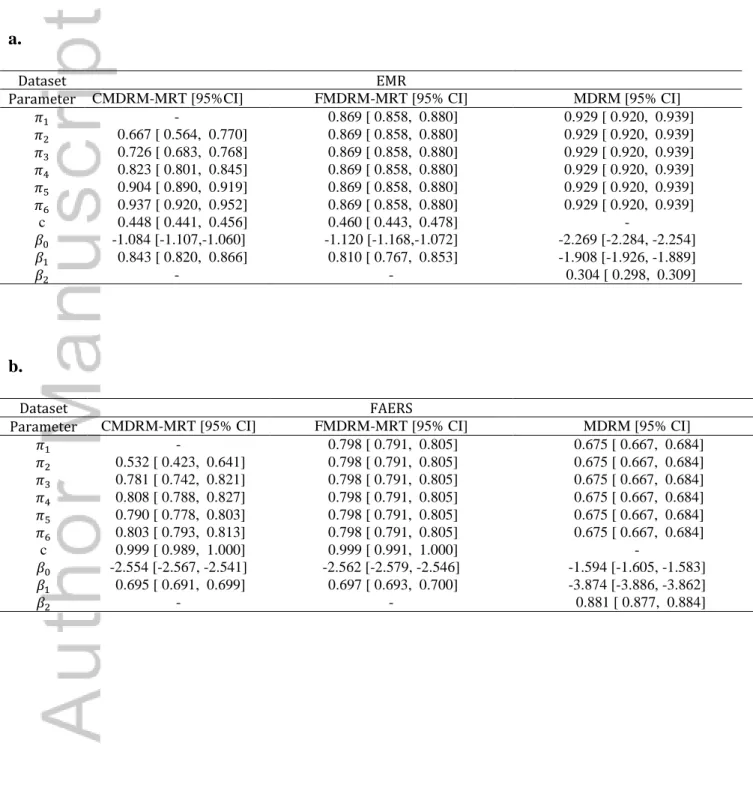
All three models are fitted to the EMR dataset and FAERS dataset. Their parameter estimates are shown in Table I. In fitting the EMR data, CMDRM-MRT shows an increasing trend of
probability, i.e. from 𝜋1 to 𝜋6, (0.50, 0.67, 0.73, 0.82, 0.90, 0.94) respectively, that drug combinations follow drug-count response model (Figure 1). The likelihood ratio test between
CMDRM-MRT to FMDRM-MRT has a p-value of 8.3 × 10⁻³⁵, suggesting that CMDRM-MRT fit the data better than FMDRM-MRT. This is a piece of strong evidence that the mixture
MDRM allows a discontinuous drug-count response model and the constant risk model for the single drug, and drug-count response model has a higher myopathy risk than the constant risk model (Figure 3).
In fitting the FAERS data, CMDRM-MRT also shows an increasing trend of probability of drug-count response model when the drug combination goes from 1 to 3, i.e. (0.50, 0.53, 0.78)
respectively, and this probability stabilizes around 0.80 when the drug combination goes from 4 to 6 (Figure 1). The likelihood ratio test between CMDRM-MRT to FMDRM-MRT has a p-value of 1.9 × 10⁻⁶, suggesting that CMDRM-MRT fits the data better than FMDRM-MRT does. The mixture probability of drug-count response model thus appears drug-count dependent in FAERS. Comparing CMDRM-MRT to FMDRM-MRT, both models show the same
maximum myopathy risk, 0.999 (Table I, Figure 1 and 2). However, MDRM shows lower mixture probability of drug-count response model than the other models. Because the MDRM allows a discontinuous drug-count response model and the constant risk model for the single drug, the drug-count response model has a lower myopathy risk than the constant risk model.
(Figure 3).
Comparing CMDRM-MRT’s fitting and performance between FAERS and EMR data sets (Figure 1), FAERS’s drug-count response model shows a much steeper increase of myopathy risk than EMR’s drug-count response model does. FAERS has a much higher maximum
EMR and FAERS have the similar increasing trend of mixture probability of drug count response model.
3.2 Common Myopathy Associated Drug Combinations Identified from EMR and FAERS
Data Sets
Using an lfdr threshold of 0.00001, significant drug combinations are selected from both EMR and FAERS data sets. Figure 4 displays the overlapped drug combinations with lfdr<0.00001 (red dots) and lfdr>0.00001 (black dots) between two data sets. CMDRM-MRT and FMDRM-MRT have very similar pattern, while MDRM shows different trend. As shown in Figure 5, MDRM identifies more two-way drug combinations than the other two models, but fewer high-dimensional drug combinations (3-way to 5-way). This is mainly because of the mis-specified discontinuity assumption between drug-count response model and constant risk model in the MDRM.
3.3 Common Myopathy Associated 6-Way Drug Combinations
myopathy risk in the SIDER database [34]. Of note, three of these 6-way combinations include simvastatin or atorvastatin and drugs known to inhibit their metabolism. These combinations can lead to increased exposure of the statin drugs, which are commonly known to cause myopathy. Considering the baseline risk estimated from the constant risk model in CMDRM-MRT, these 6-way drug combinations have 3.45- to 10.85-fold increase in myopathy risk.
3.4 Assess lfdr Estimate through A Simulation Study
The CMDRM-MRT was further evaluated in a simulation study. Parameter values were selected using estimates from the FAERS data analysis. In the simulation, 15 drugs were used to generate the drug combinations, resulting in 105 2-way combinations; 455 3-way combinations; 1,365 4-way combinations; 3,003 5-4-way combinations, and 5,005 6-4-way combinations. 500 simulated data sets were generated. Each time, the EM algorithm was used to estimate the parameters in the CMDRM-MRT. Table III presents the model-based estimates, their SDs, 95% CI, SD/estimates and relative biases. The relative biases of these estimates ranged from 0 to 1%. The SDs
estimated from the simulations are also very small compared to the estimates, suggesting a high confidence on these parameter estimates. Figure 6 further demonstrates the consistency of the model based lfdr estimate (y-axis) and empirical lfdr estimate (x-axis) estimated from the simulation data.
In this article, we propose two novel mixture drug-count response models, FMDRM-MRT and CMDRM-MRT to characterize relationship between the counts of drug combinations and the myopathy risks. Unlike MDRM [28], these two models speculate the maximum myopathy risk as one model parameter, and allow drug-count response model and constant risk model share the same myopathy risk when drug count is 1. In addition, CMDRM-MRT further allows the mixture probability to be drug count dependent. Using EMR and FAERS datasets, we demonstrate that CMDRM-MRT fits data better than FMDRM-MRT, p =8.3 × 10⁻³⁵ and 1.9 × 10⁻⁶, respectively. Interestedly, both CMDRM-MRT and FMDRM-MRT suggest that
maximum myopathy risk reaches to 0.999 in FAERS and 0.45 in EMR when the drug counts in drug combinations goes high. This difference of maximum myopathy risk between two databases make sense, because FAERS is designed to capture the adverse drug events, while EMR keeps tracks all the medical info for patients. Nevertheless, these maximum myopathy risk estimates are strikingly high, comparing to the background myopathy risk estimated from the constant risk model (𝑞0), which are 0.11 and 0.07 in EMR and FAERS, respectively.
Due to the accuracy of the high dimensional drug interactions that detected by our models can be improved by combining the FAERS database and EMR database [39], all the myopathy
only ondansetron does not have myopathy side effect in SIDER database [34]. It should also be noted that a number of the drugs identified in our six-way drug combinations may also be used to treat pain associated with myopathy (e.g. acetaminophen, hydrocodone, oxycodone, tramadol). Since the FAERS database does not distinguish between drugs taken prior to the diagnosis of myopathy and those taken after the diagnosis of myopathy, we do not know whether these drugs lead to the myopathy event or if they were given as treatment for the event. However, the EMR database is capable of separating drugs prescribed before the myopathy event from those administered as treatment for myopathy. As this data set also supports the correlation between pain relievers and myopathy, the co-administration of these drugs is likely to be associated with increased risk of myopathy. Considering their 6-way drug interaction induced myopathy risk ranging from 0.38 to 0.76 in two databases, it is essential to recognize that these risks are 3.45 to 10.85 fold higher than the background risk. Therefore, for the first time, in population level (i.e. considering all the drug combinations) and individual level (i.e. drug combination specific), our newly proposed drug-count response models characterize and select the high dimensional drug interactions and estimate their myopathy risks. Our follow-up simulation studies further show the consistency of parameters and lfdr estimates.
right now can not apply our models to all 1000 plus drugs in EMR and FAERS databases. Another interesting issue is that some patients take extreme high number of co-medications. For examples, we have observed patients who took >90 drugs in the FAERS database. Each of these patients will contribution a great number of drug combinations, and the usage of this patient data will be tremendously out-weight some drug combinations that are only taken by a few patients. This issue needs to be further addressed more carefully and systemically in the future.
Acknowledgements
This work has been supported by several NIH grants, DK102694, GM10448301-A1,
R01GM117206, and R01LM011945; and NSF grant, NSF1622526. It has also been supported by China Scholarship Council; China National Natural Science Foundation (grant / award number: 61403092, 61471139); HEU Fundamental Research Funds for the Central University
(HEUCF160420); National Science Foundation of Heilongjiang (QC2016086).
Reference
1. US. Department of Health and Human Services, Office of Disease Prevention and Health Promotion. National Action Plan for Adverse Drug Event Prevention. Washington, DC. 2014. 2. Lazarou J, Pomeranz BH, Corey PN. Incidence of adverse drug reactions in hospitalized patients: a meta-analysis of prospective studies. JAMA 1998; 279: 1200-1205.
4. Davies EC, Green CF, Taylor S, Williamson PR, Mottram DR, Pirmohamed M. Adverse drug reactions in hospital in-patients: a prospective analysis of 3695 patient-episodes. PLoS One 2009; 4: e4439.
5. Dechanont S, Maphanta S, Butthum B, Kongkaew C. Hospital admissions/visits associated with drug-drug interactions: a systematic review and meta-analysis.
Pharmacoepidemiol Drug Saf 2014; 23: 489-497.
6. Kohler GI, Bode-Boger SM, Busse R, Hoopmann M, Welte T, Boger RH. Drug-drug interactions in medical patients: effects of in-hospital treatment and relation to multiple drug use. Int J Clin Pharmacol Ther 2000; 38: 504-513.
7. National Center for Health Statistics (US): Hyattsville (MD), 2015. Health, United States. 8. Hennessy S, Leonard CE, Gagne JJ, Flory JH, Han X, Brensinger CM, Bilker WB.
Pharmacoepidemiologic Methods for Studying the Health Effects of Drug-Drug Interactions. Clin Pharmacol Ther 2016; 99: 92-100.
9. Almenoff JS, Pattishall EN, Gibbs TG, DuMouchel W, Evans SJ, Yuen N. Novel
statistical tools for monitoring the safety of marketed drugs. Clin Pharmacol Ther 2007; 82: 157-166.
10. Hammann F, Drewe J. Data mining for potential adverse drug-drug interactions. Expert Opin Drug Metab Toxicol 2014; 10: 665-671.
12. Hauben M, Madigan D, Gerrits CM, Walsh L, Van Puijenbroek EP. The role of data mining in pharmacovigilance. Expert Opin Drug Saf 2005; 4: 929-948.
13. Harpaz R, DuMouchel W, Shah NH, Madigan D, Ryan P, Friedman C. Novel data-mining methodologies for adverse drug event discovery and analysis. Clin Pharmacol Ther 2012; 91: 1010-1021.
14. Huang L, Guo T, Zalkikar JN, Tiwari RC. A Review of Statistical Methods for Safety Surveillance. Therapeutic Innovation & Regulatory Science 2014; 48: 98-108.
15. Hu N, Huang L, Tiwari RC. Signal detection in FDA AERS database using Dirichlet process. Statistics in Medicine 2015; 34: 2725-2742.
16. Bate A, Lindquist M, Edwards IR, Olsson S, Orre R, Lansner A, De Freitas RM. A Bayesian neural network method for adverse drug reaction signal generation. Eur J Clin Pharmacol 1998; 54: 315-321.
17. Szarfman A, Machado SG, O'Neill RT. Use of screening algorithms and computer systems to efficiently signal higher-than-expected combinations of drugs and events in the US FDA's spontaneous reports database. Drug Saf 2002; 25: 381-392.
18. Noren GN, Sundberg R, Bate A, Edwards IR. A statistical methodology for drug-drug interaction surveillance. Stat Med 2008; 27: 3057-3070.
20. Huang L, Zheng D, Zalkikar J, Tiwari R. Zero-inflated Poisson model based likelihood ratio test for drug safety signal detection. Statistical Methods in Medical Research 2017; 26: 471-488.
21. Huang L, Zalkikar J, Tiwari RC. Likelihood ratio test-based method for signal detection in drug classes using FDA's AERS database. J Biopharm Stat 2013; 23: 178-200.
22. Zhao Y, Yi M, Tiwari RC. Extended likelihood ratio test-based methods for signal detection in a drug class with application to FDA’s adverse event reporting system database. Statistical Methods in Medical Research 2016.
23. Huang L, Zalkikar J, Tiwari R. Likelihood ratio based tests for longitudinal drug safety data. Statistics in Medicine 2014; 33: 2408-2424.
24. Thakrar BT, Grundschober SB, Doessegger L. Detecting signals of drug-drug interactions in a spontaneous reports database. Br J Clin Pharmacol 2007; 64: 489-495. 25. Tatonetti NP, Denny JC, Murphy SN, Fernald GH, Krishnan G, Castro V, Yue P, Tsao PS, Kohane I, Roden DM, Altman RB. Detecting drug interactions from adverse-event reports: interaction between paroxetine and pravastatin increases blood glucose levels. Clin Pharmacol Ther 2011; 90: 133-142.
27. Xiang Y, Albin A, Ren K, Zhang P, Etter JP, Lin S, Li L. Efficiently mining Adverse Event Reporting System for multiple drug interactions. AMIA Jt Summits Transl Sci Proc 2014; 2014: 120-125.
28. Zhang P, Du L, Wang L, Liu M, Cheng L, Chiang CW, Wu HY, Quinney SK, Shen L, Li L. A Mixture Dose-Response Model for Identifying High-Dimensional Drug Interaction Effects on Myopathy Using Electronic Medical Record Databases. CPT Pharmacometrics Syst
Pharmacol 2015; 4: 474-480.
29. MEdDRA. Medical Dictionary for Regulatory Activities. In Medical Dictionary for Regulatory Activities, 2012.
33. Duke JD, Han X, Wang ZP, Subhadarshini A, Karnik SD, Li XC, Hall SD, Jin Y, Callaghan JT, Overhage MJ, Flockhart DA, Strother RM, Quinney SK, Li L. Literature Based Drug Interaction Prediction with Clinical Assessment Using Electronic Medical Records: Novel Myopathy Associated Drug Interactions. Plos Computational Biology 2012; 8.
34. SIDER. Side Effect Resource. In Side Effect Resource, 2015.
35. Nash JC, Varadhan R. Unifying Optimization Algorithms to Aid Software System Users: optimx for R. Journal of Statistical Software 2011; 43: 1-14.
36. Efron B, Tibshirani R, Storey JD, Tusher V. Empirical Bayes analysis of a microarray experiment. Journal of the American Statistical Association 2001; 96: 1151-1160.
37. Efron B, Tibshirani R. Empirical bayes methods and false discovery rates for microarrays. Genet Epidemiol 2002; 23: 70-86.
38. Wilks SS. The Large-Sample Distribution of the Likelihood Ratio for Testing Composite Hypotheses. Ann. Math. Statist. 1938; 9 (1938) 60-62.
Table I. Parameters estimated for CMDRM-MRT, FMDRM-MRT and MDRM using EMR and
FAERS dataset. {𝜋1,𝜋2,𝜋3,𝜋4,𝜋5,𝜋6} are the proportions of 2 way to 6 way drug combinations that follow drug-count response component. c is the maximum Myopathy risk.
a.
Dataset EMR
Parameter CMDRM-MRT [95%CI] FMDRM-MRT [95% CI] MDRM [95% CI]
𝜋1 - 0.869 [ 0.858, 0.880] 0.929 [ 0.920, 0.939]
𝜋2 0.667 [ 0.564, 0.770] 0.869 [ 0.858, 0.880] 0.929 [ 0.920, 0.939]
𝜋3 0.726 [ 0.683, 0.768] 0.869 [ 0.858, 0.880] 0.929 [ 0.920, 0.939]
𝜋4 0.823 [ 0.801, 0.845] 0.869 [ 0.858, 0.880] 0.929 [ 0.920, 0.939]
𝜋5 0.904 [ 0.890, 0.919] 0.869 [ 0.858, 0.880] 0.929 [ 0.920, 0.939]
𝜋6 0.937 [ 0.920, 0.952] 0.869 [ 0.858, 0.880] 0.929 [ 0.920, 0.939]
c 0.448 [ 0.441, 0.456] 0.460 [ 0.443, 0.478] -
𝛽0 -1.084 [-1.107,-1.060] -1.120 [-1.168,-1.072] -2.269 [-2.284, -2.254]
𝛽1 0.843 [ 0.820, 0.866] 0.810 [ 0.767, 0.853] -1.908 [-1.926, -1.889]
𝛽2 - - 0.304 [ 0.298, 0.309]
b.
Dataset FAERS
Parameter CMDRM-MRT [95% CI] FMDRM-MRT [95% CI] MDRM [95% CI]
𝜋1 - 0.798 [ 0.791, 0.805] 0.675 [ 0.667, 0.684]
𝜋2 0.532 [ 0.423, 0.641] 0.798 [ 0.791, 0.805] 0.675 [ 0.667, 0.684]
𝜋3 0.781 [ 0.742, 0.821] 0.798 [ 0.791, 0.805] 0.675 [ 0.667, 0.684]
𝜋4 0.808 [ 0.788, 0.827] 0.798 [ 0.791, 0.805] 0.675 [ 0.667, 0.684]
𝜋5 0.790 [ 0.778, 0.803] 0.798 [ 0.791, 0.805] 0.675 [ 0.667, 0.684]
𝜋6 0.803 [ 0.793, 0.813] 0.798 [ 0.791, 0.805] 0.675 [ 0.667, 0.684]
c 0.999 [ 0.989, 1.000] 0.999 [ 0.991, 1.000] -
𝛽0 -2.554 [-2.567, -2.541] -2.562 [-2.579, -2.546] -1.594 [-1.605, -1.583]
𝛽1 0.695 [ 0.691, 0.699] 0.697 [ 0.693, 0.700] -3.874 [-3.886, -3.862]
Table II. Common 6-way drug combinations detected by CMDRM-MRT with the condition of lfdr<0.00001. RR is the relative risk, it is calculated as risk/constant risk.
a.
b.
Database EMR
Drug1 Drug2 Drug3 Drug4 Drug5 Drug6 Risk [95% CI] RR
atorvastatin omeprazole zolpidem acetaminophen hydrocodone duloxetine 0.73 [0.47, 0.99] 6.64
simvastatin venlafaxine zolpidem acetaminophen hydrocodone tramadol 0.59 [0.36, 0.82] 5.36
simvastatin venlafaxine omeprazole acetaminophen hydrocodone duloxetine 0.56 [0.32, 0.80] 5.09
ondansetron omeprazole promethazine acetaminophen hydrocodone alprazolam 0.38 [0.23, 0.53] 3.45
ondansetron omeprazole promethazine acetaminophen alprazolam oxycodone 0.43 [0.25, 0.61] 3.91
escitalopram omeprazole zolpidem acetaminophen oxycodone duloxetine 0.69 [0.44, 0.94] 6.27
Database FAERS
Drug1 Drug2 Drug3 Drug4 Drug5 Drug6 Risk [95%CI] RR
atorvastatin omeprazole zolpidem acetaminophen hydrocodone duloxetine 0.63 [0.49, 0.76] 9.00
simvastatin venlafaxine zolpidem acetaminophen hydrocodone tramadol 0.70 [0.53, 0.87] 10.00
simvastatin venlafaxine omeprazole acetaminophen hydrocodone duloxetine 0.76 [0.58, 0.94] 10.85
ondansetron omeprazole promethazine acetaminophen hydrocodone alprazolam 0.48 [0.36, 0.60] 6.85
ondansetron omeprazole promethazine acetaminophen alprazolam oxycodone 0.43 [0.30, 0.56] 6.14
Table III. The parameters and relative statistical variables estimated in the simulation study.
Parameters True value Estimate (SD) 95% CI SD/ Estimate Relative bias
𝜋2 0.532 0.527 (0.049) [ 0.513, 0.541] 0.093 -0.010
𝜋3 0.781 0.782 (0.018) [ 0.776, 0.788] 0.023 0.001
𝜋4 0.808 0.807 (0.011) [ 0.804, 0.810] 0.014 -0.001
𝜋5 0.790 0.790 (0.007) [ 0.788, 0.792] 0.009 0
𝜋6 0.803 0.804 (0.006) [ 0.802, 0.806] 0.007 0
𝛽0 -2.554 -2.550 (0.006) [-2.553, -2.547] -0.002 -0.001
𝛽1 0.695 0.696 (0.002) [ 0.695, 0.697] 0.003 0.002