WHAT HAS WORKED IN INVESTING
Studies of Investment Approaches and Characteristics
Associated with Exceptional Returns
What Has Worked in Investing: Studies of Investment Approaches and Characteristics Associated with Exceptional Returns. Copyright © 1992 by Tweedy, Browne Company LLC
Revised Edition. Copyright © 2009 by Tweedy, Browne Company LLC
This booklet contains historical studies and is designed to be illustrative of the general investment philosophy and broad investment style overview of Tweedy, Browne Company LLC. The performance data provided herein should not be relied upon by investors in the Tweedy, Browne Global Value Fund, Tweedy, Browne Global Value Fund II – Currency Unhedged, Tweedy, Browne Value Fund, Tweedy, Browne Worldwide High Dividend Yield Value Fund (the Funds), or any separately managed account of Tweedy, Browne Company LLC in making investment decisions. Current and future portfolio holdings are subject to risk. Investing in foreign securities involves additional risks beyond the risks of investing in U.S. securities markets. These risks include currency fluctuations; political uncertainty; different accounting and financial standards; different regulatory environments; and different market and economic factors in various non-U.S. countries. In addition, the securities of small, less well known companies may be more volatile than those of larger companies. Value investing involves the risk that the market will not recognize a security's intrinsic value for a long time, or that a security thought to be undervalued may actually be appropriately priced when purchased. Please refer to the Funds’ prospectus for a description of risk factors associated with investments in securities that may be held by the Funds.
Past performance is not a guarantee of future results, nor are the results in this booklet indicative of the past or future performance of the Funds or any separately managed account of Tweedy, Browne Company LLC. Investment return and principal value of an investment will fluctuate so that an investor’s shares, when redeemed, may be worth more or less than their original cost.
The investment returns presented in the studies herein represent past performance of stocks and indices as outlined in the respective studies and should not be considered indicative or
representative of the past or future performance of the Funds or any separately managed account of Tweedy, Browne Company LLC, nor should it be inferred that the future performance of these vehicles will equal or exceed the performance set forth in the studies. Although we are not aware of their existence, there may be studies that exist that contradict the conclusions of the studies presented herein. Information contained herein is derived from various sources as set out in the narrative. Although we believe the information provided by the sources to be accurate, we have not independently verified the information.
Tweedy, Browne Global Value Fund, Tweedy, Browne Global Value Fund II – Currency Unhedged, Tweedy, Browne Value Fund and Tweedy, Browne Worldwide High Dividend Yield Value Fund are distributed by AMG Distributors, Inc., Member FINRA/SIPC.
Dear Investor:
What Has Worked in Investing is an attempt to share with you our knowledge of historically successful investment characteristics and approaches. Included in this booklet are descriptions of over 50 studies, approximately half of which relate to non-U.S. stocks. Our choice of studies has not been selective; we merely included most of the major studies we have seen through the years. Interestingly, geography had no influence on the basic conclusion that stocks possessing the characteristics described in this booklet provided the best returns over long periods of time. While this conclusion comes as no surprise to us, it does provide empirical evidence that Benjamin Graham’s principles of investing, first described in 1934 in his book, Security Analysis, continue to serve investors well. A knowledge of the recurring and often interrelated patterns of investment success over long periods has not only enhanced our investment process, but has also provided long-term perspective and, occasionally, patience and perseverance. We hope this knowledge will also serve you well.
The basic investment selection criteria described in What Has Worked in Investing have been incorporated in Tweedy, Browne’s investment screening and decision making process since at least 1958, when Tom Knapp, a retired partner, joined Tweedy, Browne from Benjamin Graham’s investment management firm, Graham-Newman Corporation. Most of Tweedy, Browne’s investments have had at least one, and, more frequently, several of the investment characteristics which are described in this booklet.
The criteria and characteristics have been utilized by Tweedy, Browne because they pointed, like clues, in the direction of truly undervalued companies; appealed to common sense; and because the managing directors have always believed that undervaluation, which is associated with low risk, would also be associated with satisfactory returns. In addition to the confirmation provided by our own historical investment results spanning nearly 50 years, the extensive studies described in this booklet, in our judgment, have empirically confirmed that the fundamental approach to security analysis developed by Benjamin Graham, and long practiced by Tweedy, Browne, produces attractive long-term rates of return. Most investments in Tweedy, Browne portfolios have had, and continue to have, at the time of purchase one or more of the following characteristics:
1. Low Price in Relation to Asset Value Stocks priced at less than book value are purchased on the assumption that, in time, their market price will reflect at least their stated book value; i.e., what the company itself has paid for its own assets. From time to time, we also have been able to find stocks selling at discounts to net current assets(i.e., cash and other assets which can be turned into cash within one year, such as accounts receivable and inventory, less all liabilities), a measure of the estimated liquidation value of the business. This was a stock selection technique successfully employed by Benjamin Graham.
2. Low Price in Relation to Earnings Stocks bought at low price/earnings ratios afford higher earnings yields than stocks bought at higher ratios of price-to-earnings. The earnings yield is the yield which shareholders would receive if all the earnings were paid out as a dividend. Benjamin Graham recommended investing in companies whose earnings yield was 200% of the yield on AAA bonds. Investing in stocks that are priced low in relation to earnings does not preclude investments in companies whose earnings are expected to grow in the future. To paraphrase Warren Buffett, “value” and “growth” are joined at the hip. A company priced low in relation to earnings, whose earnings are expected to grow, is preferable to a similarly priced company whose earnings are not expected to grow. Price is the key. Included within this broad low price in relation to earnings category are high dividendyields and low prices in relation to cash flow (earnings plus depreciation expense).
3. A Significant Pattern of Purchases by One or More Insiders
(Officers and Directors) Officers, directors and large shareholders often buy their own company’s stock when it is depressed in relation to the current value which would be ascribable to the company’s assets or its ongoing business in a corporate acquisition, or to the likely value of the company in the near to intermediate future. Insiders often have “insight information” — knowledge about new marketing programs, product price increases, cost cuts, increased order rates, changes in industry conditions, etc., which they believe will result in an increase in the true underlying value of the company. Other examples of insider insights are: knowledge of the true value of “hidden assets,” such as the value of a money-losing subsidiary which a competitor may have offered to buy, or the value of excess real estate not required in a company’s operation, or knowledge of the likely earning power of the company once heavy non-recurring new product development costs stop. It is not uncommon to see significant insider buying in companies selling in the stock market at
low price/earnings ratios or at low prices in relation to book value. Frequently, companies in which we have invested have also purchased their own shares in the open market.
4. A Significant Decline in a Stock’s Price A decline in price is often accompanied by a decline in earnings or an earnings disappointment. Reversion to the mean is almost a law of nature with respect to company performance. We have found that, more often than not, companies whose recent performance has been poor tend to perk up and improve.
5. Small Market Capitalization Since our investment process at Tweedy, Browne incorporates the entire universe of publicly traded companies, it is not surprising that our portfolios have held, and continue to have exposure to, smaller capitalization companies. Most publicly traded companies are small in terms of their market
capitalization. Furthermore, these companies are often associated with higher rates of growth and may, due to their size, be more easily acquired by other corporations. It has not been uncommon for the investments in our portfolios to simultaneously possess many of the above characteristics. For instance, companies selling at low prices in relation to net current assets, book value and/or earnings are frequently priced low in relation to cash flow, have a high dividend yield and are smaller in terms of their market capitalization. More often than not, the stock price has declined significantly from prior levels; corporate officers and directors have been accumulating the company’s stock, and the company itself is engaged in a share repurchase program. Furthermore, these companies are often priced in the stock market at discounts to real world estimates of the value shareholders would receive in a sale or liquidation of the entire company. Each characteristic seems somewhat analogous to one piece of a mosaic. When several of the pieces are arranged together, the picture can be clearly seen: an undervalued stock.
Dr. Josef Lakonishok (University of Illinois), Dr. Robert W. Vishny (University of Chicago) and Dr. Andrei Shleifer (Harvard University) presented a paper funded by the National Bureau of Economic Research entitled, “Contrarian Investment, Extrapolation and Risk,” May 1993, which examined investment returns from all companies listed on the New York Stock Exchange (NYSE) and American Stock Exchange (AMEX) in relation to ratios of price-to-book value, price-to-earnings and price-to-cash flow between 1968 and 1990. In their abstract, the authors state, “This paper provides evidence that value strategies yield
A subsequent paper, interestingly co-authored by Burton G. Malkiel, the Princeton Professor and author of A Random Walk Down Wall Street, which argues against the efficacy of actively managed investment strategies in favor of index funds, investigated whether the predictable return advantages associated with contrarian strategies set forth in previous empirical studies was persistent and exploitable by investment managers. In this study published in The Journal of Economics and Statistics (May 1997) entitled, “The Predictability of Stock Returns: A Cross-Sectional Simulation,” Zsuzsanna Fluck (New York University), Burton G. Malkiel (Princeton) and Richard E. Quandt (Princeton) examined the performance of 1,000 large-company stocks ranked by price/earnings ratios and price-to-book value ratios from 1979 through 1995, and confirmed the findings of the previous Lakonishok, Shleifer and Vishny study, “Contrarian Investment, Extrapolation and Risk,” finding that,
On a sample of large companies that is free from selection bias, we have concluded that the superior performance of contrarian strategies, documented by earlier studies is not simply an artifact of selection bias. We have also found that the result is robust with respect to transaction costs.
The papers by Fluck, Malkiel and Quandt, and by Lakonishok, Shliefer and Vishny, together with similar studies described in the “Assets Bought Cheap” and “Earnings Bought Cheap” sections of What Has Worked In Investing demonstrate that, at the extreme, investors overvalue and undervalue individual stocks, and that the best returns come from buying stocks at the extreme end of the value spectrum.
Sincerely,
TWEEDY, BROWNE COMPANY LLC William H. Browne
Thomas H. Shrager John D. Spears
Robert Q. Wyckoff, Jr.
TABLE OF CONTENTS
ASSETS BOUGHT CHEAP Page
Benjamin Graham’s Net Current Asset Value Stock Selection Criterion ………...… 1
Low Price in Relation to Book Value………...… 3
Small Market Capitalization Low Price-to-Book Value Companies as Compared to Large
Capitalization Low Price-to-Book Value Companies………...…………...… 8
Five-Year Holding Period Year-By-Year Investment Returns for Low Price-to-Book Value
Companies as Compared to High Price-to-Book Value Companies……..……….… 9
The Consistency of Returns for Low Price-to-Book Value Companies as Compared to High
Price-to-Book Value Companies……… 10
Are Low Book Value Stocks’ Higher Returns, as Compared to High
Price-to-Book Value Stocks, due to Higher Risk?………. 11
Low Price-to-Book Value Stocks Yield Sizeable Excess Returns Net of Transaction Expenses 12
Companies Throughout the World: Low Price in Relation to Book Value………. 13
Companies in the United Kingdom, France, Germany and Japan Trading at Low Prices in
Relation to Book Value……….……… 14
Low Price-to-Book Value Stocks Compared to High Price-to-Book Value Stocks in France, Germany, Switzerland, the United Kingdom, Japan and the United States……… 14
EARNINGS BOUGHT CHEAP
Low Price in Relation to Earnings……….…… 15
Benjamin Graham’s Low Price/Earnings Ratio Stock Selection Criteria………...… 17
Small Market Capitalization Low Price/Earnings Ratio Companies as Compared to Large
Market Capitalization Low Price/Earnings Ratio Companies………...… 18
Five-Year Holding Period Year-By-Year Investment Returns for Low Price-to-Earnings
Companies as Compared to High Price-to-Earnings Companies…...………...… 20
Low Price/Earnings Ratio Stocks Yield Sizeable Excess Returns Net of Transaction Expenses 21
Companies in the United Kingdom, France, Germany and Japan Trading at Low Prices in
Relation to Earnings………..………..… 22
United Kingdom Companies Trading at Low Prices in Relation to Earnings…………..… 23
Companies Throughout the World: Low Price in Relation to Cash Flow…………... 24
Five-Year Holding Period Year-by-Year Investment Returns for Low Price-to-Cash Flow
Companies as Compared to High Price-to-Cash Flow Companies………...… 25 The Consistency of Returns for Low Price-to-Cash Flow Companies as Compared to High
Price-to-Cash Flow Companies………..………..… 26
Price-to-STOCKS WITH HIGH DIVIDEND YIELDS Page
High Dividend Yield in the United Kingdom………..………..….… 30
Companies Throughout the World: High Dividend Yield……….... 32
High Dividend Yield Stocks Generally Outperform Those with Lower Yields, However, the Best Returns Have Not Come from those with the Highest Yields. Higher Yields Coupled with Low Payout Ratios Have Produced the Best Returns……….. 33
The Defensive Nature of High Dividend Yields During Market Declines: High Dividend Yield Stocks Outperformed other Value Strategies and the Market on Average in Down Market Quarters from 1970 – 1996……..……….………..………… 35
INVESTING WITH THE INNER CIRCLE: BUYING STOCKS WHERE THE INSIDERS (OFFICERS, DIRECTORS OR THE COMPANY ITSELF) ARE BUYING The Impact of Insider Accumulation………..………...… 36
United Kingdom: The Impact of Insider Accumulation……… 37
Canada: The Impact of Insider Accumulation………..……...… 38
Companies that Buy Their Own Stock…..………..………..… 38
STOCKS THAT HAVE DECLINED IN PRICE Stocks with the Worst Prior Investment Results………..………..… 39
Stocks with the Worst Prior Investment Results Throughout the World.………..… 39
Stocks with the Worst Prior Investment Results in the United Kingdom.……….… 40
STOCKS WITH SMALLER MARKET CAPITALIZATIONS Larger Returns from Small Capitalization Stocks…..………..………..……….… 41
Small Capitalization Stocks in the United Kingdom, France, Germany and Japan, December 1974 through December 1989………..………...…..……..… 42
Small Capitalization Stocks in the United Kingdom……….………..…….… 43
Small Capitalization Stocks in Canada………..…………..……… 43
Small Capitalization Stocks in Australia………..………..…….… 44
Small Capitalization Stocks in Japan………..………..………..…… 45
INTERRELATED INVESTMENT CHARACTERISTICS..……….……….… 46
ASSETS BOUGHT CHEAP
Benjamin Graham’s Net Current Asset Value Stock Selection Criterion
The net current asset value approach is the oldest approach to investment in groups of securities with common selection characteristics of which we are aware. Benjamin Graham developed and tested this criterion between 1930 and 1932. The net current assets
investment selection criterion calls for the purchase of stocks which are priced at 66% or less of a company's underlying current assets (cash, receivables and inventory) net of all liabilities and claims senior to a company’s common stock (current liabilities, long-term debt, preferred stock, unfunded pension liabilities). For example, if a company's current assets are $100 per share and the sum of current liabilities, long-term debt, preferred stock, and unfunded pension liabilities is $40 per share, then net current assets would be $60 per share, and Graham would pay no more than 66% of $60, or $40, for this stock. Graham used the net current asset investment selection technique extensively in the operations of his investment management business, Graham-Newman Corporation, through 1956. Graham reported that the average return, over a 30-year period, on diversified portfolios of net current asset stocks was about 20% per year.
In the 1973 edition of The Intelligent Investor, Benjamin Graham commented on the technique:
“It always seemed, and still seems, ridiculously simple to say that if one can acquire a diversified group of common stocks at a price less than the applicable net current assets alone — after deducting all prior claims, and counting as zero the fixed and other assets — the results should be quite satisfactory.”
In an article in the November/December 1986 issue of Financial Analysts Journal, “Ben Graham’s Net Current Asset Values: A Performance Update,” Henry Oppenheimer, an Associate Professor of Finance at the State University of New York at Binghamton,
examined the investment results of stocks selling at or below 66% of net current asset value during the 13-year period from December 31, 1970 through December 31, 1983.
The study assumed that all stocks meeting the investment criterion were purchased on December 31 of each year, held for one year, and replaced on December 31 of the
subsequent year by stocks meeting the same criterion on that date. To create the annual net current asset portfolios, Oppenheimer screened the entire Standard & Poor’s Security
Owners Guide. The entire 13-year study sample size was 645 net current asset selections
from the New York Stock Exchange (NYSE), the American Stock Exchange (AMEX) and the over-the-counter securities market. The minimum December 31 sample was 18 companies and the maximum December 31 sample was 89 companies.
The mean return from net current asset stocks for the 13-year period was 29.4% per year versus 11.5% per year for the NYSE-AMEX Index. One million dollars invested in the net current asset portfolio on December 31, 1970 would have increased to $25,497,300 by December 31, 1983. By comparison, $1,000,000 invested in the NYSE-AMEX Index would have increased to $3,729,600 on December 31, 1983. The net current asset
portfolio's exceptional performance over the entire 13 years was not consistent over smaller subsets of time within the 13-year period. For the three-year period, December 31, 1970 through December 31, 1973, which represents 23% of the 13-year study period, the mean annual return from the net current asset portfolio was .6% per year as compared to 4.6% per year for the NYSE-AMEX Index.
The study also examined the investment results from the net current asset companies which operated at a loss (about one-third of the entire sample of companies) as compared to the investment results of the net current asset companies which operated profitably. The companies operating at a loss had slightly higher investment returns than the companies with positive earnings: 31.3% per year for the unprofitable companies versus 28.9% per year for the profitable companies.
Further research by Tweedy, Browne has indicated that companies satisfying the net current asset criterion have not only enjoyed good common stock performance over time but also have often been priced at significant discounts to “real world” estimates of the specific value that stockholders would probably receive in an actual sale or liquidation of the entire corporation. Net current asset value ascribes no value to a company's real estate and equipment, nor is any going concern value ascribed to prospective earning power from a company’s sales base. When liquidation value appraisals are made, the estimated “haircut” on accounts receivable and inventory is often recouped or exceeded by the estimated value of a company’s real estate and equipment. It is not uncommon to see informed investors, such as a company's own officers and directors or other corporations, accumulate the shares of a company priced in the stock market at less than 66% of net current asset value. The company itself is frequently a buyer of its own shares.
Common characteristics associated with stocks selling at less than 66% of net current asset value are low price/earnings ratios, low price/sales ratios and low price in relation to “normal” earnings; i.e., what the company would earn if it earned the average return on equity for a given industry or the average net income margin on sales for such industry. Current earnings are often depressed in relation to prior earnings. The stock price has often declined significantly from prior price levels, causing a shrinkage in a company’s market capitalization.
Note: Investors should bear in mind that Ben Graham’s “66% of net current asset”
criterion, which is discussed in several places in this paper, is a rather extreme quantitative value-based methodology that should not be confused with Tweedy, Browne’s current criteria of investing in businesses trading in the stock market at approximately 2/3rds or less of
estimated intrinsic value. In general, “net current assets” is a quick approximation of the value of a company’s assets in liquidation, with no value ascribed to the company’s property, plant, equipment or its sales base. For most companies, estimate of intrinsic value will be significantly in excess of net current asset value. Ben Graham’s well known “66% of net current assets” formula has been of limited practical utility to value investors such as ourselves in recent years. Stocks trading at 66% of net current assets or less have been few and far between in the stock market, and when we do uncover them, they are often micro-capitalization companies that can accommodate only modest levels of investment. That said, they do turn up from time to time, and when they do, we study them as prospective investment candidates.
Low Price in Relation to Book Value
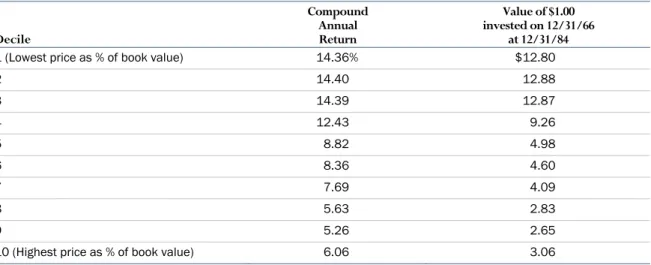
Roger Ibbotson, Professor in the Practice of Finance at Yale School of Management and President of Ibbotson Associates, Inc., a consulting firm specializing in economics, investments and finance, in “Decile Portfolios of the New York Stock Exchange, 1967 - 1984,” Working Paper, Yale School of Management, 1986, studied the relationship be-tween stock price as a percentage of book value and investment returns. To test this relationship, all stocks listed on the NYSE were ranked on December 31 of each year, according to stock price as a percentage of book value, and sorted into deciles. (A decile is 10% of the stocks listed on the NYSE.) The compound average annual returns were measured for each decile for the 18-year period, December 31, 1966 through
December 31, 1984.
As shown in Table 1, stocks with a low price-to-book value ratio had significantly better investment returns over the 18-year period than stocks priced high as a percentage of book value.
Table 1: Stock Price as a Percentage of Book Value, 1967 – 1984 Decile
Compound Annual Return
Value of $1.00 invested on 12/31/66
at 12/31/84
1 (Lowest price as % of book value) 14.36% $12.80
2 14.40 12.88
3 14.39 12.87
4 12.43 9.26
5 8.82 4.98
6 8.36 4.60
7 7.69 4.09
8 5.63 2.83
During the period December 31, 1966 through December 31, 1984 covered in Table 1, the compound annual return for the market capitalization weighted NYSE Index was 8.6%. Werner F.M. DeBondt and Richard H. Thaler, Finance Professors at University of Wisconsin and Cornell University, respectively, examined stock price in relation to book value in “Further Evidence on Investor Overreaction and Stock Market Seasonality,” The
Journal of Finance, July 1987. All companies listed on the NYSE and AMEX, except
companies that were part of the S&P 40 Financial Index, were ranked according to stock price in relation to book value and sorted into quintiles, five groups of equal number, on December 31 in each of 1969, 1971, 1973, 1975, 1977 and 1979. The total number of companies in the entire sample ranged between 1,015 and 1,339 on each of the six portfolio formation dates.
The investment return in excess of or (less than) the equal weighted NYSE Index was computed over the subsequent four years for all of the stocks in each selection period. The four-year returns in excess of or (less than) the market index were averaged. The study results and additional descriptive information are presented below in Table 2.
Table 2: Market Price in Relation to Book Value for Companies Listed on the New York and American Stock Exchanges
Rank
Cumulative Average Return
in excess of or (less than) Market Index
4 Years after Portfolio Formation
Cumulative Average Return
in excess of or (less than) Market Index 4 Years prior to
Portfolio Formation Average Market Price/ Book Value at Portfolio Formation Date Average Earnings Yield at Portfolio Formation Date Market Capitalization at Portfolio Formation Date (Millions)
1 (Lowest price/
book value) 40.7% (25.8%) 0.36 .100 $106
2 22.6 (3.0) 0.76 .149 330
3 9.5 16.3 1.02 .169 424
4 5.0 37.6 1.43 .180 594
5 (Highest price/
book value) (1.3) 76.2 3.42 .147 1,030
The compound annual return in excess of the market index from the lowest 20% of the stocks, in terms of price/book value, was 8.91%. For each $1,000,000 invested, the low price/book value stocks returned $407,000 more on average than the market index in each four-year period.
The authors point out the investment return reversion which occurred in the periods examined in their study. The average cumulative return for lowest price/book value stocks in the four years prior to portfolio formation was 25.8 percentage points less than the market index. This group of companies, which had performed so poorly in the stock market, subsequently increased 40.7 percentage points more than the market index in the
four years after portfolio formation. The highest price/book value stocks, which had excellent investment results in the four years prior to portfolio formation (76.2 percentage points in excess of the market index), subsequently returned 1.3 percentage points less than the market index in the four years after portfolio formation.
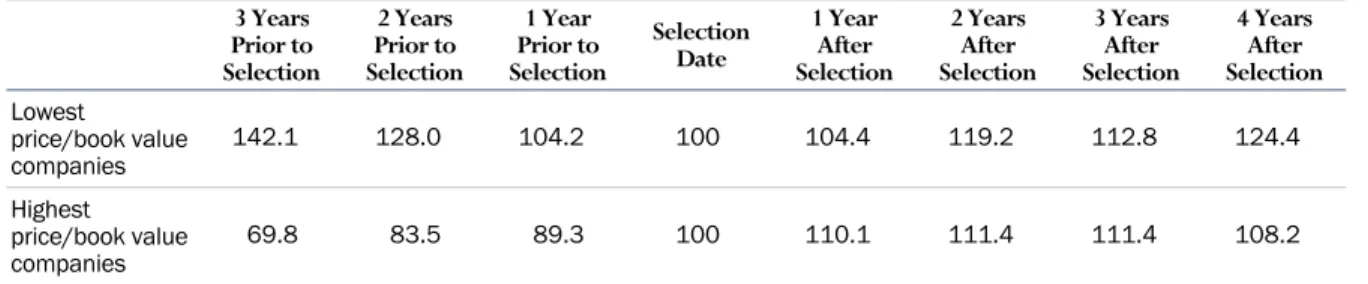
Another intriguing aspect of the study was the contrast between the earnings pattern of the companies in the lowest quintile of price/book value companies (average price/book value equaled .36) and in the highest quintile of price/book value companies (average price/book value equaled 3.42). (A quintile is 20% of the companies listed on the NYSE and AMEX.) Table 3 describes the average earnings per share for companies in the lowest and highest quintile of price/book value in the three years prior to selection and the four years subsequent to selection.
Table 3: Average Earnings per Share for Companies in the Lowest and Highest Price/Book Value Quintiles
3 Years Prior to Selection 2 Years Prior to Selection 1 Year Prior to Selection Selection Date 1 Year After Selection 2 Years After Selection 3 Years After Selection 4 Years After Selection Lowest price/book value
companies 142.1 128.0 104.2 100 104.4 119.2 112.8 124.4
Highest price/book value companies
69.8 83.5 89.3 100 110.1 111.4 111.4 108.2
In the three years prior to the selection date, companies in the lowest quintile of
price/book value experienced a significant decline in earnings, and companies in the highest quintile of price/book value experienced a significant increase in earnings. In the fourth year after the date of selection, the companies with the lowest price/book value
experienced a larger percentage increase in earnings, +24.4%, than the companies with the highest price/book value, whose earnings increased 8.2%. The authors suggest that
earnings are “mean reverting” at the extremes; i.e., that significant declines in earnings are followed by significant earnings increases, and that significant earnings increases are followed by slower rates of increase or declines.
Tweedy, Browne examined the historical returns from stocks which were priced low in relation to book value and from stocks which were selling at 66% or less of net current asset value. All 7,000 public companies in the Compustat database, including the Research File of companies which had been acquired, merged or declared bankrupt subsequent to an assumed historical selection date, were screened to identify those companies with a market capitalization of at least $1 million and a stock market price of no more than 140% of book
2 years and 3 years after each selection date. These stocks were ranked according to price in relation to book value and sorted into nine price/book value groups and one group
comprised of stocks selling at less than 66% of net current asset value. The average results for all stocks in each of the ten groups were compared to the results of the Standard & Poor’s 500 Stock Index (S&P 500) over each of the holding periods. A total of 1,820 companies were culled from the Compustat database. The results of this price/book value and net current asset value study are presented in Table 4.
Table 4: Price in Relation to Book Value, and Stocks Selling at 66% or Less of Net Current Asset Value, April 1970 – April 1981
Holding Period
6 months 1 Year 2 Years 3 Years
Stock Selection Criteria Average Return S&P 500 Average Return S&P 500 Average Return S&P 500 Average Return S&P 500
140% - 120% of book value 0.6% 1.1% 15.7% 8.5% 34.1% 18.2% 48.9% 27.7% 120% - 100% of book value (0.3) 1.1 14.9 8.5 31.0 18.2 45.3 27.7 100% - 80% of book value (0.3) 1.1 15.3 8.5 34.5 18.2 51.5 27.7 80% - 70% of book value 0.1 1.1 18.5 8.5 39.6 18.2 57.9 27.7 70% - 60% of book value (0.8) 1.1 18.9 8.5 41.1 18.2 62.1 27.7 60% - 50% of book value (0.2) 1.1 19.6 8.5 45.9 18.2 72.6 27.7 50% - 40% of book value (0.4) 1.1 20.9 8.5 53.8 18.2 77.9 27.7 40% - 30% of book value 1.3 1.1 25.7 8.5 50.1 18.2 73.5 27.7 30% - 0% of book value 2.3 1.1 30.0 8.5 53.5 18.2 88.0 27.7 66% of net current asset value 3.4 0.7 28.8 9.1 53.5 20.8 87.6 31.5
One million dollars invested on April 30, 1970 and rolled over at each subsequent April 30 into the stocks selling at less than 30% of book value would have increased to $23,298,000 on April 30, 1982. One million dollars invested in the S&P 500 on April 30, 1970 would have been worth $2,662,000 on April 30, 1982.
Tweedy, Browne, using the same methodology over the same period, examined the historical returns of the stocks of (i) unleveraged companies which were priced low in relation to book value and (ii) unleveraged companies selling at 66% or less of net current asset value in the stock market. The sample included only those companies priced at no more than 140% of book value, or no more than 66% of net current asset value in which the debt-to-equity ratio was 20% or less. The results of this study of unleveraged companies which were priced low in relation to book value and net current asset value are presented on the following page in Table 5.
Table 5: Unleveraged Companies: Price in Relation to Book Value, and Stocks Priced at 66% or Less of Net Current Asset Value, April 1970 – April 1981
Holding Period
6 months 1 Year 2 Years 3 Years
Stock Selection Criteria Average Return S&P 500 Average Return S&P 500 Average Return S&P 500 Average Return S&P 500
140% - 120% of book value 1.6% 1.1% 15.8% 8.5% 36.5% 18.2% 53.8% 27.7% 120% - 100% of book value 0.2 1.1 18.0 8.5 36.7 18.2 56.4 27.7 100% - 80% of book value 0.8 1.1 19.4 8.5 39.4 18.2 56.8 27.7 80% - 70% of book value 2.0 1.1 24.3 8.5 45.5 18.2 63.1 27.7 70% - 60% of book value 1.0 1.1 19.8 8.5 42.1 18.2 68.4 27.7 60% - 50% of book value 1.0 1.1 19.8 8.5 49.7 18.2 73.8 27.7 50% - 40% of book value 1.4 1.1 23.7 8.5 53.7 18.2 83.0 27.7 40% - 30% of book value 6.7 1.1 18.2 8.5 52.1 18.2 70.1 27.7 30% - 0% of book value 8.6 0.7 32.8 6.8 60.2 20.8 113.7 31.5 66% of net current asset value 7.5 0.7 34.9 9.1 63.5 20.8 98.8 31.5
The results for the unleveraged companies were somewhat better than the investment results for the companies in which debt-to-equity exceeded 20%.
Similar to net current asset stocks, other characteristics frequently associated with stocks selling at low ratios of price-to-book value are: (i) low price-to-earnings ratios, (ii) low price-to-sales ratios, and (iii) low price in relation to “normal” earnings, assuming a
company earns the average return on equity for a given industry or the average net income margin on sales for such industry. Current earnings are often depressed in relation to prior levels of earnings. The stock price has often declined significantly from prior levels. The companies with the lowest ratios of price-to-book value are generally smaller market
capitalization companies. Corporate officers and directors often buy such stock because they believe it is depressed relative to its true value. The companies also frequently repurchase their own stock.
In Tweedy, Browne’s experience, stocks selling at low prices in relation to book value are often priced at significant discounts to “real world” estimates of the value that shareholders would receive in a sale of the entire company. By real world estimates, we mean estimates made by individuals familiar with corporate valuation in the company's field of business.
Small Market Capitalization Low Price-to-Book Value Companies as Compared to Large Capitalization Low Price-to-Book Value Companies
Eugene L. Fama and Kenneth R. French examined the effects of market capitalization and price as a percentage of book value on investment returns in “The Cross-Section of
Expected Stock Returns,” Working Paper 333, Graduate School of Business, University of Chicago, January 1992. All non-financial NYSE, AMEX and NASDAQ companies included in the Center for Research in Security Prices file for which data was also available in the Compustat database were ranked according to stock price as a percentage of book value and sorted into deciles. Then, each price/book value decile was ranked according to market capitalization and sorted into deciles. The study examined investment returns from July 1963 to December 1990. Average annual equal-weighted investment returns for each of the ten market capitalization deciles which comprised each of the ten price/book value deciles are presented below in Table 6.
Table 6: July 1963 – December 1990 Annual Investment Returns for Low Versus High Price/Book Value Stocks According to Market Capitalization within Each Price/Book Value Category for New York Stock Exchange, American Stock Exchange and NASDAQ Listed Stocks
Ratio of Price to Book Value Decile
(Highest Price/Book Value) (Lowest Price/Book Value) Market Capitalization Decile 1 2 3 4 5 6 7 8 9 10
1 (Smallest market
capitalzation) 8.4% 13.7% 14.4% 17.2% 18.7% 18.1% 20.4% 20.5% 21.8% 23.0%
2 5.2 12.6 11.5 14.3 16.0 14.3 19.0 15.4 17.2 21.5
3 6.7 10.6 14.8 11.4 16.3 15.6 15.6 16.8 18.5 19.2
4 4.7 8.6 12.7 16.3 13.6 14.5 16.1 19.1 18.1 17.6
5 10.6 7.8 13.0 17.6 13.6 17.2 17.3 15.1 18.2 17.9
6 8.4 11.8 13.7 14.8 11.3 15.2 14.3 14.3 14.9 18.0
7 11.4 12.0 11.9 10.0 11.9 13.6 11.9 13.9 13.2 17.6
8 7.9 13.6 10.9 11.4 11.9 12.1 13.8 12.6 15.5 18.6
9 5.3 10.7 11.0 12.0 12.6 11.2 9.8 13.3 12.5 14.6
10 (Largest market
capitalzation) 11.2 10.6 10.1 8.5 9.5 10.0 9.7 11.5 11.6 14.2 All companies in each
price/book value decile 7.7 11.8 12.7 14.0 14.9 15.1 16.7 16.8 18.0 19.6
As Table 6 indicates, smaller market capitalization companies at the lowest prices in relation to book value provided the best returns. Table 6 also shows that within every market capitalization category, the best returns were produced by stocks with low prices in relation to book value.
In addition, the authors, through a regression analysis, examined the power of the following characteristics to predict future investment returns: market beta, market capitalization, price/earnings ratio, leverage and to-book value percentage. Their conclusion: price-to-book value “is consistently the most powerful for explaining the cross-section of average stock returns.”
Five-Year Holding Period Year-by-Year Investment Returns for Low Price-to-Book Value Companies as Compared to High Price-to-Book Value Companies
Josef Lakonishok, Robert W. Vishny and Andrei Shleifer examined the effect of price as a percentage of book value on investment returns in “Contrarian Investment, Extrapolation and Risk,” Working Paper No. 4360, National Bureau of Economic Research, May 1993. The professors ranked all companies listed on the NYSE and the AMEX according to stock price as a percentage of book value and sorted the companies into deciles. Portfolios were initially formed on April 30, 1968, and new portfolios were formed on each
subsequent April 30. The study period ended on April 30, 1990. The decile portfolios were held for five years, and the average annual year-by-year investment returns, the average annual five-year returns and the average cumulative total five-year returns were calculated. The investment returns were equal-weighted. The following Table 7 shows the results of the study.
Table 7: Investment Returns in Relation to Stock Price as a Percentage of Book Value for all New York Stock Exchange and American Stock Exchange Listed Companies, April 1968 – April 1990
Stock Price as a Percentage of Book Value Decile
(Highest Price/Book Value) (Lowest Price/Book Value) Holding Period Following
Portfolio Formation 1 2 3 4 5 6 7 8 9 10
1styear 11.0% 11.7% 13.5% 12.3% 13.1% 15.4% 15.4% 17.0% 18.3% 17.3%
2ndyear 7.9 10.7 14.0 14.5 15.3 15.6 16.9 16.4 18.2 18.8
3rdyear 10.7 13.2 15.5 16.7 16.5 17.2 19.1 20.7 19.6 20.4
4thyear 8.1 13.3 13.6 16.0 17.0 16.9 18.8 20.4 21.3 20.7
5thyear 8.8 13.7 16.3 17.5 17.1 17.6 21.6 20.1 20.6 21.5
Average annual return
over the 5-year period 9.3 12.5 14.6 15.4 15.8 16.6 18.4 18.9 19.6 19.8 Cumulative 5-year total return 56.0 80.2 97.3 104.5 108.2 115.2 132.0 137.5 144.9 146.2
The Consistency of Returns for Low Price-to-Book Value Companies as Compared to High Price-to-Book Value Companies
The study which was described in the preceding section, “Contrarian Investment,
Extrapolation and Risk,” also examined the consistency of investment returns for low price-to-book value companies as compared to high price-price-to-book value companies over l-year, 3-year and 5-year holding periods from April 30, 1968 through April 30, 1990. The investment returns for the companies in the high price-to-book value category, which comprised the returns for the companies in the highest two deciles of companies which had been ranked on price-to-book value, were subtracted from the investment returns of the low to-book value companies, which comprised the bottom two deciles of the price-to-book value ranking. The following Table 8 shows the results of the study.
Table 8: The Consistency of Investment Returns for Low Price-to-Book Value Companies as Compared to High Price-to-Book Value Companies for l-Year, 3-Year and 5-Year Holding Periods, April 1968 – April 1990
Holding Period
Year of Portfolio Formation % Better (Worse)1 Year % Better (Worse)3 Years % Better (Worse) 5 Years
1968 9.8% 20.1% 34.4%
1969 7.4 7.0 30.3
1970 2.3 3.2 27.9
1971 (10.8) 15.6 46.3
1972 9.8 32.8 78.4
1973 4.2 45.0 92.5
1974 5.0 64.2 172.6
1975 41.8 103.4 118.2
1976 13.2 72.7 99.3
1977 19.5 18.1 61.4
1978 3.7 (26.4) 28.6
1979 (20.7) (12.3) 56.9
1980 (3.4) 106.6 167.6
1981 18.5 81.0 195.5
1982 24.0 58.9 147.7
1983 22.1 25.6 64.8
1984 4.3 32.4 64.0
1985 (0.7) 23.7 29.9
1986 5.1 14.9
1987 7.8 1.5
1988 (3.7) 1989 (20.7)
As Table 8 indicates, the low book value stocks outperformed the high price-to-book value stocks in 16 of the 22 years, or 73% of the time. For three-year holding periods, the low price-to-book companies beat high price-to-book companies in 18 out of the 20 three-year periods. For five-year holding periods, the low price-to-book value companies were a better choice than the high price-to-book value companies every time.
Are Low Price-to-Book Value Stocks' Higher Returns, as Compared to High Price-to-Book Value Stocks, due to Higher Risk?
In an attempt to examine whether the higher returns of low price-to-book value stocks were due to greater risk, Professors Lakonishok, Vishny and Shleifer measured monthly investment returns in relation to price as a percentage of book value between April 30, 1968 and April 30, 1990 in the 25 worst months for the stock market, and the remaining 88 months in which the stock market declined. In addition, monthly returns were ex-amined in the 25 best months for the stock market and the 122 remaining months in which the stock market increased. The results of this study are shown below in Table 9. Table 9: Average One-Month Investment Returns in Relation to Price as a
Percentage of Book Value in the Worst and Best Stock Market Months, April 1968 – April 1990
Price as a Percentage of Book Value Decile
(Highest Price as a Percentage of Book Value) (Lowest Price as a Percentage of Book Value) 1 2 3 4 5 6 7 8 9 10
Worst 25 months in the
stock market (11.2%) (11.0%) (10.4%) (10.0%) (9.7%) (9.1%) (9.3%) (9.2%) (9.8%) (10.2%) Next worst 88 months in
the stock market when the
stock market declined (2.9) (2.8) (2.6) (2.5) (2.3) (2.0) (2.1) (2.0) (1.8) (2.2) Best 25 months in the
stock market 11.4 11.4 11.9 11.3 11.2 11.3 11.8 12.6 13.3 14.8
Next best 122 months in the stock market when the
stock market increased 3.8 4.0 3.9 3.7 3.6 3.7 3.8 3.7 3.8 3.9
As Table 9 indicates, the low book value stocks outperformed the high price-to-book value stocks in the market's worst 25 months, and in the other 88 months when the market declined. In the best 25 months for the market, the low price-to-book value stocks also beat the high price-to-book value stocks. The monthly results were similar for both high and low price-to-book value stocks in the remaining 122 months when the stock market increased.
skewed toward negative return months rather than positive return months. The evidence [in Table 9] thus shows that the value strategy does not expose investors to greater downside risk.
Low Price-to-Book Value Stocks Yield Sizeable Excess Returns Net of Transaction Expenses
In a study published in The Journal of Economics and Statistics (May 1997) entitled, “The Predictability of Stock Returns: A Cross-Sectional Simulation,” Zsuzsanna Fluck (New York University), Burton G. Malkiel (Princeton) and Richard E. Quandt (Princeton) examined the performance of 1,000 large-company stocks ranked by price/earnings and price-to-book value ratios from 1979 through 1995, and confirmed the findings of the previous Lakonishok, Shleifer and Vishny study, “Contrarian Investment, Extrapolation and Risk,” finding that low price/earnings and low price-to-book value strategies yield sizeable excess returns net of transaction costs and after adjusting for risk.
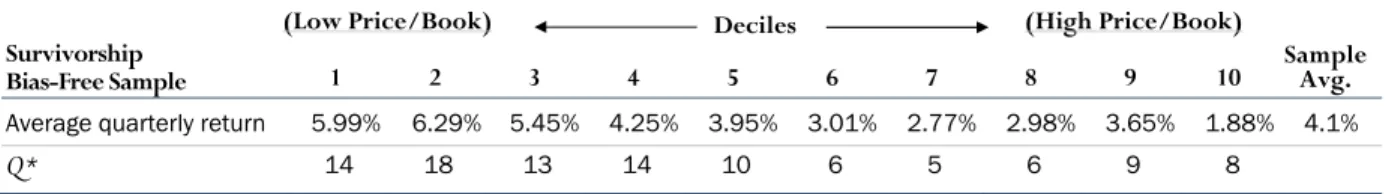
In Table 10, Fluck, Malkiel and Quandt constructed a data sample from Compustat for the period January 1989 through mid-1995 consisting of the 1,000 largest U.S. companies as of 1988, sorted and ranked into deciles based on their prices in relation to book value. They found that the lowest price-to-book value decile, which was rebalanced quarterly, produced 1.89% of excess return quarterly, or 7.56% annualized, over the average return produced by the entire data sample. This translated into an average annual return for the low price-to-book value decile of 23.96% versus a 16.40% average annual return for the entire Compustat sample. In addition, they found that the excess return persisted even after performing portfolio simulations which took into consideration transaction expenses associated with purchases and sales. The low price-to-book value decile produced returns annually that were 5.2% better than the sample and 8.0% better than the S&P 500 net of transaction expenses. Table 10a: Mean Return by Decile Sorted by Price-to-Book Value Ratios (1/1989 – 6/1995)
(Low Price/Book) Deciles (High Price/Book) Survivorship
Bias-Free Sample 1 2 3 4 5 6 7 8 9 10 SampleAvg.
Average quarterly return 5.99% 6.29% 5.45% 4.25% 3.95% 3.01% 2.77% 2.98% 3.65% 1.88% 4.1%
Q* 14 18 13 14 10 6 5 6 9 8
* Q is the number of quarters in which the decile return exceeds the sample average.
Table 10b: Returns Net of 25 Cents Trading Costs (1/1989 – 6/1995)
Average Quarterly Return S&P 500 Sample of 1,000 Companies
Companies Throughout the World: Low Price in Relation to Book Value
In “Ben Graham Would be Proud,” a Morgan Stanley & Co. Inc. research report dated April 8, 1991, Barton M. Biggs, then a managing director of Morgan Stanley, described a study which examined the returns from investing in the stocks of non-U.S. and U.S. companies trading at low prices in relation to book value. In the study, all stocks in the Morgan Stanley Capital International database were ranked according to stock price in relation to book value and sorted into deciles each year from 1981 through 1990, a total of ten years. Approximately 80% of the companies in the Morgan Stanley Capital International database were non-U.S. companies. The number of companies in the analysis increased from 1,178 to 2,349 over the period. The average investment return for the companies included in each price/book value group was compared to the return for the Morgan Stanley Capital
International global equity index. The investment returns were equally weighted and expressed in U.S. dollars. Table 11 shows the results by year.
Table 11: Worldwide Low Price/Book Value Investment Returns Price-to-
Book Value
Category 1981 1982 1983 1984 1985 1986 1987 1988 1989 1990
Cumulative Compounded
Annual Return
Return in Excess of Market
Index
1 (Lowest
price/book value) 3.4% 11.2% 50.4% 14.8% 68.9% 39.9% 15.9% 37.1% 27.2% -16.1% 23.0% 5.1%
2 2.9 12.2 37.4 7.3 58.1 26.7 15.4 28.6 27.6 -13.2 18.8 0.9
3 3.4 15.9 30.1 6.1 53.6 37.5 15.4 21.0 27.8 -11.4 18.6 0.7
4 5.6 10.1 32.0 0.6 50.3 44.0 15.0 16.5 33.5 -9.5 18.4 0.5
5 -5.1 10.8 28.6 -0.4 48.9 40.0 12.7 19.7 28.2 -7.9 16.2 -1.8
6 1.8 7.9 22.1 12.0 55.0 53.1 19.9 21.7 28.3 -12.3 19.3 1.4
7 2.3 6.4 22.5 2.3 60.0 58.7 12.7 21.6 29.0 -13.1 18.2 0.3
8 1.1 6.1 20.8 3.3 54.2 54.0 18.3 15.8 25.7 -17.2 16.3 -1.6
9 -4.9 3.7 20.7 3.5 57.6 59.3 22.5 19.4 27.7 -25.5 15.7 -2.2 10 (Highest
price/book value) -8.5 -3.0 21.6 -4.2 53.5 66.0 24.0 19.8 21.7 -23.3 13.8 -4.1
One million dollars invested in the lowest price-to-book value category starting in 1981 would have increased to $7,953,000 at the end of 1990. One million dollars invested in the highest price-to-book value companies would have increased to $3,651,000 over the same period.
Companies in the United Kingdom, France, Germany and Japan Trading at Low Prices in Relation to Book Value
John R. Chisholm examined price-to-book value and investment results for companies in the United Kingdom, France, Germany and Japan in “Quantitative Applications for
Research Analysts,” Investing Worldwide II, Association for Investment Management and Research, 1991. Companies in each country were ranked according to the ratio of price-to-book value at the end of each year and sorted into five equal number groups (quintiles). The study period was December 31, 1974 through December 31, 1989 (15 years). Equal
investments were assumed to have been made in each stock, and the stocks were assumed to have been sold after one year. The results were U.S. dollar results. Table 12 below shows the annual compound returns for the top and bottom quintiles.
Table 12: Investment Results According to Price in Relation to Book Value in the
United Kingdom, France, Germany and Japan, December 1974 – December 1989 Annual Compound Returns
Price-to-Book Value Category United Kingdom France Germany Japan
Lowest price-to-book value quintile 32.7% 28.2% 22.5% 30.9%
Highest price-to-book value quintile 24.4 17.0 20.1 19.4
Low Price-to-Book Value Stocks Compared to High Price-to-Book Value Stocks in France, Germany, Switzerland, the United Kingdom, Japan, and the United States William F. Sharpe, a Nobel Prize winner in economics, and Carlo Capaul and Ian Rowley, from Union Bank of Switzerland, examined the comparative investment returns of low price-to-book value stocks (“value” stocks) and high price-to-book value stocks (“growth” stocks) in France, Germany, Switzerland, the United Kingdom, Japan, and the United States in “International Value and Growth Stock Returns,” Financial Analysts Journal, January/February 1993. Each six months, the stocks, which comprised a major index in each country, were ranked on the ratio of price-to-book value. The S&P 500 was used for the United States, and Morgan Stanley Capital International indexes were used for the other countries. Within each country, the highest price-to-book value stocks, whose total market capitalizations accounted for 50% of the entire market capitalization of the particular country's index, were defined as the growth stock portfolio. The lower price-to-book value stocks which, in aggregate, accounted for the remaining 50% of the entire market
of the two portfolios was the market capitalization weighted average of the total returns on the underlying stocks. The cumulative difference between the investment returns of the value stocks and the growth stocks in each country over the 11½-year period, January 1981 through June 1992, are shown in Table 13.
Table 13: The Extra Investment Returns from Value Stocks as Compared to Growth Stocks in France, Germany, Switzerland, the United Kingdom, Japan, and the United States, January 1981 – June 1992
Country
Cumulative Extra Investment Return from Value Stocks vs. Growth Stocks over 11½-Year Period
January 1981 through June 1992
France 73.7%
Germany 17.7
Switzerland 42.7
United Kingdom 31.5
Japan 69.5
United States 15.6
Global (i.e., all of the above countries) 39.5
Europe 31.9
The study’s authors concluded “Value stocks outperformed growth stocks on average in each country during the period studied, both absolutely and after adjustment for risk.”
EARNINGS BOUGHT CHEAP Low Price in Relation to Earnings
Sanjoy Basu, Professor of Finance at McMaster University, examined price/earnings ratios and investment results in “Investment Performance of Common Stocks in Relation to Their Price/Earnings Ratios: A Test of the Efficient Market Hypothesis,” Journal of Finance, June 1977. His study covered NYSE listed companies, about 500 stocks annually, over a 14-year period, from 1957 through 1971. The price/earnings ratios for all the stocks were calculated at year end, ranked from highest to lowest price/earnings ratios, and sorted into quintiles. The study assumed that equal investments were made in each stock, and that the stocks were sold after one year. The results are shown on the following page in Table 14. Portfolio 1, the highest price/earnings ratio group, includes all companies with losses.
Table 14: Investment Results of New York Stock Exchange Industrial Companies According to Price/Earnings Ratios, April 1957 – March 1971
Portfolio
1 (Highest P/E)
2 (Highest P/E
without loss
companies) 3 4 5
6 (Lowest P/E)
Median price/
earnings ratio 35.8x 30.5x 19.1x 15.0x 12.8x 9.8x
Average annual rate
of return 9.3% 9.5% 9.3% 11.7% 13.6% 16.3%
Market risk (beta) 1.11 1.06 1.04 .97 .94 .99
One million dollars invested in the lowest price/earnings ratio group over the
14-year study period would have increased to $8,282,000. One million dollars invested in the highest price/earnings ratio group would have increased to $3,473,000 over the same period.
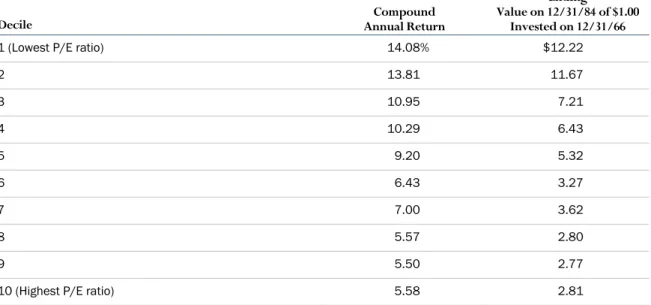
Roger Ibbotson, in his “Decile Portfolios of the NYSE, 1967 – 1984,” Working Paper, Yale School of Management, 1986, ranked all stocks listed on the NYSE according to
price/earnings ratios on each December 31 from 1966 through 1983, and sorted the stocks into deciles. The investment returns were measured for each year from December 31, 1966 through December 31, 1984, an 18-year period. The results are shown below in Table 15. Table 15: Investment Results of New York Stock Exchange Companies According to
Price/Earnings Ratios, December 1966 – December 1984 Decile Annual ReturnCompound
Ending Value on 12/31/84 of $1.00
Invested on 12/31/66
1 (Lowest P/E ratio) 14.08% $12.22
2 13.81 11.67
3 10.95 7.21
4 10.29 6.43
5 9.20 5.32
6 6.43 3.27
7 7.00 3.62
8 5.57 2.80
9 5.50 2.77
During the 18-year period shown in Table 15, the compound annual returns for the market capitalization weighted NYSE and U.S. Treasury bills were 8.6% and 7.4%, respectively. In Tweedy, Browne’s experience, stocks selling at low prices in relation to earnings are also often significantly undervalued in relation to specific appraisals of the value that
shareholders would receive in a sale of the entire company, based upon valuations of similar businesses in corporate transactions. Companies with low price/earnings ratios are also frequently priced at low price-to-book value ratios relative to other companies in the same industry.
Stocks of companies selling at low price/earnings ratios often have above-average cash dividend yields. Additionally, the remaining part of earnings after the payment of cash dividends, i.e., retained earnings, are reinvested in the business for the benefit of the shareholders. Retained earnings increase the net assets, or stockholders’ equity, of a company. The increase in stockholders' equity from retained earnings often equates to a specific increase in the true corporate value of a company, especially when the retained earnings result in a similar increase in a company's cash or a decrease in its debt.
Reinvestment of retained earnings in business assets and projects which earn high returns can increase true corporate value by amounts exceeding the actual retained earnings. A company with a low price/earnings ratio, by definition, must provide the investor with either an above-average cash dividend yield, or an above-average retained earnings yield, or both. Similar to stocks selling at low prices in relation to net current asset value and book value, the shares of a company with a low price/earnings ratio are often accumulated by the officers and directors, or by the company itself. The company’s stock price has frequently declined significantly.
Benjamin Graham’s Low Price/Earnings Ratio Stock Selection Criteria
Henry Oppenheimer, in “A Test of Ben Graham's Stock Selection Criteria,” Financial
Analysts Journal, September/October 1984, examined the investment performance of
the low price/earnings ratio stock selection criteria developed by Benjamin Graham.
Benjamin Graham's stock selection criteria called for the purchase of securities of companies in which the earnings yield (i.e., the reciprocal of the price/earnings ratio) was at least twice the AAA bond yield, and the company's total debt (i.e., current liabilities and long-term debt) was less than its book value. Graham also advised that each security which met the selection criteria be held for either two years, or until 50% price appreciation occurred, whichever came first.
Henry Oppenheimer screened securities listed on the New York and AMEX to select those issues that met Graham's criteria on each March 31 from 1974 through 1980. An investor who had employed Graham's criteria during this period achieved a mean annual return of 38% as compared to 14% per year, including dividends, from the market index (Center for Research in Securities Prices’ (CRSP) index of NYSE-AMEX securities). Table 16 shows the study results by holding period.
Table 16: Benjamin Graham’s Price/Earnings Ratio Criteria Holding Period
Ben Graham Low P/E Annualized
Return Annualized ReturnNYSE – AMEX Mean Firm Size (Millions) Median Firm Size (Millions)
4/74 – 3/76 26.16% 11.28% $178.8 $27.8
4/75 – 3/77 38.40 14.76 368.9 40.4
4/76 – 3/78 25.56 0.60 175.0 38.8
4/77 – 3/79 29.64 9.96 62.3 33.1
4/78 – 3/80 29.16 14.88 460.6 46.5
4/79 – 3/81 32.28 23.04 183.9 61.5
4/80 – 12/81 46.68 18.00 573.1 131.0
Small Market Capitalization Low Price/Earnings Ratio Companies as Compared to Large Market Capitalization Low Price/Earnings Ratio Companies
Sanjoy Basu examined the effects of market capitalization and price/earnings ratios on investment returns in “The Relationship Between Earnings Yield, Market Value and Return for NYSE Common Stocks,” Journal of Financial Economics, December 1983. Professor Basu ranked all companies listed on the NYSE according to price/earnings ratios and sorted the companies into quintiles. Then, each quintile was ranked according to market
capitalization and sorted into sub-quintiles within each of the price/earnings ratio groups. This process occurred as of each April 30 from 1963 through 1980 (a 17-year period ended April 30, 1980) and the annual investment returns were computed. Table 17, on the following page, shows the results of this study.
Table 17: 1963 through 1980 Annual Investment Returns for Low versus High
Price/Earnings Ratio Stocks According to Market Capitalization within Each Price/Earnings Ratio Category for New York Stock Exchange Listed Companies Market
Capitalization Category
Price/Earnings Ratio Category (Lowest P/E)
1 2 3 4 (Highest P/E) 5
1 (Smallest) 19.1% 16.3% 14.8% 11.6% 14.4%
2 18.1 14.5 9.5 8.2 9.8
3 17.2 13.2 9.6 7.6 6.1
4 15.5 13.3 10.3 7.8 6.6
5 (Largest) 13.1 10.8 7.9 6.6 6.4
One million dollars invested in the smallest fifth of the companies listed on the NYSE, which were priced in the bottom fifth in terms of price/earnings ratios, would have increased to $19,500,000 over the 17-year study period. By comparison, $1,000,000 invested in the largest market capitalization stocks with the lowest price/earnings ratios would have increased to $8,107,000 over the same period. During the period, the annual investment returns for the market capitalization weighted and equal weighted NYSE indexes were 7.68% and 12.12%, respectively. One million dollars invested in the market capitalization weighted and equal weighted NYSE indexes would have increased to
$3,518,000 and $6,992,000, respectively.
Dreman Value Management, L.P., in conjunction with Professor Michael Berry of James Madison University, examined the relationship between market capitalizations,
price/earnings ratios and annual investment returns over a 20½-year period ended October 31, 1989. Each year, all companies in the Compustat database (approximately 6,000 companies during this period) were ranked according to market capitalization and sorted into quintiles. Then, the stocks within each market capitalization quintile were ranked according to price/earnings ratios and sorted into sub-quintiles. The investment return over the following year was calculated for each stock. The average annual investment returns are presented on the following page in Table 18.
Table 18: Small is Better: Annual Investment Returns for Low Versus High Price/Earnings Ratio Stocks within Market Capitalization Categories for the 20½-Year Period Ended October 31, 1989
Market Capitalization Category
Average Market Cap October 31, 1989
(Millions)
Price/Earnings Ratio Category (Lowest P/E)
1 2 3 4 (Highest P/E) 5
1 (Smallest) $46 18.0% 15.3% 10.2% 7.0% 4.1%
2 127 15.7 13.7 10.0 6.5 7.4
3 360 17.0 15.1 10.6 7.4 8.2
4 1,031 13.8 12.9 10.3 8.5 7.1
5 (Largest) 5,974 13.0 12.4 9.1 10.5 8.7
One million dollars invested in the lowest price/earnings ratio companies within the lowest market capitalization group in 1969 would have increased to $29,756,500 on October 31, 1989. By comparison, $1,000,000 invested in the highest price/earnings ratio companies within the smallest market capitalization group would have increased to $2,279,000 over this 20½-year period. One million dollars invested in the largest market capitalization, lowest price/earnings ratio group over this period would have increased to $12,272,000. Five-Year Holding Period Year-by-Year Investment Returns for Low
Price-to-Earnings Companies as Compared to High Price-to-Earnings Companies Josef Lakonishok, Robert W. Vishny and Andrei Shleifer examined the effect of
price/earnings ratios on investment returns in “Contrarian Investment, Extrapolation and Risk,” Working Paper No. 4360, National Bureau of Economic Research, May 1993. The professors ranked all companies listed on the NYSE and the AMEX according to stock price/earnings ratios and sorted the companies into deciles. Portfolios were initially formed on April 30, 1968, and new portfolios were formed on each subsequent April 30. The study period ended on April 30, 1990. The decile portfolios were held for five years, and the average annual year-by-year investment returns, the average annual five-year returns and the average cumulative total five-year returns were calculated. The investment returns were equal-weighted. Table 19, on the following page, shows the results of the study.
Table 19: Investment Returns in Relation to Price/Earnings Ratios for All New York Stock Exchange and American Stock Exchange Listed Companies,
April 1968 – April 1990
Price/Earnings Ratio Decile Holding Period Following
Portfolio Formation
(Highest Price/Earnings Ratio) (Lowest Price/Earnings Ratio) 1 2 3 4 5 6 7 8 9 10
1stYear 12.3% 12.5% 14.0% 13.0% 13.5% 15.6% 17.0% 18.0% 19.3% 16.2%
2ndYear 10.1 11.3 12.4 14.3 16.7 16.4 18.0 18.5 18. 3 17.4
3rdYear 11.8 13.8 15.7 17.1 17.1 19.1 19.8 18.8 18.8 19.5
4thYear 11.1 12.4 14.5 15.1 15.7 15.9 19.8 19.9 20.5 21.4
5thYear 11.9 12.9 15.1 16.7 17.1 16.8 19.6 20.1 21.1 20.7
Average annual return
over the 5-year period 11.4 12.6 14.3 15.2 16.0 16.7 18.8 19.1 19.6 19.0 Cumulative 5-year
total return 71.7 80.8 95.3 103.1 110.2 116.8 137.0 139.3 144.6 138.8
Low Price/Earnings Ratio Stocks Yield Sizeable Excess Returns Net of Transaction Expenses
In a study published in The Journal of Economics and Statistics (May 1997) entitled, “The Predictability of Stock Returns: A Cross-Sectional Simulation,” Zsuzsanna Fluck (New York University), Burton G. Malkiel (Princeton) and Richard E. Quandt (Princeton) examined the performance of 1,000 large-company stocks ranked by price/earnings and price-to-book value ratios from 1979 through 1995, and confirmed the findings of the previous Lakonishok, Shleifer and Vishny study, “Contrarian Investment, Extrapolation and Risk,” finding that low
price/earnings and low price-to-book value strategies yield sizeable excess returns net of transaction costs and after adjusting for risk.
As shown in Table 20, Fluck, Malkiel and Quandt constructed a data sample from Compustat for the period mid-1979 through 1988 and for the period between 1989 through mid-1995 consisting of the 1,000 largest U.S. companies sorted and ranked into deciles based on their prices in relation to earnings. They found for the period mid-1979 through 1988 that the lowest price/earnings ratio decile, which was rebalanced quarterly, produced 1.82% of excess return quarterly, or 7.28% annualized, over the average return of the entire data sample. This translated into an annual return for the low price/earnings ratio decile of 25.28% versus 18.00% for the Compustat sample. Conducting the same study for the period 1989 through mid-1995 produced similar results with the low price/earnings ratio decile producing returns
20.4% for the low price/earnings ratio decile versus 16.4% for the sample. In addition, they found that the excess return persisted even after performing portfolio simulations which took into consideration transaction expenses associated with purchases and sales. The low
price/earnings ratio decile for the periods 6/1979 – 12/1988 and 1/1989 – 6/1995 produced returns annually that were 5.6% and 1.6% better, respectively, than the sample and 8.4% and 4.4% better, respectively, than the S&P 500, net of transaction expenses.
Table 20a: Mean Return by Decile Sorted by Price/Earnings Ratios (6/1979 – 6/1995)
(Low P/E Ratio) Deciles (High P/E Ratio)
1 2 3 4 5 6 7 8 9 10 SampleAvg. (6/1979 – 12/1988)
Average quarterly return 6.32% 6.05% 5.24% 4.88% 4.75% 3.89% 3.99% 3.06% 3.29% 3.11% 4.5%
Q* 26 28 25 24 23 13 16 10 12 15
(1/1989 – 6/1995)†
Average quarterly return 5.1% 6.48% 5.52% 5.04% 3.33% 3.1% 3.89% 4.07% 2.12% 1.9% 4.1%
Q* 14 17 18 13 8 9 11 12 6 5
* Q is the number of quarters in which the decile return exceeds the sample average. † Survivorship bias-free Sample
Table 20b: Returns Net of 25 Cents Trading Costs (6/1979 – 6/1995)
Low P/E Ratio Average Quarterly Return S&P 500 Sample of 1,000 Companies
Low P/E ratio
(6/1979 – 12/1988) 5.9% 3.8% 4.5%
Low P/E ratio
(1/1989 – 6/1995) 4.5 3.4 4.1
Companies in the United Kingdom, France, Germany, and Japan Trading at Low Prices in Relation to Earnings
John R. Chisholm examined price in relation to earnings and investment results for companies in the United Kingdom, France, Germany and Japan in “Quantitative
Applications for Research Analysts,” Investing Worldwide II, Association for Investment Management and Research, 1991. A data set, which was described as being comprised of fairly liquid, buyable companies, was ranked at the end of each year according to
price/earnings ratios and sorted into quintiles. The study period was December 31, 1974 through December 31, 1989 (15 years). Equal investments were assumed to have been made in each stock, and the stocks were assumed to have been sold after one year. The results were U.S. dollar results. Table 21, on the following page, shows the annual compound returns for the top and bottom quintiles.