An NCPR Working Paper
High School Dual Enrollment Programs:
Are We Fast-Tracking Students Too Fast?
Cecilia Speroni
Mathematica Policy Research and Community College Research Center
December 2011
The National Center for Postsecondary Education is a partnership of the Community College Research Center, Teachers College, Columbia University;
MDRC; the Curry School of Education at the University of Virginia; and faculty at Harvard University.
The National Center for Postsecondary Research (NCPR) was established by a grant (R305A060010) from the Institute of Education Sciences of the U.S. Department of Education. This report is based on a chapter of the author’s PhD dissertation. The contents of this paper were developed under a grant (R305A060010) from the Institute of Education Sciences, U.S. Department of Education, and a grant from the Association for Institutional Research (DG #09-288). The findings and conclusions in this paper do not necessarily represent the official positions or policies of the funders. The contents of this paper do not necessarily represent the policy of the Institute of Education Sciences or the Department of Education, and you should not assume endorsement by the federal government.
The author thanks the staff of the Florida Department of Education and the Florida K-20 Education Data Warehouse for providing the data used in this paper.
iii
Abstract
Dual enrollment (DE), an arrangement by which high school students take college courses, is becoming increasingly popular as a means of improving high school education. However, there is very little rigorous evidence on its impact on student outcomes. A particular concern in evaluating its effects is the selection bias that arises because more able students are more likely to take DE courses. In this study, I employ a quasi-experimental method to gauge the causal effects of DE on student outcomes. I conduct two regression discontinuity analyses that exploit a statutory mandate in the state of Florida requiring high school students to have a minimum academic standing in order to participate in DE. The first analysis evaluates the effects of DE using GPA as the eligibility criterion. The second analysis evaluates the effects of a particularly challenging and popular DE course, college algebra, using an eligibility criterion that is specific to that course. While the standard regression-discontinuity methods are appropriate for the first analysis, the participation criterion for college algebra is used not only for DE students but also for college students. I therefore employ an extension of the regression-discontinuity method that accounts for sequential treatments. Using data on students from two high school cohorts (2000–01 and 2001–02) in selected Florida districts who were tracked through the summer of 2007, I find no evidence that simply taking a DE course improved marginal students’ rates of high school graduation, college enrollment, or college degree attainment. However, for students on the margin of participation in algebra, I find that taking such a challenging DE course had large and significant effects on college enrollment and graduation rates.
v
Contents
Abstract iii
List of Exhibits vii
1. Introduction 1
2. Dual Enrollment Program 5
Dual Enrollment Conceptual Framework 5
Florida’s Dual Enrollment Policy 6
Florida’s Dual Enrollment Eligibility and Enrollment Process 7
3. Data 9
Outcome Measures 11
4. Econometric Framework: Standard RD and Sequential RD Design 15 The Intuition Behind the RD Approach: A Numerical Example 15
Standard RD Estimation 17
Sequential RD Estimation 18
5. Validity of the RD Design 21
Discontinuity: The GPA and CPT Samples 21 Descriptive Statistics for Selected Samples 26
Instrument Validity 26
Discontinuity in Other Treatments 32
6. Results 37
Effect of Dual Enrollment on Academic Outcomes 37 Effect of Dual Enrollment Algebra on Academic Outcomes 42
7. Robustness 49
Robustness for GPA Analysis 49
Robustness for CPT Analysis 53
8. Conclusion 55
Appendix A: Supplementary Tables 57
vii
List of Exhibits
Table1 Descriptive Statistics of Dual Enrollment Participants and Non-Participants 13 2 Descriptive Statistics for Dual Enrollment Participants 27 3 Discontinuity in Baseline Characteristics and Participation in Other High School
Programs by Sample 28
4 Regression Discontinuity Estimates of the Effect of Dual Enrollment (DE-Basic)
on Student Outcomes, GPA Sample 39
5 Assessing the Matching Quality, CPT Sample 42 6 Regression Discontinuity Estimates of the Effect of DE Algebra on Student
Outcomes, CPT Sample 45
7 Sensitivity of Dual Enrollment Effect to Sample Selection and Model Specification 50 A.1 Estimated Discontinuity in Dual Enrollment (Any Course) in 12th Grade by
Community College 57
A.2 Estimated Discontinuity in Participation in Dual Enrollment Algebra by College 59
Figure
1 DE Participation and Outcomes as a Function of a Score (Hypothetical Example) 16
2 DE Participation in 12th Grade 24
3 DE-Algebra Participation 25
4 Distribution of 11th Grade High School GPA in GPA Sample 30 5 Distribution of 11th Grade High School GPA in Placebo Sample 31 6 Distribution of CPT Math Scores in CPT Sample 32 7 CPT Math Scores Relative to Placement Cutoffs 34 8 Participation in Algebra During First Term in College 35 9 Student Outcomes by 11th Grade High School GPA 41 10 Student Outcomes by CPT Math Score 44
1
1. Introduction
Roughly one third of high school graduates do not enroll in postsecondary institutions, and a third of those who do are required to enroll in remedial education to prepare for college-level work (National Center for Education Statistics [NCES], 2003, 2004). One type of program designed to address these educational shortcomings is dual enrollment (hereafter DE), an arrangement by which high school students (typically juniors and seniors) enroll in college courses and earn college credits. Proponents of DE believe that participation may promote college enrollment and completion by giving students a stronger preparation and a realistic idea of what college academics are like. However, it is also the case that DE programs could potentially discourage those students who are academically or emotionally unprepared to handle the demands of college — or they may have no effect on college enrollment and completion if they only serve college-bound students.
While there are no nationwide statistics on the growth of DE programs, the National Center of Education Statistics estimates that about 5 percent of all high school students (nearly a million students) took a college course during the 2002–03 school year (Kleiner & Lewis, 2005) and that about 71 percent of all public high schools offer DE programs (Waits, Setzer, & Lewis, 2005).1 The current paper analyzes data from Florida, where about
14 percent of high school students take at least one college course via DE.2
Despite the prevalence of DE programs, there is little quantitative evidence on their effectiveness. Two extensive reviews of the literature (Bailey & Karp, 2003; Lerner & Brand, 2006) concluded that there is no sound evidence that DE programs contribute to students’ college access and academic success. Assessing the impact of DE is difficult because of the well-known problem of selection bias. The selection problem is twofold: high school students choose to take college courses based on their academic ability, motivation, and expected gains from participation; colleges are also allowed to set their own admission requirements to ensure the integrity of their academic programs. In addition, students who have already decided to go to college would likely consider DE an attractive
1 Part-time enrollment growth for students under the age of 18 at public two-year colleges — presumably DE students — could be taken as evidence of a rapid expansion. Between 1995 and 2005, enrollment figures at public two-year colleges for part-time students under age 18 more than doubled (NCES, 1995, 2006), while high school enrollment grew only about 19 percent over the same time period (NCES, 2008).
2 DE is the second largest high school acceleration program after Advanced Placement. About 20 percent of Florida students take an Advanced Placement course.
2
way to obtain a head start on accumulating credits, causing a spurious correlation between participation and outcomes.
In an effort to statistically control for students’ differences, a handful of studies have employed a regression framework, though the availability and quality of the data used varied considerably (e.g., Crook, 1990; Eimers & Mullen, 2003; T. G. Goodman, Lathan, Copa, & Wright, 2001; Karp, Calcagno, Hughes, Jeong, & Bailey, 2007; Kim, 2006; Nitzke, 2002; Swanson, 2008).3 DE participation has been found to be strongly positively
associated with nearly every educational outcome studied. For example, using data from 2000–01 and 2001–02 high school graduating cohorts, Karp et al. (2007) found that, compared with non-DE students, DE students in Florida were 17 percentage points more likely to enroll in college and 8 percentage points more likely to initially enroll in a four-year institution, among other positive outcomes. The study controlled for characteristics that are likely correlated with both DE participation and students’ outcomes, such as race, gender, academic background, free or reduced-price lunch status at school, and school demographics. While these findings are encouraging, a more rigorous analysis is needed.
This paper constitutes the first attempt to use a quasi-experimental method, namely the regression discontinuity (RD) design, to gauge the causal effect of DE on students’ likelihood of high school graduation, college enrollment, and college completion.4 I exploit
a statutory mandate in Florida that restricts enrollment, generating a source of plausible exogenous variation in DE participation. Florida’s policy mandates that students have a minimum grade point average (GPA) in high school in order to take a DE course and, for enrollment in specific courses such as college algebra, have a minimum score on a college placement test (CPT). I exploit both features of the policy in two separate RD analyses.
3 Apart from the potential failure to properly account for the selection problem, the DE literature suffers from two additional shortcomings — both highlighted by Jackson (2010) in the literature on Advanced Placement. First, all studies estimate regressions that control for variables determined after DE participation, such as overall high school grade point average, placement tests taken in college, college choice, or enrollment patterns. Controlling for post-treatment variables, which may be affected by DE participation, may induce bias in the estimation of the treatment effect in a regression framework. The second limitation derives from the fact that studies, aiming to uncover the effect of DE on college outcomes, restrict the sample of analysis to college-goers. To the extent that DE affects students’ likelihood of going to college, comparisons of DE and non-DE groups lack a valid causal interpretation (see Angrist and Pischke [2009] for a description of the problem). Both of these shortcomings are often inevitable due to data limitations; most data for these studies are derived from college transcript files. Even high-school-to-college longitudinal datasets, such as the National Education Longitudinal Study of 1988 (NELS:88), have this limitation because they identify DE courses from college transcripts, which were collected exclusively for students who enroll in college after high school.
4 The regression discontinuity approach is increasingly being used to assess causal impact of interventions in observational studies, both in education and elsewhere. Imbens and Lemieux (2008) and Lee and Lemieux (2010) provide two recent surveys of the methods.
3
I first examine the effect of taking at least one DE course, exploiting the GPA eligibility requirement. With the exception of a few courses (typically in math and English), an eligible GPA suffices for placement into most freshman community college courses. Because GPA by itself cannot strongly predict participation in courses with additional test requirements, this analysis captures the average effect of all other DE courses, for which eligibility is determined based on GPA. Hence, I refer to this analysis as the effect of DE-basic. While this effect is of interest in its own right, DE encompasses a wide range of course experiences, which vary in difficulty and subject area. Owing to the generality of the GPA requirement, this analysis cannot identify the effect of any particular course. A more nuanced understanding of the potential effect of DE as a policy intervention would require assessing the heterogeneity of the effect across various DE courses. To this end, I conduct a second RD analysis that examines a particularly challenging course, college-level algebra, which is the second most popular DE course after English composition.5
The second RD analysis exploits the course-specific CPT requirement for enrollment in algebra. An important analytical complication in measuring the effect of DE-algebra derives from the fact that the CPT math requirement is the same for both high school and college students. Thus, an eligible student who does not take the course through a DE program in high school can still take the course in college. Standard RD estimation cannot accommodate the presence of a second treatment discontinuously changing at the same cutoff and therefore cannot disentangle the effect of algebra in high school from the effect of algebra in college. Therefore, I use a sequential matching estimator that extends the traditional RD identification strategy to situations where a subsequent treatment also changes discontinuously at the eligibility cutoff (Speroni, 2011). This sequential RD approach is able to determine whether any observed effect on outcomes experienced after college can be attributed solely to the DE experience.
I estimate the effect of DE in a subset of Florida’s districts where there is empirical evidence that the eligibility requirements for participation are binding. Using both high school and college transcripts for the 2000–01 and 2001–02 graduating high school cohorts, I find little indication that taking a DE-basic course significantly affected educational progress among students with a high school GPA on the margin of eligibility. The point estimates are generally negative, though I cannot consistently reject the hypothesis that
5 While English composition also has a CPT requirement for enrollment, the cutoff used for placement into this course also determines whether a student should enroll in remedial courses — non-credit-bearing courses designed to help prepare academically underprepared students for college-level work. CPT retesting among students who initially score just below Florida’s cutoff for placement into college-level English has been documented in most colleges, raising concerns about the validity of an RD design in assessing the impacts of this course (Calcagno & Long, 2008). In contrast, the cutoff score used for placement into college algebra is higher than the one used for math remediation.
4
taking DE had no effect across outcome measures. Drawing from a subsample of students who took Florida’s CPT, however, I find that taking college-level algebra in high school had a substantial influence on students’ likelihood of going to college and obtaining a college degree, with some indication of positive effects on high school graduation. Specifically, I find that taking DE-algebra increased college enrollment by about 16 percentage points (standard RD estimate) and both associate and bachelor’s degree attainment by about 23 percentage points (sequential RD estimates).
Taken together, these findings suggest that DE programs have the potential to increase college enrollment and completion but that the quality, subject area, or level of difficulty of the DE experience might influence the value of DE programs as a policy intervention. It is important to highlight, however, that the RD estimates only speak to the local effect of DE among students on the margin of eligibility and may not be representative of the gains from participation for students with different academic preparation. In addition, the two RD analyses inevitably draw inferences from different sets of students, and I cannot rule out the possibility of DE impact heterogeneity with respect to students’ characteristics, in addition to the subject area or quality of the DE experience.
The remainder of the paper is organized as follows. Section 2 provides background information on DE programs, the potential mechanisms by which they affect students’ outcomes, and Florida’s DE policy. Section 3 describes the data. Section 4 explains the empirical strategy. Section 5 discusses the validity of the RD assumptions. Section 6 presents the main results, and Section 7 provides robustness checks. Section 8 concludes the paper.
5
2. Dual Enrollment Program
DE differs from other high school programs that allow high school students to earn college credits, such as Advanced Placement (AP), International Baccalaureate (IB), or the more recently established Advanced International Certificate of Education (AICE).6 The
main difference is that DE consists of a regular college course that grants credit to students who pass. Other programs follow a standardized college-level curriculum, and college credits are only obtained with a satisfactory score on an external (often optional) end-of-course examination. Because some DE end-of-courses are taught at high school campuses, not all involve a true college experience, with high school students and college students in the same classroom. Nevertheless, DE instructors must meet the faculty qualifications for an adjunct community college instructor in most states.
Dual Enrollment Conceptual Framework
There are several potential channels through which a DE experience could foster college access and success. First, DE might help students build human capital by providing a broader and more rigorous curriculum than traditional high school courses, facilitating the “academic transition” to the demands of college (Bailey, Hughes, & Karp, 2002). Second, DE could have a signaling value for students preparing for admission at selective colleges, as it conveys information about students’ abilities and motivation, mitigating the information asymmetry in the college application process. Third, DE could potentially give students more accurate information about the institutions and their own college readiness, providing an early call to strengthen their skills in particular areas if necessary. Consistent with the theory of “schooling as experimentation” (Manski, 1989), DE would allow students to “test the waters” in college before making their postsecondary school choice. This may translate into better matches between students and institutions and may improve college persistence and degree completion (Light & Strayer, 2000). Last, by reducing the cost of college, DE might also foster college access. By enrolling in DE, students can reduce the time (and forgone earnings) required to get a college degree and, in states with subsidized DE programs, the direct cost of a degree. These financial benefits might be a key factor influencing the decision to pursue a college degree among low-income students (Greenberg, 1988). In addition, DE might help students make the “psychological transition” to college demands (Bailey et al., 2002).
6 While the College Level Examination Program (CLEP) is also considered an acceleration mechanism, unlike the others, it does not involve enrolling in a course, and the college credit students earn in the program does not count toward high school graduation.
6
While DE can be viewed as a potential tool to increase college access and success, it is not without controversy. A common concern about DE programs is that they might lower students’ self-esteem and educational aspirations. It is not clear that students who are marginally successful in high school can do college-level work (Bailey & Karp, 2003). Course failure might discourage these students from pursuing postsecondary education altogether or set them on a nonacademic path. Given that DE programs are mostly offered through two-year colleges, the DE experience might also induce students who would have otherwise attended a four-year college after high school graduation to enroll in community colleges. This may reduce their educational attainment due to high transfer costs and a possible lack of emphasis on bachelor’s degree attainment at community colleges, among other barriers. In addition, the ability of DE programs to provide college-level curricula has been questioned (e.g., Johnstone & Del Genio, 2001). Allowing high school students into college classes could also dilute the quality of education at the college campus, and many observers are skeptical about the quality of DE courses taught by high school teachers at the high school campus.
Florida’s Dual Enrollment Policy
Florida has been at the forefront of many innovations in educational policy, including DE. Florida is one of six states that pay for DE courses, while most other states require the school district or the students themselves to pay for them (Western Interstate Commission for Higher Education [WICHE], 2006). This funding provision not only promotes program participation but also enables access for students from low-income households. In addition, Florida funds both high schools and colleges for DE courses (Office of Program Policy Analysis and Government Accountability [OPPAGA], 2006), encouraging schools to support students’ participation.
Florida is also one of only 15 states that allow students to earn high school and postsecondary credit simultaneously and guarantee that the credit counts toward high school graduation requirements (WICHE, 2006). Successfully completed DE courses may apply toward the requirements necessary to earn a certificate or degree, thereby shortening the time it takes to earn a postsecondary award. Florida has also developed a statewide course numbering system that eases the transfer of credits among the state’s public institutions. Since 2006, the legislature has required the state’s public universities to weight DE courses the same as AP, IB, or AICE courses when calculating students’ GPAs for admissions decisions. This policy, coupled with the fact that students in Florida are exempt from the payment of registration, tuition, books, and laboratory fees related to DE courses, makes the DE program an attractive acceleration mechanism.
7
Florida’s strong support for DE has been crystallized in a widespread program, with each of the 28 community colleges in the Florida College System having an articulation agreement in place with its serving district and all school districts taking advantage of such possibility. DE is the second most popular acceleration mechanism (AP is the first). Overall, about 14 percent of the high school students in this study took at least one academic DE course, while 20 percent took AP and 3 percent IB.
Florida’s Dual Enrollment Eligibility and Enrollment Process
To be eligible for DE in Florida, students are required to have a minimum unweighted GPA of 3.0 and to demonstrate college readiness on the College Placement Test (CPT) (Florida Statute 1007.271).7 The statute does not specify which portions of the CPT
are appropriate for admission into specific courses. However, common practice has been to set the same requirements for both DE and regular college students.8 That is, while all
candidates need to take a placement test, only a few college courses (typically in math and English) have a minimum score requirement for enrollment. In particular, students must pass the math or English portion of the CPT before enrolling in math or English courses, and they must fulfill any course prerequisites when required.9 Colleges must use statewide
cutoff scores for placement into certain introductory courses, such as intermediate algebra or freshman English composition, but are free to define the cutoffs for placement into more advanced courses. For example, students can bypass intermediate algebra and place directly into college algebra, a particular course analyzed in this paper, provided they meet the college-specific cutoff score.
Students can only take DE courses through their local community college.10 Each
community college has formal agreements with the school districts in its attendance area about the requirements for participation. I compiled DE agreements and college catalogs for
7 The statute also stipulates a minimum unweighted GPA of 2.0 for DE vocational courses. Vocational DE students are a small and distinct group; very few students enroll in both vocational and academic courses. Unfortunately, a separate RD analysis on vocational DE courses is not feasible due to small sample sizes.
8 The only difference between DE and regular college students is that DE students whose CPT placement score is below the state minimum required score for “college-readiness” (defined in Rule 6A-10.0315) are not allowed to enroll in remediation. Remedial courses and physical education courses are excluded from the DE program.
9 The Florida College Entry-Level Placement Test (CPT) is a computer adaptive test developed by the College Board at the request of the Florida Department of Education to establish common standards across community colleges. Students are allowed to substitute appropriate SAT or ACT scores for CPT scores.
10 Some four-year colleges offer DE, but their courses are not subsidized by the state, and participation rates are very low.
8
the years relevant to this study. Most colleges set their GPA requirements at the minimum of 3.0 required by statute. The statute also allows districts and colleges to make exceptions to the GPA requirement or set additional admission criteria for participation if they are included in their inter-institutional articulation agreement. Exceptions are generally granted on a case-by-case basis by the college DE coordinator and the high school counselor or principal. The most common additional admission requirement is a letter of recommendation from a teacher or counselor (required by about 65 percent of the districts, according to Florida Board of Education [2003]). Only a few colleges place restrictions based on students’ age or grade level.
The application process for DE courses involves close interaction between students and their high school counselors. Based on students’ scores and career goals, counselors help students choose appropriate courses and complete the application form. The form, typically a one-page document, includes a student’s personal information and course selection choices and a statement (often signed by the high school counselor) of the student’s current GPA and CPT scores. Students and parents sign the application and allow the release of students’ scores and high school transcript to the college. After the application form is submitted, the student is considered a college student and is subject to the same standards as a regularly matriculated student.
9
3. Data
This study uses data from the Florida Department of Education, which includes all public school students in the 2000–01 and 2001–02 high school senior cohorts and tracks their postsecondary outcomes in the state’s public system through summer 2007. The state’s administrative records provide transcript information on courses taken and grades received in high school and college. The data contain basic demographic characteristics, such as gender, race, English language proficiency, and free lunch eligibility, as well as students’ 10th grade state standardized test scores (from the Florida Comprehensive Assessment Test, or FCAT) and college placement test scores. State records on postsecondary enrollment (though not degree attainment) are complemented with data from the National Student Clearinghouse (NSC), which tracks postsecondary enrollment of students as they enroll in out-of-state colleges or private institutions.11 District characteristics, such as median income
and urbanicity, are obtained from the 2000 Common Core Data and decennial census.12
There are two key features of the data that are particularly relevant for a study of DE. First, the data track individual students as they transition from high school to college. Most previous studies on DE use college transcript records and therefore restrict the analysis to students who go to college. Given that DE might change the composition of students who go to college, limiting the sample to college-goers induces sample selection bias, though the direction of this bias is unclear. Not only might DE students who go to college differ from those who do not, but they also might differ from non-DE students who go to college without the program’s help. Second, the data contain a unique identifier for DE courses, indicating their location (high school or college campus) and type (academic or
11 Because the NSC data are limited to enrollment, degree attainment is only identified for students who enrolled in Florida’s public higher education system. In order to address this missing data problem, I follow the standard approach of imputing zero when students have no postsecondary records. This approach would induce bias in an RD estimation if students who score just above the DE eligibility cutoff were disproportionately more likely to attend college out-of-state or in one of Florida’s private institutions than students who score just below the cutoff. However, Table 3 shows that the probability of enrolling outside Florida’s public postsecondary sector does not significantly change at the DE eligibility cutoff. In addition, the number of students who would be incorrectly classified as not having a college degree is likely to be small because only 7.7 percent of the students in the full sample went to college outside Florida and 4.5 percent attended a Florida private institution.
12 This study uses the same cohort of students used by Karp et al. (2007) but employs an augmented dataset that includes 10th grade standardized test scores (FCAT), college placement test scores, and NSC data. In addition, the data in this paper track students for two additional years, allowing sufficient time to evaluate the effect of DE on college degree attainment. I follow, however, different sample restrictions: I (1) define DE students as those who took at least one academic DE course (i.e., not vocational courses) and (2) identify DE using college transcripts instead of high school education in Florida (grades 10 through 12) in order to accurately calculate the cumulative GPA.
10
Identifying DE students, course location, and course type is often challenging when only college transcripts are available. The difficulty arises because not all students transfer their DE credits, and when they do, credits are recorded as transfer credits, requiring high school graduation dates (which are not always available in college transcripts) to accurately identify DE credits.
I collected GPA eligibility requirements for DE from the inter-institutional articulation agreements between the districts and colleges, personal communication with DE coordinators, and directly from the college catalogs for the years relevant for the study. The CPT cutoff scores for placement into the college algebra course are obtained from the college catalogs or, when unavailable, from state documentation on placement scores (Florida Department of Education, Articulation Coordinating Committee, 2006).13
Appendix tables A.1 and A.2 provide a list of requirements by college.
I examine the effect of DE with two separate RD analyses. The first analysis measures the effect of taking at least one academic DE course (regardless of subject area), exploiting the general GPA eligibility requirement for participation in the program.14 A
course is considered academic if it counts toward the requirements of an associate degree, as opposed to vocational courses that are only applicable toward certificates. I focus on participation in 12th grade because that is when most DE experiences take place: 82 percent of DE students took a DE course in their senior year.15, 16 It is important to highlight that,
despite “treatment” being defined as “any course,” this analysis only captures variation in DE participation that is generated by the GPA cutoff requirements, largely excluding
13 To the extent that cutoff scores changed between 2000 and 2006, the college would be excluded from the analysis due to no discontinuity in participation at the mis-specified cutoff. Visual inspection of the data, however, rules out strong evidence consistent with the use of alternative cutoffs in all but one college, whose cutoff was changed accordingly.
14 I exclude academic DE courses taken within the state university system, at special education centers, or on a full-time basis (i.e., early enrollments). Only about 0.7 percent of all DE courses are not directly offered by a community college, and about 2.5 percent are early enrollments. These courses are typically subject to different eligibility requirements. DE courses with missing enrollment data are also excluded.
15 The data do not provide enough variation in course-taking patterns to identify the effect of taking DE at different times in high school (e.g., junior or senior year). Most DE students took DE exclusively in 12th grade (about 55 percent); the majority of the remaining students took DE in both 11th and 12th grade.
16 One potential drawback of the data is that they only include the cohort of students who persisted to 12th grade and do not include data on students who dropped out earlier. To the extent that previous DE experience contributed to early dropout behavior, the estimation of the effect of DE will be biased. However, the incidence of DE participation before 12th grade is low (less than 6 percent of all students), and it is unlikely that at-risk students would be on the margin of eligibility for DE because academic requirements for participation are relatively high.
11
valuable information about other courses that have additional test requirements. While most college courses do not have a test requirement, a few (typically math, English, and some science courses) do. I refer to this analysis as the effect of DE-basic.
The second RD analysis examines the effect of taking one particular challenging DE course, college algebra, which covers topics such as graphing functions and solving systems of equations and is the first course in the math sequence that counts toward Florida’s statewide requirements for an associate degree. This analysis exploits the course-specific CPT math score requirement for participation.17 One limitation of the placement
test data is that for the cohorts used in this study, the state only kept a record of a student’s highest score (if the test was taken multiple times) and did not collect information about the test date, making it impossible to infer whether the test was used for eligibility in high school or college. However, students whose scores were not used for eligibility do not generate variation in DE participation and thus are not a concern to the identification. In addition, by examining the density of the score, I show in Section 5 no evidence of “re-testing bias” being present in the sample analyzed. Because of the absence of test-date information, I define treatment as taking DE-algebra in either 11th or 12th grade, covering 93 percent of all course-takers.
Outcome Measures
This paper measures the effect of DE on several academic outcomes. The first outcome of interest is high school graduation, which includes all types of diplomas offered in Florida (regular or special education diplomas, certificates of completion, and GEDs). Second, I examine the effect of DE on college enrollment using two measures: whether students enrolled in either a two-year or four-year college after high school graduation and whether they first enrolled in a four-year college. The availability of National Student Clearinghouse data allows me to observe college enrollment for students at public and private institutions both in-state and out-of-state. Last, I examine the effect of DE on college completion as measured by the likelihood of obtaining an associate degree, a bachelor’s degree, or either an associate or bachelor’s degree within five years from when the high school cohort was expected to start college. The empirical approach in this paper is to include in the sample all high school students and assign a value of zero on college degree outcomes for students who do not go to college. The effect on college degree
17 While students are allowed to substitute appropriate SAT or ACT scores for CPT scores, I only exploit the variation in participation that comes from the CPT because that is the test where most of the variation in participation at the cutoff is observed.
12
outcomes represents the overall effect of DE, combining its effects on college enrollment and academic performance.
Table 1 shows descriptive statistics broken down by DE participation status. DE is a voluntary program, and participants are very different from non-participants. DE students are more likely to be female, White, native English speakers, and from economically advantaged households (as proxied by free or reduced-price lunch status) than non-DE students. DE students also appear to be more academically prepared than non-DE students, based on their 10th grade standardized test scores in reading and math and their high school GPAs. Given these differences, it is not surprising that DE students were more likely to experience positive postsecondary education outcomes than non-DE students. They were about 30 percentage points more likely to enroll in college after high school and 25 percentage points more likely to first enroll in a four-year institution. DE students were less likely to enroll in remedial courses in college and significantly more likely to earn college degrees than non-DE students.
13
Table 1
Descriptive Statistics of Dual Enrollment Participants and Non-Participants
Variable All Students DE Non-DE
Student characteristics
Female 51.3% 62.4% 49.4%
White 55.7% 77.7% 52.0%
Black 24.1% 10.6% 26.3%
Hispanic 17.2% 7.4% 18.9%
2001 cohort 50.1% 51.2% 49.9%
English language learner 3.0% 0.5% 3.5%
Free or reduced-price lunch 42.8% 22.8% 46.3%
FCAT Reading score, 10th grade 304.3 334.5 298.4
FCAT Math score, 10th grade 313.9 344.2 308.0
High school GPA 2.67 3.26 2.58
Outcomes
High school diploma 90.6% 98.1% 89.3%
Enrollment at any college 61.8% 88.3% 57.4%
Enrollment at any four-year institution 39.5% 59.0% 34.4%
Enrollment at in-state four-year institution 33.0% 53.3% 27.8%
Persistence to second term 76.1% 83.0% 74.3%
Persistence to second year 72.6% 84.4% 69.6%
Remedial reading enrollment 23.3% 5.8% 27.8%
Remedial English enrollment 18.1% 3.8% 21.8%
Remedial math enrollment 33.0% 11.4% 38.5%
Freshman college GPA (including DE courses) 2.43 2.95 2.30
Associate degree 21.5% 32.0% 18.8%
Bachelor’s degree 23.2% 42.6% 18.2%
Observations 229,904 32,980 196,924
% 100% 14% 86%
SOURCES: Florida K-20 Education Data Warehouse & National Clearinghouse data (extracted April 2008). NOTES: DE denotes students who took at least one academic dual enrollment course.
15
4. Econometric Framework:
Standard RD and Sequential RD Design
This section provides a simple example to convey the intuition behind the standard RD approach and the sequential RD approach, which extends the standard framework to the case where participation in a subsequent treatment changes discontinuously at the cutoff but participants only take one of the treatments. While the standard RD design is appropriate for estimating the effect of DE-basic or the effect of DE-algebra on pre-college outcomes, the sequential RD design is appropriate for estimating the effect of DE-algebra on college outcomes.18
The Intuition Behind the RD Approach: A Numerical Example
Suppose that students’ participation is determined by the value of their score. Students can be divided into three groups. Always-takers participate in DE whether their score is below or above some cutoff z0. Never-takers do not participate, irrespective of their
score. Compliers participate if their score is above the cutoff and do not participate if their score is below the cutoff. Suppose that there are 40 percent never-takers, 40 percent always-takers, and 20 percent compliers in the population. In addition, suppose that the average effect of DE on compliers is to increase their college graduation rates from x to y. Figure 1 plots the data that would be used by a researcher to infer the effect of DE.
The left panel in Figure 1 shows participation rates in DE as a function of a score. The jump of 20 percentage points is explained by the proportion of compliers in the population. The middle panel shows college graduation rates as a function of the score. By RD assumption, in the absence of a treatment, the outcome changes continuously in the score. Thus, the jump in outcome at the cutoff ΔY must be driven by compliers. In particular, 1 . 5 . 2 . ) ( × = × = =
ΔY PC τC
where the proportion of compliers (or jump in participation) is P(C)=.2 and where the effect of DE on compliers is τC =y−x=.5. In practice, the researcher can obtain the effect of DE on compliers by dividing the jump in outcome by the jump in participation,
18 See Speroni (2011) for the formal derivation of the sequential RD estimator.
. ) (C P
Y
16
Figure 1
DE Participation and Outcomes as a Function of a Score (Hypothetical Example)
The above is the standard RD estimate, and it is sufficient in this paper to estimate the effect of DE on pre- and post-college outcomes as well as the effect of DE-algebra on pre-college outcomes.
Next, consider the objective of estimating the effect of DE-algebra on post-college outcomes. The issue is that the cutoff z0 is also used in determining eligibility to take
algebra while in college. Therefore, there is a greater jump in outcomes at the cutoff driven by never-takers of DE who benefit from taking algebra as college students. For example, suppose that 25 percent of never-takers are compliers in the second treatment, meaning that they would take algebra in college if they scored above the cutoff but not if they scored below the cutoff. Suppose, in addition, that these never-takers who are compliers in the second treatment would obtain a benefit of τNT/C =.5 from participating in the second treatment. Then the jump in outcomes would be given by
(1)
as illustrated by the right panel in Figure 1.
C NT
C P NT PC NT τ
τ
C P
Y = ( )× + ( )× ( | )× / Δ
, 15 . 5 . 25 . 4 . 5 . 2
. × + × × =
17 i i i i i i i i ε δ X Below Gap Score f β Above Gap Score f β Above β β D + + × + × + + = ) _ ( ) _ ( 3 2 1 0
A naive application of the standard RD estimate would attribute the entire change in outcome to the effect of DE, thus obtaining an estimate
75 . 20 . / 15 . ) ( / = =
ΔY P C
that overestimates the true effect of DE, .5. But from equation 1, it follows that
(2) so that the standard RD estimate must be corrected to account for the effect of the second treatment, τNT/C.
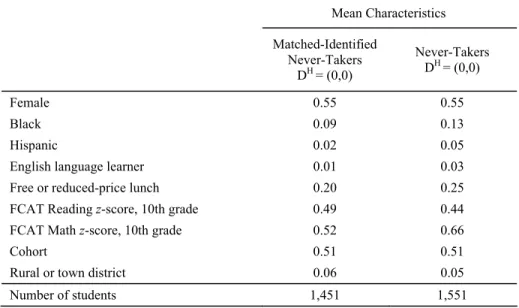
The final step is to obtain an estimate for second treatment. If the population of never-takers could be identified, then the natural approach would be to apply the standard RD design for the second treatment exclusively to never-takers, obtaining
) / ( /
/ Y P C NT
τNT C =Δ NT , i.e., the jump in outcomes divided by the jump in participation for never-takers. The problem is that the jump in outcomes is not exactly observed for never-takers. Rather, the jump of outcomes is observed for the population of students that do not take DE. While these are exactly the never-takers when their score is above the cutoff, they can be either never-takers or compliers when their score is below the cutoff. The sequential RD estimator matches students below the cutoff to students above the cutoff to determine which students are the never-takers below the cutoff. The validity of the matching procedure follows from the same assumptions that make the RD design valid (Speroni, 2011).
Standard RD Estimation
The standard implementation of the RD design identifies the impact of the program by comparing outcomes of students who barely pass with those of students who barely miss the required GPA (or CPT) cutoff score. Because not every student above the cutoff takes a DE course and not every student below the cutoff is disallowed enrollment (because exceptions are granted), this difference in outcomes is scaled up by the difference in the probability of enrolling in DE — a design known as “fuzzy” RD (Campbell, 1969).
Following Imbens and Lemieux (2008), I use a local linear regression to estimate the program effect in a two-stage least-squares instrumental variable specification (RD-IV) with the following first-stage and reduced-form equations
(3) C NT C τ C P NT C P NT P C P Y τ / ) ( ) | ( ) ( ) ( × × − Δ =
18 ) ( ) ( ) ( )
( NT/C
C Y C P NT P C P Y
τ = Δ − × Δ
i i i i i i i c i ε λ X Below Gap Score f γ Above Gap Score f γ D τ γ Y + + × + × + +
= 0 ˆ 2 ( _ ) 3 ( _ )
i i i i i i i i ε θ X Below Gap Score f α Above Gap Score f α Above α α Y + + × + × + + = ) _ ( ) _ ( 3 2 1 0 (4)
that characterize the standard RD-IV model,
(5) where i is the student, Diis an indicator that takes the value one if the student i took a
DE-basic course in 12thgrade (or DE-algebra in 11thor 12thgrade) and zero otherwise, Abovei
(Belowi) is an indicator that the student is above (below) their designated college cutoff,
Score_Gapiis the 11thgrade GPAor CPT score centered around the cutoff (thus measuring
distance to the minimum requirement), D ˆ i is the predicted probability from the first stage in equation 3, and Xi is a vector of covariates including students’ gender, race, free or
reduced-price lunch status, 10thgrade standardized scores, cohort fixed effect, and high school–level demographics.19The model is estimated locally using data incrementally close to the cutoff
following different bandwidths around the cutoff. The function f(.) is specified as quadratic and linear when using a narrow bandwidth of the data around the cutoff. In all specifications, standard errors are heteroskedasticity-robust and clustered at the score level.20The parameter of interest is ,
c
τ which captures what Angrist, Imbens, and Rubin (1996) call the “local average treatment effect” (LATE) — the effect of DE participation for those students who were induced to participate because of their eligibility status (i.e., compliers). This average effect of DE participation is local in that it is only identified close to the eligibility cutoff. Thus, it is not necessarily indicative of the effect for other students with different levels of academic preparation.
Sequential RD Estimation
To simplify notation, the sequential RD equation 2 can be equivalently written as (6)
19 Controlling for additional covariates is not necessary for identification because, by RD assumption, close-to-the-cutoff participation is “as good as” randomized (i.e., conditional on the score being close to the cutoff, other covariates are independent of participation). However, as in a pure randomized study, adding controls helps improve the precision of the estimate by reducing residual variation.
20 Lee and Card (2008) recommend clustering standard errors when the variable that determines eligibility is discrete, such as CPT score. I also report clustered standard errors when using GPA, though the difference is immaterial.
19
I estimate the first term in equation 6 following the standard RD estimation. For the second term, I proceed as follows. I use a version of the first-stage equation 321 to obtain an estimate for the proportion of never-takers around the cutoff by
) ˆ ˆ ( 1 )
(NT β0 β1
P = − +
To measure the ΔYNT/C =Y+NT/C −Y−NT/C, I first estimate the RD-IV reduced-form
equation 4 on those students who do not take DE and get an estimate of the outcome for students slightly above the cutoff. This is given by
1 0 / αˆ αˆ
Y+NT C = +
In both of the previous cases, I am careful to interact the observables X in equations 3 and 4 with the score and an indicator for whether the score is above or below the cutoff.
Finally, I estimate the outcome below the cutoff Y−NT/C in several steps. I begin by
identifying for each non-DE student below the cutoff the closest match to a non-DE student above based on the full set of covariates used in the regressions. I employ the nearest-neighbor matching algorithm (with replacement) developed by Abadie, Herr, Imbens, and Drukker (2004). I then estimate the proportion of never-takers below the cutoff, which is given by ) ( ) ( ) ( CorNT P NT P CorNT NT
P = , where P(CorNT)=1−β0.
Using the cumulative distribution function of students’ distance to their nearest match,22 I then identify the closest percent of the matches. Based on this subsample of students, I then run a regression using data below the cutoff of the form
(7) to get an estimate of τY−NT/C.
The validity of the matching hinges on the RD assumption that around the cutoff students are similar and the proportions of student types are constant. Because the assumption holds in a narrow margin around the cutoff, I estimate equation 7 using only
21 To facilitate the estimation of terms defined at the boundary of eligibility, all covariates are fully interacted with an indicator variable for the CPT above and below the cutoff and the score (centered at the cutoff).
22 The distance is a metric that synthesizes the difference between the matched-pair vector of covariates (see Abadie et al., 2004).
) ( CorNT NT P i i i i i C NT
i τY f Score Gap X φ ε forz z
20
observations close to the cutoff (within a bandwidth of 15 points), though I also experiment with alternative bandwidths as sensitivity checks. The drawback of the selection criterion is that, in practice, the differences in observable characteristics of student types are likely to be smooth over the support of the matching distance, and the selection criterion would misclassify some students. I deal with this issue by using a more stringent selection criterion for robustness.
Finally, I insert all the previous estimates in equation 6 and obtain an estimate
τ
ˆ C of the effect of DE-algebra. While in the standard RD case standard errors can be obtained with two-stage least-squares estimation, there is no explicit analytic solution for standard errors in the sequential approach. Standard errors for the sequential RD matching estimator are therefore obtained by bootstrap.21
5. Validity of the RD Design
The fundamental assumption of an RD design is that, with the exception of the treatment of interest, any other determinant of the outcome varies smoothly around the cutoff. 23 In this section, I assess the validity of applying the RD design described in Section
4 to the data. First, I select the sample of colleges that exhibit a significant discontinuity in participation in DE at the GPA cutoff (GPA sample) and in DE-algebra at the CPT cutoff (CPT sample). I then examine the validity of using GPA and CPT eligibility as an instrument in the selected samples. Finally, I consider evidence of other treatments that may be affected by the same eligibility criteria as DE. The conclusion is that the standard RD-IV strategy is appropriate for all outcomes under the GPA analysis and for pre-college outcomes under the CPT analysis but that the sequential RD strategy is needed for post-college outcomes under the CPT analysis.
Discontinuity: The GPA and CPT Samples
While an RD approach requires participation in DE to “jump” at the cutoff, I find that, for most colleges, there is no evidence of discontinuity.24 To avoid confounding an
23 There are two additional assumptions that are specific to the current application. First, the sequential RD estimator assumes that students take the CPT once and that the researcher observes the test score. In practice, students may take the exam during high school and then again during college, and I only observe the highest score in the data. This does not provide a threat to the validity of the RD design as long as the probability that the observed score is the high school score is the same right above and right below the cutoff. Second, not all colleges in the selected samples have the same cutoff scores. The use of different cutoffs, however, does not present a challenge for an RD identification strategy. Since students in Florida are required to take DE courses sponsored by their local community college, there is no need for concern about self-selection bias associated with students choosing DE courses at colleges based on their cutoff policies. However, the pooling of colleges with different cutoffs to provide an estimate of the effect of DE implicitly assumes homogeneity of the treatment effect for students on the margin of those different cutoffs.
24 The lack of discontinuity in participation at the official cutoffs in most colleges may be due to a number of factors. First, because colleges typically base admission decisions on GPA as reported by high school counselors on students’ DE application forms, any discrepancy between this self-reported GPA and the actual GPA in the transcripts (e.g., due to rounding of GPA decimal points) would tend to attenuate the discontinuity estimates. Another plausible explanation relates to Florida’s severe overcrowding problem during this time period, exacerbated by pressure to reduce class sizes. DE was regarded as an effective strategy to alleviate overpopulated classrooms (Florida Board of Education, 2003), and districts and colleges may have waived GPA requirements to rapidly increase DE participation. The lack of discontinuity in DE-algebra participation in some colleges may also be attributed to the fact that some colleges have additional testing requirements above and beyond the CPT for direct placement into algebra (e.g., the College Level Math test, a score not available in the data). While students may be using SAT or ACT scores instead of CPT scores in their DE applications, using
22
increase in participation at the cutoff with random noise, I restrict the analyses to those colleges that show a discontinuity that is significant and robust across bandwidth choice and model specification. Specifically, for each treatment (DE-basic and DE-algebra), I estimate a linear probability model of participation in 12th grade as a function of the score (11th grade cumulative high school GPA25 and CPT math score, respectively) on an eligibility
indicator (to capture the jump) using data incrementally close to the cutoff (within 0.5/0.4/0.3 GPA points and 40/20/10 CPT points around respective cutoffs), controlling for a quadratic function of the score (linear in smaller bandwidths), which is allowed to vary on either side of the cutoff.
The discontinuity in DE participation as a function of GPA is estimated conditional on having a college placement test score, reflecting the fact that students need to present placement scores as part of their DE application regardless of the course in which they intend to enroll. In theory, students willing to take DE-algebra are required to have an eligible GPA in addition to a passing CPT math score. In practice, however, the CPT math score cutoffs are sufficiently high that most students with scores around those cutoffs have an eligible GPA. Thus, I estimate the discontinuity in DE-algebra participation using only the CPT math score, and I show in the robustness section that results are not sensitive to considering both criteria. The findings are reported in Tables A.1 and A.2 in the appendix.26
I select colleges with a significant (at the 10 percent confidence level) discontinuity in any two of the three models for the main analyses, though I relax the criterion for robustness checks. Six colleges were selected for the DE-basic analysis (hereafter GPA sample), and seven colleges were selected for the DE-algebra analysis (hereafter CPT sample27). Overall, the analyses use data from 11 different colleges (two colleges are
included in both GPA and CPT samples) serving 42 percent of Florida’s 67 school districts and educating about a third of all DE students in the state.
the CPT score for students who took multiple tests should not prevent the detection of sizeable discontinuities as long as the CPT is used for eligibility for a fraction of students and CPT barely-failers are not SAT/ACT barely-passers or vice-versa.
25 Because the largest DE enrollment occurs in the fall semester of students’ senior year, I use the cumulative 11th grade GPA up through the summer before the senior year to determine eligibility for 12th grade courses. High schools with non-standard academic calendars were normalized to a semester calendar (fall, spring, summer) in the calculation of GPA. An unweighted GPA was used for all but three colleges that indicated the use of weights to determine DE eligibility. Weighted GPA was calculated using one additional grade point for AP, IB, DE, and Honors courses, following the most frequently used weighting scheme reported by districts (Florida Board of Education, 2003).
26 Because students in a given district can only take DE from the local community college, the discontinuity is estimated by college attendance area.
27 Two colleges that use the same cutoff to determine both algebra participation and math remediation were excluded from the main analysis. Including these colleges, however, does not materially affect the results (see Section 7).
23
Figures 2 and 3 plot mean participation as a function of the score, along with the first-stage fitted values from equation 3 (without controlling for additional covariates). Participation in DE-basic increases from 13 percent for a GPA score slightly below the eligibility cutoff to 21 percent for a GPA score slightly above the cutoff. Participation in DE-algebra increases from 12 percent for a CPT math score slightly below the eligibility cutoff to 31 percent for a CPT score slightly above the cutoff.28 As expected, participation
eventually decreases for students with high CPT scores because those students place directly into higher-level math courses.29 While exceptions to the GPA requirement are
allowed with joint agreement of the high school counselor and the DE college coordinator, participation in DE-algebra among students scoring below the cutoff is likely due to students substituting SAT or ACT scores for CPT scores.
28 The discontinuity of ever taking DE is remarkably similar (0.068 with a standard deviation of 0.019). This is because most students take DE for the first time in fall of their senior year, and the few who take DE exclusively during the spring would typically still use the 11th grade GPA for enrollment because spring applications begin before the end of the fall semester.
29 These discontinuities, while arguably small in magnitude, are strong instruments for DE participation. The F-test on the excluded instrument renders statistics of about 25.6 and 25.8 for DE-basic and DE-algebra, respectively — both above the rule-of-thumb of 10 (Stock, Wright, & Yogo, 2002).
24
Figure 2
DE Participation in 12th Grade
NOTES: GPA is displayed in bins 0.02 points wide on either side of the cutoff. Circles are cell means at each GPA value. The solid lines are fitted values of a quadratic regression estimated within a bandwidth of 0.5 GPA points either side of the cutoff.
25
Figure 3
DE-Algebra Participation
NOTES: CPT scores are displayed in bins 2 scale score wide on either side of the cutoff. Circles are cell means at each CPT math scale score. The solid lines are fitted values of a quadratic regression estimated within a bandwidth of 30 points on either side of the cutoff.
26
Descriptive Statistics for Selected Samples
Table 2 compares the average DE student in the GPA and CPT samples with the average student in the state. The racial composition of DE participants in the GPA sample is quite similar to the state average, but participants in the CPT sample were slightly more likely to be White. Despite the higher representation of minorities, DE students in the GPA sample were less likely to come from an economically disadvantaged household: 17 percent received free or reduced-price lunch, compared with roughly 23 percent in the entire state and the CPT sample. Setting aside differences in race and economic standing, DE students in the selected samples are quite similar to the state average in terms of academic ability or preparation.
DE participation rates in the selected samples are significantly higher than the state average: the percentage of high school students who took at least one DE course is 25 percent in the GPA sample and 34 percent in the CPT sample, compared with a state average of 14 percent. A typical DE student took about four DE courses and earned about 10 college credits in high school (with a success rate of about 77 percent), with averages being similar across samples. DE-algebra was the most popular course among DE students after freshman English composition, with a take-up rate of about 18 percent. Finally, most DE students took DE courses either at the college and high school campuses (58 percent) or at the college campus (37 percent). Interestingly, only 5 percent of DE students took DE courses exclusively at the high school campus.
Instrument Validity
The RD approach requires that all determinants of the outcome except the treatment vary smoothly around the cutoff. While this assumption is at some level fundamentally non-testable, I assess whether students above and below the cutoff are observationally similar. A direct assessment of the similarity of students just above and below the cutoff is shown in Table 3. The table displays discontinuity estimates in predetermined student characteristics at the GPA and CPT cutoffs using data incrementally close to the cutoff. Overall, there is no evidence that students above the cutoff are statistically significantly different from those below the cutoff in characteristics known to affect outcomes (gender, race, English fluency, poverty, and pre-DE English and math test scores). Following Lee and Lemieux (2010), the last row in the table provides a comprehensive chi-square test that assesses whether the data are consistent with no discontinuity for any of the observed covariates. Test results support the hypothesis that students within a narrow bandwidth around the GPA and CPT cutoffs are indeed similar.
27
Table 2
Descriptive Statistics for Dual Enrollment Participants
Variable All Colleges GPA Sample CPT Sample
DE student characteristics
Female 62.4% 61.8% 62.3%
White 77.7% 79.6% 83.8%
Minority (Black or Hispanic) 18.0% 16.1% 12.4%
English language learner 0.5% 0.3% 0.2%
Free or reduced-price lunch 22.8% 18.6% 23.9%
FCAT Reading score, 10th grade 334.5 (32.2) 337.7 (29.4) 334.1 (31)
FCAT Math score, 10th grade 344.2 (31.6) 347.4 (30) 343.4 (30.8)
HS GPA 3.26 (0.47) 3.33 (0.41) 3.29 (0.46)
DE experience
Participation rate 14.3% 24.9% 33.8%
Participation rate of high-ability students (11th grade GPA ≥ 3) 33.0% 41.1% 59.6%
Average total DE courses attempted 3.7 (3.2) 4.0 (3.5) 3.9 (3.1)
Average DE courses attempted in 12th grade 2.9 (2.1) 3.2 (2.3) 3.0 (2.1)
Average DE credits attempted 11.0 (9.7) 12.2 (10.6) 11.7 (9.4)
Average DE credits earned 9.9 (8.9) 10.6 (9.6) 10.6 (8.8)
DE success rate (passing course with grade of C or higher) 77.0% 73.9% 74.0%
DE algebra success rate in 12th grade 77.7% 66.6% 71.6%
DE English composition success rate in 12th grade 83.1% 76.6% 79.8%
Enrolled in DE algebra in 12th grade 18.3% 19.6% 20.0%
Enrolled in DE English composition in 12th grade 29.5% 40.7% 37.9%
Enrolled in college course outside DE program 1.4% 1.1% 0.6%
Taking DE on a full-time basis (i.e., early admission) 2.3% 0.8% 3.7%
DE location
Community college campus only 37.3% 38.4% 27.4%
High school campus only 4.9% 1.7% 1.6%
Both community college and high school campuses 57.8% 59.9% 71.0%
Schools in college attendance area
Total senior enrollment (both cohorts) 229,904 35,526 15,667
Percent of total senior enrollment (both cohorts) 100% 15.5% 6.8%
Number of dual enrollment students 32,980 8,841 5,303
Number of districts 67 18 18
Number of colleges 28 6 7
NOTES: Standard deviations for continuous variables are shown in parentheses. Statistics are based on students who took at least one academic (i.e., non-vocational) dual enrollment course sponsored by a community college. GPA sample consists of all high school senior students who took a placement test (CPT, SAT, or ACT) in districts assigned to the community colleges selected for the DE-basic analysis. CPT sample consists of all high school senior students who took the CPT in districts assigned to the community colleges selected for the DE-algebra analysis.
28
Table 3
Discontinuity in Baseline Characteristics and Participation in Other High School Programs by Sample
GPA Sample CPT Sample
± 0.4 ± 0.3 ± 30 ± 10
Female 0.008 -0.003 0.028 0.038
(0.023) (0.018) (0.031) (0.035)
Minority (Black or Hispanic) -0.001 -0.001 0.028 0.006
(0.027) (0.021) (0.022) (0.025)
English language learner -0.002 -0.007 0.001 -0.004
(0.011) (0.008) (0.007) (0.007)
Free or reduced-price lunch -0.014 0.005 0.013 0.020
(0.020) (0.017) (0.026) (0.028)
FCAT Reading, 10th grade 2.064 1.405 0.973 -1.436
(2.066) (1.570) (2.233) (1.851)
FCAT Math, 10th grade 1.374 0.811 0.688 -0.554
(2.044) (1.631) (1.463) (1.263)
AP 12th grade -0.022 -0.028 0.006 -0.001
(0.029) (0.023) (0.035) (0.042)
IB 12th grade -0.009 -0.004 0.007 0.009
(0.008) (0.006) (0.007) (0.006)
Honors 12th grade -0.013 -0.015 0.030 0.041
(0.032) (0.025) (0.032) (0.035)
Prob. outside Florida public higher -0.000 -0.003 0.016 0.022
education system (0.011) (0.008) (0.012) (0.017)
Chi-square test that all discontinuities 3.68 9.16 2.84 2.49 in covariates are jointly zero, [p-value] [0.815] [0.241] [0.899] [0.928]
Number of students 15,649 12,141 7,921 2,959
Number of colleges 6 6 7 7
NOTES: Each cell represents the estimated discontinuity in the covariate from a linear probability model on a dummy indicating GPA or CPT score above the respective cutoff for each institution and a linear (odd columns) or quadratic (even columns) term on the score allowed to vary on either side of the cutoff. Fitted probabilities of participation were estimated using the full set of control variables used in the regressions as described in the text. Chi-square test was performed using seemingly unrelated regression estimation, where each equation represents a different baseline covariate listed in the table. Standard errors (in parentheses) are clustered at the GPA or CPT math score.