O R I G I N A L R E S E A R C H
Open Access
Data mining for classification of power
quality problems using WEKA and the
effect of attributes on classification
accuracy
S. Asha Kiranmai
1*and A. Jaya Laxmi
2Abstract
There is growing interest in power quality issues due to wider developments in power delivery engineering. In order to maintain good power quality, it is necessary to detect and monitor power quality problems. The power quality monitoring requires storing large amount of data for analysis. This rapid increase in the size of databases has demanded new technique such as data mining to assist in the analysis and understanding of the data. This paper presents the classification of power quality problems such as voltage sag, swell, interruption and unbalance using data mining algorithms: J48, Random Tree and Random Forest decision trees. These algorithms are implemented on two sets of voltage data using WEKA software. The numeric attributes in first data set include 3-phase RMS voltages at the point of common coupling. In second data set, three more numeric attributes such as minimum, maximum and average voltages, are added along with 3-phase RMS voltages. The performance of the algorithms is evaluated in both the cases to determine the best classification algorithm, and the effect of addition of the three attributes in the second case is studied, which depicts the advantages in terms of classification accuracy and training time of the decision trees.
Keywords:Power quality problems, Classification, Data mining, Decision trees, J48, Random tree, Random forest, WEKA
1 Introduction
Power Quality (PQ) has been given an increased atten-tion all over the world over the past decade. Power qual-ity is a set of electrical boundaries that allows a piece of equipment to function in its intended manner without significant loss of performance or life expectancy. Now-a-days, power quality is very important due to de-regulation of the power industry and proliferation of sensitive loads that require clean and uninterrupted power such as power electronic drives, microprocessor based controllers, computers, processing plants, hospi-tals, bank security system, etc. Power quality problems like voltage sag, swell, unbalance, interruption, flicker, harmonics, etc., create poor power quality. The existence of PQ problems greatly affects the safe, reliable and
economical operations of electric power systems. When the supply voltage is distorted, electrical devices draw non-sinusoidal current from the supply, which causes many technical problems such as extra losses, extra heating, misoperation, early aging of the devices, etc. A small power outage has a great economic impact on the industrial consumers. A longer interruption harms prac-tically all operations of a modern society [1]. The PQ problems cannot be completely eliminated, but can be minimized up to a limit through various equipment such as custom power devices, power factor corrector cir-cuits, filters, etc. [2,3].
To know the sources of power quality problems and make appropriate decision in improving power quality, the electric utilities should provide real time monitoring systems which are capable of identifying different power quality problems. For this, instruments should collect huge amount of data, such as measured currents, volt-ages and occurrence times. From the data collected, * Correspondence:[email protected]
1Department of Electrical Engineering, University College of Engineering, Osmania University, Hyderabad, Telangana, India
Full list of author information is available at the end of the article
online or offline analysis is needed to be carried out to classify the disturbances [4–7].
Vast and increasing volumes of data obtained from power quality monitoring system, requires the use of data mining technique for analyzing the data. Data min-ing technology is an effective tool to deal with massive data, and to detect the useful patterns in those data. In power systems, data can be raw waveforms (voltages and currents) sampled at relatively high sampling frequen-cies, pre-processed waveforms (e.g., RMS values) or sta-tus variables (e.g., if a relay is opened or closed) which are typically sampled at low sampling frequencies [8]. Classification of data is an important task in the data mining process that extracts models for describing clas-ses and predicts target class for data instances.
Today, several standard classifiers are available, among which the decision trees are most powerful and popular for both classification and prediction. Decision trees are flexible enough to handle items with a mixture of real-valued and categorical features, as well as items with some missing features. These are more interpretable than other classifiers such as Artificial Neural Networks (ANN) and Support Vector Machines (SVM) because they combine simple questions about the data in an understandable way [9]. They are expressive enough to model many partitions of the data that are not as easily achieved with classifiers that rely on a single decision boundary such as logistic regression or SVM. Decision trees naturally support classification problems with more than two classes and can be modified to handle regres-sion problems. Finally, once constructed, they classify new items quickly [10].
In [11], SVM, ANN, logistic regression, Naïve Bayes, classification and regression trees, C5.0 algorithm, Quick, Unbiased and Efficient Statistical Tree (QUEST), CHi-square Automatic Interaction Detector (CHAID) and discriminant analysis have been implemented for classifica-tion on nine datasets. According to the experimental re-sults, C5.0 model proved to have the best performance. The performances of J48 decision tree, Multi-Layer Per-ceptron (MLP) and Naïve Bayes classification algorithms were studied with respect to training time and accuracy of prediction [12]. It is observed that MLP takes highest train-ing time for each of the data instances than J48 decision tree and Naïve Bayes classifiers. The accuracy of Naïve Bayes reduces as the data size increases. J48 and MLP showed high accuracies with low as well as higher data sizes. The performance of ANN and SVM is evaluated for the classification of sag, swell, interruption, harmonics and flicker [13]. It is found that SVM outperform ANN in terms of classification accuracy and computation time. Ten different types of disturbances such as sag, swell, interrup-tion with and without harmonics, are classified using SVM and decision tree [14]. It is observed that the decision tree
is faster and provides better classification accuracy at every case with and without noise. It is also easier to implement than SVM. Moreover, the decision tree worked satisfactor-ily with both synthesized and real signals.
Decision trees such as J48, Logistic Model Tree (LMT), Reduced Error Pruning (REP) Tree, Random Tree, Simple Cart, Random Forest are used for the clas-sification purpose [15–17]. Random Forest is used for the classification of PQ disturbances [18] and fault rec-ord detection in data center of large power grid [19]. J48 is compared with Random Forest in the classification of power quality disturbances and found that Random For-est is more accurate than J48 [20]. The performance of Random Tree is observed to be better than REP Tree, Simple Cart [21], Logical Analysis of Data (LAD) Tree and Random Forest [22] for the classification purpose. It has been found that whenever correct attributes are se-lected before classification, accuracy of data mining algo-rithms is improved significantly [23, 24]. This paper focuses on how data mining techniques of J48, Random Tree and Random Forest decision trees are applied to classify power quality problems of voltage sag, swell, interruption and unbalance. The effect of data attributes on the classification accuracy and time taken for training the decision trees is also discussed.
The paper is organized as follows: Section2gives defi-nitions and causes of power quality problems like volt-age sag, swell, interruption and unbalance along with their typical figures. Section 3 deals with the basics of data mining and explains about J48, Random Tree and Random Forest algorithms. This Section also briefs about WEKA software used for implementing data min-ing for the classification purpose. In Section 4, the MATLAB simulation circuit is given which is used for generating the data for various power quality problems. The testing and results of the data mining algorithms obtained from WEKA are discussed in Section5. Finally, Section 6 gives conclusions of the work from the ob-served results.
2 Power quality problems
Power quality problem is defined as any power problem manifested in voltage, current, or frequency deviations that results in failure or misoperation of customer equipment. Some of the commonly occurring power quality problems in a power system are voltage sag, swell, interruption and unbalance [25].
2.1 Voltage sag
circuits, overloads and starting of large motors. Figure1 shows typical waveform of a voltage sag.
2.2 Voltage swell
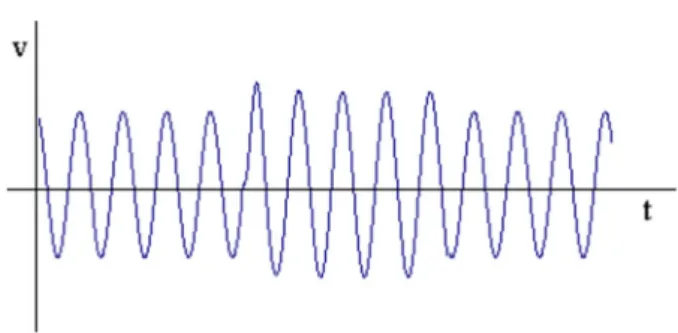
Voltage swell is defined as an increase in RMS voltage between 1.1 p.u. and 1.8 p.u. at the power frequency for durations from 0.5 cycles to 1 min. The causes of swell are switching off a large load, energizing a large capaci-tor bank and temporary voltage rise on the unfaulted phases during a single line-to-ground fault. Voltage waveform of a swell is as shown in Fig.2.
2.3 Interruption
An interruption occurs when the supply voltage or load current decreases to less than 0.1 p.u. for a period of time not exceeding 1 min. Interruptions can be the result of power system faults, lightning, equipment failures and control malfunctions. Interruption is illustrated in Fig.3.
2.4 Voltage unbalance
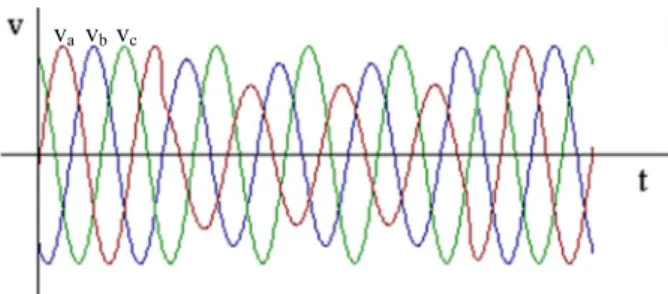
In a 3-phase system, voltage unbalance takes place when the magnitudes of phase or line voltages are different, or the phase angles differ from the balanced conditions, or both. The sources of voltage unbalance are unbalanced faults, single-phase loads on a three-phase circuit and blown fuses in one phase of a 3-phase capacitor bank. The three phase voltages during an unbalanced fault are as shown in Fig.4.
3 Data mining
Data mining is a process that uses a variety of data ana-lysis tools to identify hidden patterns and relationships within the data. These tools are a mixture of machine learning, statistics and database utilities. Data mining has recently obtained popularity within many research fields over classical techniques for the purpose of analyz-ing data due to (i) a vast increase in the size and number of databases, (ii) the decrease in storage device costs, (iii) an ability to handle data which contains distortion (noise, missing values, etc.), (iv) continuous progress in the implementation of automatic learning techniques
and (v) the rapid increase in computer technology [26]. The ultimate goal of data mining is to discover useful in-formation from large amounts of data in many different ways using rules, patterns and classification [27]. Data mining can be used to identify anomalies that occur as a result of network or load operation, which may not be acknowledged by standard reporting techniques. It is proposed that data mining can provide answers to the end-users about PQ problems by converting raw data into useful knowledge [28,29].
Many people treat data mining as a synonym for an-other popularly used term, Knowledge Discovery from Data (KDD), while others view data mining as merely an essential step in the process of knowledge discovery. The knowledge discovery process is an iterative sequence of the following steps: (i) Data cleaning, (ii) Data integra-tion, (iii) Data selecintegra-tion, (iv) Data transformaintegra-tion, (v) Data mining, (vi) Pattern evaluation and (vii) Knowledge presentation. Steps (i) through (iv) are different forms of data pre-processing, where data are prepared for mining. The data mining step may interact with the user or a knowledge base. The interesting patterns are presented to the user and may be stored as new knowledge in the knowledge base. The preceding view shows data mining as one step in the knowledge discovery process, albeit an essential one because it uncovers hidden patterns for evaluation. However, in industry, in media, and in the research milieu, the term data mining is often used to
Fig. 1Voltage waveform during Sag
Fig. 2Voltage waveform during Swell
refer to the entire knowledge discovery process [30].The data mining process differs from classical statistical methods in the way that statistical methods focus only on model estimation, while data mining techniques focus on both model formation and its performance. Another significant difference is that statistical methods fail to analyze data with missing values, or data that con-tains a mixture of numeric and qualitative forms. Data mining techniques, instead, can analyze and cope intelli-gently with records containing missing values, as well as a mixture of qualitative and quantitative data, without tedious manual manipulation [31,32].
Data mining starts with the real data, collected from the real equipment. In fact, more the diversified data, more accurate and better result is obtained. So, if hundreds of parameters are recorded and available for analysis, data mining can consider and use all the data which is col-lected. Data mining methods are well equipped to handle large amount of data and to detect the useful patterns in these data that allow us to improve the performance. Data mining methodologies and algorithms have their origins in many different disciplines. For example, researchers on artificial intelligence have proposed various methods and techniques that can efficiently “mimic” how real people (“experts”) can detect difficult hidden patterns in large amounts of complex data.
3.1 Methods: Data mining algorithms
There are many data mining algorithms available, among which the most widely used algorithms for classification are J48, Random Tree and Random Forest. These are de-cision trees which use divide-and-conquer strategies as a form of learning by induction. Thus, these algorithms use a tree representation, which helps in pattern classifi-cation in data sets, being hierarchically structured in a set of interconnected nodes. The internal nodes test an input attribute/feature in relation to a decision constant and, this way, determines what will be the next descend-ing node. Therefore, the nodes considered as leaves clas-sify the instances that reach them according to the associated label [33].
3.1.1 J48
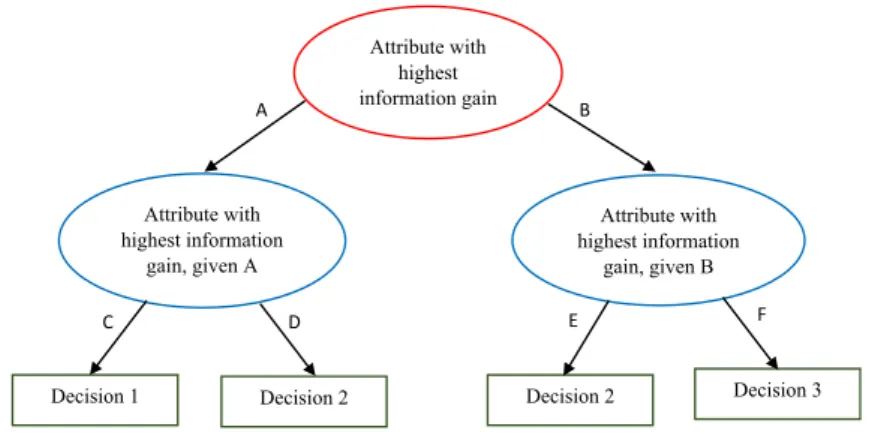
J48 is an open source Java implementation of the C4.5 algorithm in the WEKA data mining tool. It creates a binary tree. It is one of the most useful decision tree ap-proach for classification problems. It employs top-down and greedy search through all possible branches to con-struct a decision tree to model the classification process. In order to classify a new item, it first needs to create a decision tree based on the attribute values of the avail-able training data. So, whenever it encounters a set of items (training set), it identifies the attribute that dis-criminates the various instances more clearly. This fea-ture, which is able to tell us more about the data instances, so that we can classify them the best, is said to have the highest information gain. Now, among the possible values of this feature, if there is any value for which there is no ambiguity, i.e., for which the data in-stances falling within its category have the same value for the target variable, then that branch is terminated and the target value is assigned to it. For the other cases, another attribute is selected which gives the highest in-formation gain. The process is continued in this manner until a clear decision is obtained about what combin-ation of attributes gives a particular target value, or till all the attributes are completed. In the event that all the attributes are finished, or if the unambiguous result can-not be obtained from the available information, we as-sign this branch a target value that the majority of the items under this branch possesses. Now that we have the decision tree, we follow the order of attribute selec-tion as we have obtained for the tree. By checking all the respective attributes and their values with those seen in the decision tree model, the target value of the new in-stance can be predicted. J48 classification is based on the decision trees or rules generated from them [34]. The simple tree structure of J48 is as shown in Fig.5.
3.1.2 Random tree
A Random Tree is a decision tree that is formed by a stochastic process. In standard tree, each node is split using the best split among all attributes. In a Random Tree, each node is split using the best among the subset of randomly chosen attributes at that node. Random Tree algorithm has an option to estimate the class prob-abilities for classification. Random Trees have been in-troduced by Leo Breiman and Adele Cutler. This algorithm can deal with both classification and regres-sion problems [21,35]. The structure for a Random Tree is shown in Fig.6.e
3.1.3 Random forest
trees to a data set and then combines the prediction from all the correlated trees. Each tree depends on the value of a separately sampled random vector. Random Forest corresponds to a collection of com-bined decision trees {hk(x, Tk)}, for k = 1, 2,..., n,
where n is the number of trees and Tk is the training
set built at random and identically distributed, hk
rep-resents the tree created from the vector Tk and is
re-sponsible for producing an output x.
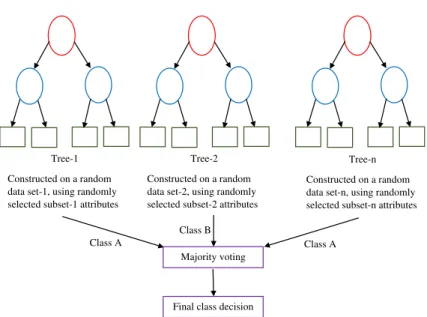
The trees that make up the Random Forest are built randomly selecting ‘m’ (value fixed for all nodes) attri-butes in each node of the tree; where the best attribute is chosen to divide the node. The vector used for train-ing each tree is obtained ustrain-ing a random selection of the instances. Thus, to determine the class of an instance, all the trees indicate an output and the most voted is se-lected as the final result. So, the classification error de-pends on the strength of individual trees of the forest and the correlation between any two trees in the forest [20]. Figure7 shows the tree diagram of a Random For-est. The various differences between the three data min-ing algorithms are presented in Table1.
3.2 Data mining tool: WEKA software
WEKA, formally called Waikato Environment for Know-ledge Analysis, is a computer program that was developed at the University of Waikato in New Zealand for the pur-pose of identifying information from raw data gathered from agricultural domains. WEKA is a state-of-the-art fa-cility for developing machine learning techniques and their application to real-world data mining problems. It is a collection of machine learning algorithms for data min-ing tasks. The algorithms are applied directly to a dataset. WEKA supports many different standard data mining tasks such as data pre-processing, classification, clustering, regression, visualization and feature selection. The basic premise of the application is to utilize a computer applica-tion that can be trained to perform machine learning cap-abilities and derive useful information in the form of trends and patterns. WEKA is an open source application that is freely available under the GNU general public li-cense agreement. It is user friendly with a graphical inter-face that allows for quick set up and operation. WEKA operates on the predication that the user data is available as a flat file or relation, this means that each data object is Fig. 5J48 decision tree
e
described by a fixed number of attributes that usually are of a specific type, normal alpha-numeric or numeric values. The WEKA application allows novice users a tool to identify hidden information from database and file sys-tems with simple to use options and visual interfaces [36].
4 Circuit for generating data for classification
The circuit shown in Fig.8is modelled in MATLAB Simu-link. The circuit consists of a 33/11 kV distribution sub-station connected to a 2 km distribution line having a 11/ 0.433 kV distribution transformer supplying to a load of 190 kW, 140 kVAr [37]. It is simulated to get the data for various voltage sags, swells, interruptions and unbalance problems. Voltage sags are created by balanced 3-phase to ground faults with varied fault impedance and duration, for different categories of sags. Voltage swells are created by switching capacitors of different capacitances connecting to the line, for varied durations to get different categories of swells. Interruptions are introduced by opening circuit breaker 1 (CB 1) for different time durations, thereby
disconnecting the supply. The voltage unbalance is created by a 3-phase unbalance fault. The 3-phase RMS voltages calculated at the Point of Common Coupling (PCC) are used as the main data for classification of the power quality problems. The data is sampled at a frequency of 2 kHz. From the simulation, 400,001 data samples are obtained, among which 31,438 samples contain sag, 22,506 samples contain swell, 5441 samples contain interruption, 14,268 samples contain unbalance problem and remaining 326,348 samples have no power quality problems. This data is used for classification by data mining algorithms.
5 Results and discussion
The data samples obtained from simulations carried out on the system shown in Fig.8, are stored in a datasheet. Using this data, a class attribute is formulated which is used to differentiate sag, swell, interruption and unbal-ance. With this information, an ARFF (Attribute-Rela-tion File Format) file is written. ARFF file is an ASCII text file that describes a list of instances sharing a set of
Tree-1
Constructed on a random data set-1, using randomly selected subset-1 attributes
Tree-2
Constructed on a random data set-2, using randomly selected subset-2 attributes
Tree-n
Constructed on a random data set-n, using randomly selected subset-n attributes
Majority voting
Final class decision
Class A Class A
Class B
Fig. 7Structure of Random Forest
Table 1Differences between Data Mining Algorithms
Properties J48 Random Tree Random Forest
Attributes available at each decision node
All Random Subset Random Subset
Selection of attributes at each decision node
Highest information gain among all
Best among a random subset Best among a random subset
Number of trees One One Many
Data samples used for training All All Different data sets for different
trees, randomly chosen Final result of Classification Based on the leaf node reached Based on the leaf node reached Based on majority voting from
attributes. ARFF files were developed by the machine learning project at the Department of Computer Science of the University of Waikato for use with the WEKA machine learning software. The file has a header section followed by data section. The header section contains re-lation declarations mentioning the name of the rere-lation and attribute declarations listing the attributes (the col-umns in the data) with their types [38].
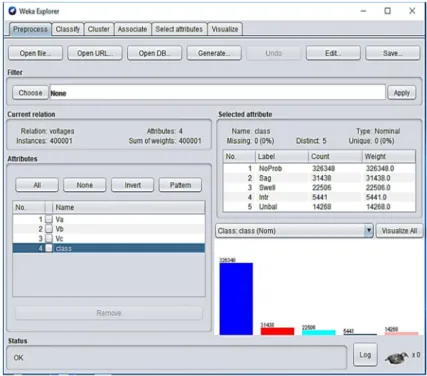
The ARFF file is used to load the data into WEKA software for the classification of the power quality prob-lems. Figure 9 shows the pre-processing stage of data
mining in WEKA indicating total number of instances, the number of attributes and number of samples under each class of power quality problems along with a bar graph. The attributes used in this case are the numeric values of three phase RMS voltages, namely Va, Vb and Vc along with the class attribute. The class attribute value is“NoProb”for samples containing no power qual-ity problem, “Sag” for samples with voltage sag,“Swell” when samples contain voltage swell, “Intr” for samples containing interruption and “Unbal” for samples with voltage unbalance condition.
Fig. 8Simulation circuit diagram of the system
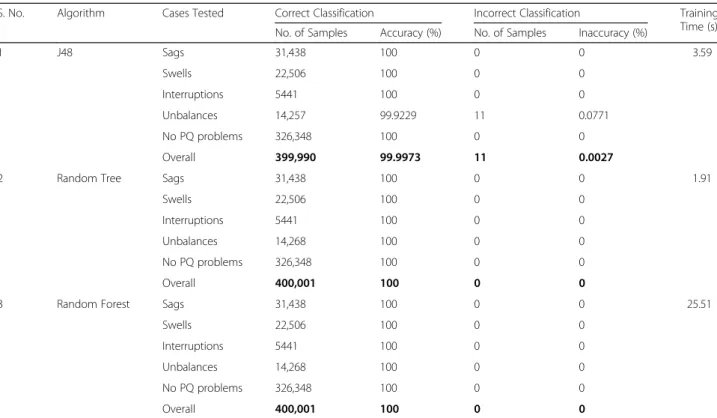
The data loaded into WEKA is used to train the data mining algorithms: J48, Random Tree and Random For-est for the classification purpose. After training, the al-gorithms are tested based on the given training set and as well as using stratified 10-fold cross validation [39]. The results obtained after testing the algorithms using training set are indicated in Table 2. It is observed that the overall accuracy of J48 algorithm is 99.9973%, whereas Random Tree and Random Forest algorithms have an accuracy of 100% in the classification of the power quality problems. It is also clear that the training time taken by the Random Tree is only 1.91 s, which is very less as compared to J48 and Random Forest.
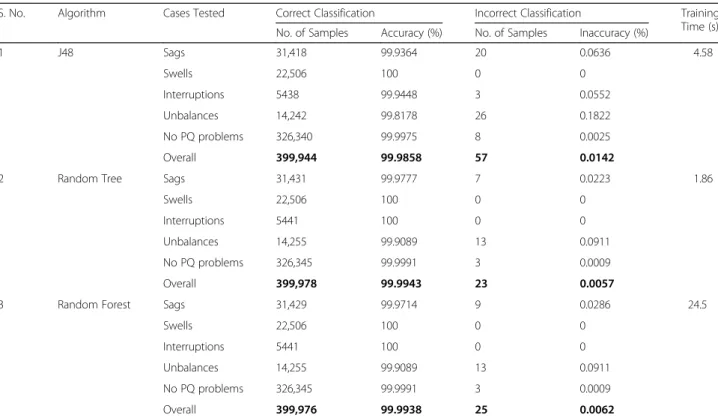
The results obtained after testing the algorithms using stratified 10-fold cross validation are shown in Table 3. From the results, it is seen that the Random Tree has a more overall accuracy (99.9943%) and takes less training time (1.86 s) as compared to J48 and Random Forest al-gorithms. From Tables2 and3, it is clear that with only four attributes in the data, Random Tree is best of the three algorithms as it has more accuracy and takes very less time for training.
In the next case, along with Va, Vb, Vc and class attri-bute, three more extra numeric attributes are included. They are average (Vavg), minimum (Vmin) and maximum (Vmax) values of the three phase voltages. Figure10shows the pre-processing stage of data mining for seven attributes
in WEKA. It indicates the total number of instances, the number of attributes and number of samples under each class of power quality problems along with a bar graph. The information is same as that shown in Fig.9, except for the number of attributes taken.
Using the data of seven attributes, loaded into WEKA, the data mining algorithms are trained and tested. The results obtained after testing the algorithms using train-ing set are indicated in Table 4. It is observed that the overall accuracy of J48 algorithm is 99.9983%, whereas Random Tree and Random Forest algorithms have an accuracy of 100% in the classification of the power qual-ity problems. It is again clear that the training time taken by the Random Tree (1.88 s) is very less as com-pared to J48 and Random Forest algorithms. Comparing the results of Tables2and4, it is observed that the clas-sification accuracy of J48 algorithm is improved in seven attributes case. Random Tree and Random Forest has 100% accuracy in both the cases. It is also observed that the training time taken by all the algorithms is reduced in seven attributes case.
Table5shows the results obtained after testing the algo-rithms using stratified 10-fold cross validation. From the results, it is seen that the Random Forest has highest over-all accuracy (99.9973%) whereas Random Tree has lowest training time (1.75 s) as compared to other algorithms. Comparing the results of Tables3and5, it is clear that for Table 2Comparison of Data Mining Algorithms with 4 attributes for evaluation on training set
S. No. Algorithm Cases Tested Correct Classification Incorrect Classification Training
Time (s)
No. of Samples Accuracy (%) No. of Samples Inaccuracy (%)
1 J48 Sags 31,438 100 0 0 3.59
Swells 22,506 100 0 0
Interruptions 5441 100 0 0
Unbalances 14,257 99.9229 11 0.0771
No PQ problems 326,348 100 0 0
Overall 399,990 99.9973 11 0.0027
2 Random Tree Sags 31,438 100 0 0 1.91
Swells 22,506 100 0 0
Interruptions 5441 100 0 0
Unbalances 14,268 100 0 0
No PQ problems 326,348 100 0 0
Overall 400,001 100 0 0
3 Random Forest Sags 31,438 100 0 0 25.51
Swells 22,506 100 0 0
Interruptions 5441 100 0 0
Unbalances 14,268 100 0 0
No PQ problems 326,348 100 0 0
all the algorithms, the classification accuracy is improved and the training time is reduced using seven attributes. Thus, it indicates that the generalization capabilities of the algorithms are enhanced by including the extra attributes in the second case.
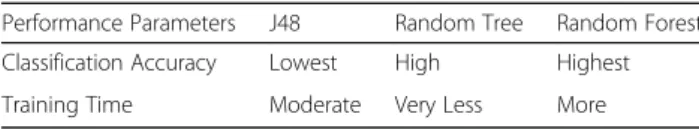
From all the results obtained by testing the algorithms for classification of power quality problems, comparison of overall performance of the algorithms is indicated briefly in Table 6. It is observed that Random Forest gives most accurate results, but takes more time for Table 3Comparison of Data Mining Algorithms with 4 attributes for stratified 10-fold cross-validation
S. No. Algorithm Cases Tested Correct Classification Incorrect Classification Training
Time (s)
No. of Samples Accuracy (%) No. of Samples Inaccuracy (%)
1 J48 Sags 31,418 99.9364 20 0.0636 4.58
Swells 22,506 100 0 0
Interruptions 5438 99.9448 3 0.0552
Unbalances 14,242 99.8178 26 0.1822
No PQ problems 326,340 99.9975 8 0.0025
Overall 399,944 99.9858 57 0.0142
2 Random Tree Sags 31,431 99.9777 7 0.0223 1.86
Swells 22,506 100 0 0
Interruptions 5441 100 0 0
Unbalances 14,255 99.9089 13 0.0911
No PQ problems 326,345 99.9991 3 0.0009
Overall 399,978 99.9943 23 0.0057
3 Random Forest Sags 31,429 99.9714 9 0.0286 24.5
Swells 22,506 100 0 0
Interruptions 5441 100 0 0
Unbalances 14,255 99.9089 13 0.0911
No PQ problems 326,345 99.9991 3 0.0009
Overall 399,976 99.9938 25 0.0062
Table 4Comparison of Data Mining Algorithms with 7 attributes for evaluation on training set
S. No. Algorithm Cases Tested Correct Classification Incorrect Classification Training
Time (s)
No. of Samples Accuracy (%) No. of Samples Inaccuracy (%)
1 J48 Sags 31,436 99.9936 2 0.0064 3.26
Swells 22,506 100 0 0
Interruptions 5441 100 0 0
Unbalances 14,263 99.9650 5 0.0350
No PQ problems 326,348 100 0 0
Overall 399,994 99.9983 7 0.0017
2 Random Tree Sags 31,438 100 0 0 1.88
Swells 22,506 100 0 0
Interruptions 5441 100 0 0
Unbalances 14,268 100 0 0
No PQ problems 326,348 100 0 0
Overall 400,001 100 0 0
3 Random Forest Sags 31,438 100 0 0 22.58
Swells 22,506 100 0 0
Interruptions 5441 100 0 0
Unbalances 14,268 100 0 0
No PQ problems 326,348 100 0 0
Overall 400,001 100 0 0
Table 5Comparison of Data Mining Algorithms with 7 attributes for stratified 10-fold cross-validation
S. No. Algorithm Cases Tested Correct Classification Incorrect Classification Training
Time (s)
No. of Samples Accuracy (%) No. of Samples Inaccuracy (%)
1 J48 Sags 31,424 99.9554 14 0.0445 3.68
Swells 22,506 100 0 0
Interruptions 5440 99.9816 1 0.0184
Unbalances 14,252 99.8878 16 0.1122
No PQ problems 326,348 100 0 0
Overall 399,970 99.9923 31 0.0077
2 Random Tree Sags 31,429 99.9713 9 0.0287 1.75
Swells 22,506 100 0 0
Interruptions 5441 100 0 0
Unbalances 14,258 99.9299 10 0.0701
No PQ problems 326,347 99.9997 1 0.0003
Overall 399,981 99.995 20 0.005
3 Random Forest Sags 31,434 99.9872 4 0.0128 21.25
Swells 22,506 100 0 0
Interruptions 5441 100 0 0
Unbalances 14,262 99.9579 6 0.0421
No PQ problems 326,347 99.9997 1 0.0003
training, whereas, Random Tree takes very less time for training and gives satisfactorily accurate results.
6 Conclusion
This paper presents the implementation of data mining al-gorithms: J48, Random Tree and Random Forest decision trees, for classification of power quality problems of volt-age sag, swell, interruption and unbalance using WEKA. The algorithms are trained and tested with data consisting numeric attributes of three phase voltages as well as with the inclusion of minimum, maximum and average voltage numeric attributes. The testing in both the cases is per-formed based on the given training set of data and by using stratified 10-fold cross validation. From the results, it is seen that J48 algorithm is less accurate and takes moderate training time as compared to other algorithms. Random Tree algorithm takes very less training time among the three algorithms and its accuracy is good. Ran-dom Forest algorithm gives more accuracy, but it takes much higher training time than other decision trees. Thus, Random Tree can be used if less training time is required and Random Forest can be used where very high accuracy is required. From the tests, it is also observed that the classification accuracy is increased and training time is re-duced for all the algorithms by using three extra attributes such as minimum, maximum and average voltage values in the data taken for training and classification. So, with the inclusion of these three simple attributes into the data, the data mining algorithms have trained better and their generalization capabilities are enhanced, leading to more accurate results.
Acknowledgements
The authors thank the officials of University College of Engineering, Osmania University, Hyderabad, India, for providing the facilities to carry out this work.
Funding
The work is not supported by any funding agency. This is the authors own research work.
Availability of data and materials
Please contact author for data requests.
Authors’contributions
SAK modelled the simulation circuit of the system, generated test data, implemented data mining algorithms for the classification of power quality problems, analyzed the results with different attributes and prepared the manuscript. AJL contributed to the conception of the study, participated in its coordination and helped to draft the manuscript. All authors read and approved the final manuscript.
Authors’information
S. Asha Kiranmai was born in Hyderabad, Telangana, India, in 1985. She completed B.Tech. in EEE from Bhoj Reddy Engineering College for Women (BRECW), Hyderabad, in 2006 and M.E. in Power Systems from University College of Engineering (UCE), Osmania University (OU), Hyderabad, in 2008. She is presently pursuing Ph.D. in Power Quality at UCE, OU, Hyderabad. She has been working as an Assistant Professor in BRECW, Hyderabad since 2008. Her interested areas are Power Systems and Power Quality. She is a Life Member of Indian Society of Technical Education (MISTE).
Dr. A. Jaya Laxmiwas born in Mahaboob Nagar District, Telangana State, in 1969. She completed her B.Tech. in EEE from UCE, OU, Hyderabad, in 1991, M.Tech. in Power Systems from REC, Warangal, Telangana State, in 1996 and completed Ph.D. (Power Quality) from JNTU, Hyderabad in 2007. She has 5 years of Industrial experience and 18 years of teaching experience. Presently working as Professor in EEE and coordinator in Centre for Energy Studies, Jawaharlal Nehru Technological University Hyderabad College of Engineering, Hyderabad. She guided 4 Ph.D. scholars. She has 100 International and National papers published in various conferences held in India and aboard. She has 80 International and National journal papers to her credit. Her research interests are Neural Networks, Power Systems and Power Quality. She was awarded“Best Technical Paper Award”for Electrical Engineering by Institution of Electrical Engineers in the year 2006. She is a Senior Member of IEEE, Member of International Accreditation Organization (MIAO), Fellow member of Institution of Electrical Engineers Calcutta (FIE), Life Member of System Society of India (MSSI), Life Member of Indian Society of Technical Education (MISTE), Life Member of Electronics and
Telecommunication Engineering (MIETE) and Life Member of Indian Science Congress (MISC).
Competing interests
The authors declare that they have no competing interests.
Author details 1
Department of Electrical Engineering, University College of Engineering, Osmania University, Hyderabad, Telangana, India.2Department of Electrical and Electronics Engineering, Jawaharlal Nehru Technological University Hyderabad College of Engineering, Hyderabad, Telangana, India.
Received: 1 May 2018 Accepted: 6 September 2018
References
1. Bhattacharyya, S., & Cobben, S. (2011).Consequences of poor power quality– An overview. Croatia: InTech.
2. Khalid, S., & Dwivedi, B. (2011). Power quality issues, problems, standards & their effects in industry with corrective means. International Journal of Advances in Engineering & Technology, 1(2), 1–11.
3. Pandit, N., & Chakrasali, R. L. (2017). Power quality issues in Indian power distribution utilities and feasible solutions.International Journal of Scientific & Technology Research, 6(5), 23–25.
4. Sharmila, M., Sundarabalan, C. K., & Selvi, K. (2017). Power quality disturbances classification using data mining technique. International Journal of Research in Science & Engineering, 3(3), 77–90.
5. Asha Kiranmai, S., & Jaya Laxmi, A. (2014).Detailed classification of various categories of power quality problems. Hyderabad: National Conference on Power Distribution, DSD-CPRI.
6. Asha Kiranmai, S., & Jaya Laxmi, A. (2015). Data extraction for classification and characterisation of power quality problems.International Journal of Advanced Research in Engineering and Applied Sciences, 4(5), 56–67. 7. Asha Kiranmai, S., & Jaya Laxmi, A. (2016). Online identification and
classification of different power quality problems.International Journal of Innovative Research in Electrical, Electronics, Instrumentation and Control Engineering, 4(3), 137–141.
8. Pires, Y., Morais, J., Cardoso, C., & Klautau, A. (2007).Data mining applied to the electric power industry: Classification of short-circuit faults in transmission
lines (p. 2007). Rio de Janeiro: IEEE 7th International Conference on
Intelligent Systems Design and Applications (ISDA).
9. Isinkaye, F. O., Folajimi, Y. O., & Ojokoh, B. A. (2015). Recommendation systems: Principles, methods and evaluation.Egyptian Informatics Journal, 16(3), 261–273.
Table 6Summary of comparison of overall performance of the Data Mining Algorithms
Performance Parameters J48 Random Tree Random Forest
Classification Accuracy Lowest High Highest
10. Kingsford, C., & Salzberg, S. L. (2008). What are decision trees? Nat Biotechnol, 26(9), 1011–1013.
11. Sampson, A. (2012).Comparing classification algorithms in data mining. A Thesis, Central Connecticut State University, New Britain, Connecticut. 12. Akinola, S., & Oyabugbe, O. (2015). Accuracies and training times of data
mining classification algorithms: An empirical comparative study.Journal of Software Engineering and Applications, 8, 470–477.
13. Manimala, K., Selvi, K., & Ahila, R. (2008). Artificial intelligence techniques applications for power disturbances classification.World Academy of Science, Engineering and Technology, 22, 833–840.
14. Upadhyaya, S., & Mohanty, S. (2016). Localization and classification of power quality disturbances using maximal overlap discrete wavelet transform and data mining based classifiers.IFAC-Papers OnLine, 49(1), 437–442.
15. Jeya Sheela, Y., & Krishnaveni, S. H. (2017).A comparative analysis of various classification trees(pp. 1346–1352). Kollam: IEEE International Conference on Circuit, Power and Computing Technologies (ICCPCT).
16. Pandey, P., & Prabhakar, R. (2016).An analysis of machine learning techniques (J48 & AdaBoost)-for classification(pp. 1–6). Delhi: IEEE 1stIndia International Conference on Information Processing (IICIP).
17. Sewaiwar, P., & Verma, K. K. (2015). Comparative study of various decision tree classification algorithm using WEKA.International Journal of Emerging Research in Management & Technology, 4(10), 87–91.
18. Anton Domini Sta. Cruz & Jordan Rel C. Orillaza (2017).Classification of single and multiple PQ disturbances based on DWT and RF classifiers. Penang: IEEE Region 10 Conference, TENCON 2017.
19. Zhou, J., Ge, Z., Gao, S., & Yanli, X. (2016).Fault record detection with random forests in data center of large power grid(pp. 25–28). Xi’an: IEEE PES Asia-Pacific Power and Energy Engineering Conference (APPEEC).
20. Borges, Fábbio A. S., Fernandes, Ricardo A. S., Lucas, A. M. & Silva, Ivan N. (2015).Comparison between random Forest algorithm and J48 decision trees applied to the classification of power quality disturbances. Las Vegas, Nevada, USA: Int'l Conf. Data Mining (DMIN’15), 146–147.
21. Kalmegh, S. (2015). Analysis of WEKA data mining algorithm REP tree, simple cart and random tree for classification of Indian news.International Journal of Innovative Science, Engineering & Technology, 2(2), 438–446.
22. Kalmegh, S. R. (2015). Comparative analysis of WEKA data mining algorithm RandomForest, RandomTree and LADTree for classification of indigenous news data. International Journal of Emerging Technology and Advanced Engineering, 5(1), 507–517.
23. Choudhary, N. K., Shinde, Y., Kannan, R., & Venkatraman, V. (2014). Impact of attribute selection on the accuracy of multilayer perceptron.International Journal of IT & Knowledge Management, 7(2), 32–36.
24. Dinakaran, S., & Thangaiah, D. R. J. (2013). Role of attribute selection in classification algorithms. International Journal of Scientific & Engineering Research, 4(6), 67–71.
25. Dugan, R. C., McGranaghan, M. F., Santoso, S., & Wayne Beaty, H. (2004).
Electrical power systems quality(2nded.). New York: Mc Graw-Hill.
26. Groth, R. (2000).Data mining: Building competitive advantage. USA: Prentice Hall.
27. Mannila, H. (1996).Data mining: Machine learning, statistics and databases. Stockholm, Sweden: In Proc. 8thInter. Conf. on Scientific and Statistical
Database Systems.
28. Olaru, C., & Wehenkel, L. (1999). Data mining.IEEE Computer Applications in Power, 12, 19–25.
29. Santoso, S. & Lamoree, J. D. (2000).Power quality data analysis: From raw
data to knowledge using knowledge discovery approach. IEEE PES Summer
Meeting.
30. Han, J., Kamber, M., & Pei, J. (2011).Data Mining: Concepts and Techniques
(3rded.). Burlington, Massachusetts, United States: Morgan Kaufmann.
31. Fayyad, U. M., Piatetsky-Shapiro, G., Smyth, P., & Uthurusamy, R. (1996).
Advances in knowledge discovery and data mining. Menlo Park: AAAI Press. 32. Westphal, C., & Balxton, T. (1998).Data mining solutions: Method and tools
for solving real-world problems. USA: Wily.
33. Witten, I. H., & Frank, E. (2005).Data mining: Pratical machine learning tools and techniques(2nd ed.). San Francisco: Morgan Kaufmann Publishers. 34. Classification methods. www.d.umn.edu/~padhy005/Chapter5.html. 35. Hamsagayathri, P., & Sampath, P. (2017). Performance analysis of breast
cancer classification using decision tree classifiers.Int J Curr Pharm Res, 9(2), 19–25.
36. WEKA manual. www.nilc.icmc.usp.br/elc-ebralc2012/minicursos/WekaManual-3-6-8.pdf.
37. Suresh, K., & Chandrashekhar, T. (2012). Characteristics analysis of voltage sag in distribution system using RMS voltage method. ACEEE Int J on Electrical and Power Engineering, 3(1), 55–61.
38. Soman, K. P., Diwakar, S., & Ajay, V. (2006).Data mining: Theory and practice. Delhi: PHI Learning Pvt. Ltd..
39. Kohavi, R. (1995).A study of cross-validation and bootstrap for accuracy
estimation and model selection. Montreal, Quebec, Canada: In Proc.