http://www.jscdss.com Vol.2 No.1 February 2015: 1-7 Article history:
Accepted 3 January 2015 Published online 3 January 2015
Journal of Soft Computing and Decision
Support Systems
Predicting Micro-Hardness of Post-Treated Hydroxyapatite Layer Using
Surface Response Methodology
Maryam Tamizi a, S.Izman a, Mostafa Rezazadeh Shirdar a,*, Nabeel Najm Al-Mayyahi a, Sadegh Parhizkar a a Department of Manufacturing and Industrial Engineering, Faculty of Mechanical Engineering, Universiti Teknologi
Malaysia, 81310 Skudai, Johor, Malaysia
* Corresponding author email address: [email protected]
Abstract
Micro-hardness of sol-gel-derived hydroxyapatite (HA) coating layer on Ti-13Nb-13Zr in different sintering conditions was investigated. Sintering post-treatment of coated samples was carried out based on full factorial design followed by surface response methodology. Analysis of variance (ANOVA) indicates that the sintering temperature is a more significant factor rather than sintering time in determining the Micro-hardness of the HA coating layer. Based on experiments results a mathematical model was created in order to be used for prediction of Micro-harness value in different sintering conditions. The validity of the generated model by Response Surface Methodology was confirmed through comparing the predicted values and experimental results and the close agreement was observed.
Keywords: Ti-13Nb-13Zr, Sol-gel, hydroxyapatite, Micro-hardness, Response surface methodology
1. Introduction
Titanium and its alloys are widely used in biomedical applications due to their well-established corrosion resistance, high strength-to-weight ratio, excellent fatigue resistance as well as low elastic modulus (Frank et al., 2008) (Velten et al., 2004). Nevertheless, not all titanium and its alloys can be used for all biomedical applications. For instance, Lopez reported that Ti-V alloy reveals a trace of vanadium ion release after being in contact with the body fluid for a long period of time (López et al., 2010). The existence of excessive metal-ions in the body fluid causes toxicity problems such as infections, local pain, and swelling for the host body (Aksakal et al., 2010). Ti-Nb and Ti-Zr alloys are a favourable substitution of Ti-V to overcome the toxicity problem of this alloy (Gutiérrez et al., 2008). Although these biocompatible alloys have a high strength-to-weight ratio and a good corrosion resistance, but the issue of ion release is still a great concern when these alloys are placed in a hostile electrolytic environments such as human body fluid (Yildirim et al., 2005). Therefore, Hydroxyapatite (HA), Ca10(PO4)6(OH)2, with a hexagonal structured ceramic composed of calcium phosphate groups, which is very similar to the mineral components of the bone tissue is applied to metallic implants as a coating layer. The HA coating layer provides a better osteointegration in the bone/implant interface, and protects the surface of the implant against the corrosive body fluid. Due to the excellent biocompatibility and
bioactivity of HA, its coating on the surface of the metallic implants is considered as a promising method to enhance their bioactivity. Many studies have shown that using HA as the coating layer can promote the bone growth cells (osteoblast) and the bone resorpion cells (osteoclast) activity after implantation, and therefore improve formation of chemical bonding at the HA/bone interface which is called osseointegration (Thian et al., 2005) (Rack et al., 2006) (Fehring et al., 2001) (Niinomi, 2002) (Rahaman et al., 2007). This provides a protection of surrounding body tissue against the metal-ion release from a metal prosthesis (Aksakal et al., 2010).
temperatures around 500 °C regarding to different sintering time (usually from 20 minutes to 1 hour) (Kim et al., 2004). At lower sintering temperatures the crystalline apatite phase would not appear and at higher temperatures some decompositions of HA, such as tricalcium phosphate (TCP), tetracalcium phosphate (TTCP), and calcium oxide (CaO) can be formed or intensified which are not favourable due to their fast dissolution in vivo. Although sintering post-treatment of HA sol-gel films under vacuum environment is frequently required to avoid metal oxidation, this leads to structural instability of the HA coating during sintering post-treatment. As a result, the sintering post-treatment of the HA coating should be performed in air, and below the transition temperature of the substrate (Liu et al., 2001).
A review of the literature indicates that a subject that has not been adequately investigated is the effect of sintering parameters including the time and the temperature on the Micro-hardness and the morphology of hydroxyapatite coated layer in the sol-gel method. Although other modeling and optimization methods have been utilized for optimization in different manufacturing process (Ghodsiyeh et al., 2012) (Shirdar et al., 2014) (Lahiji et al., 2012) (Golshan et al., 2012) (Golshan et al., 2011) in this study, response surface methodology (RSM) was applied for the statistical design of experiments, modelling and analysis of data. Therefore, the main aim of this study is to establish an empirical model that can be applied for predicting Micro-hardness of HA coating layer in different sintering post-treatment conditions. In this way, the Analysis of Variance (ANOVA) is presented for the curvature test, and a second-order mathematical model is created by the Response Surface Methodology (RSM) approach.
2. Materials and methods
2.1 HA coating
The material used in this research was Ti-13Nb-13Zr, which was cut using precision diamond wheel cutting machine (Buehler Isomet 4000) to the dimension of 5 mm in diameter, and 2 mm in thickness. Samples were polished with abrasive silicon carbide papers (320, 600, 800 and 1200 grit), then ultrasonically cleaned with acetone for 10 minutes.
The HA sol-gel was prepared by mixing Calcium chloride (CaCl2) and Trisodium phosphate (Na3PO4) in 50 ml of distilled water, and stirring in the speed of 600 rpm for 24 hours. Simultaneously NaOH was added to the solution to adjust the pH value of Sol-gel to 10. This was followed by centrifuging of the solution at 1500 rpm for 10 minutes. After preparation of HA sol-gel each sample was dip coated for 10 seconds with withdrawal rate of 3cm/min. Then the as-deposited samples were dried at 60 °C for 24 hours.
2.2 Design of Experiments
This study is an experimental investigation on the effect of single-step sintering post-treatment parameters on the Micro-hardness of the HA-coated layer. The Sequential experimentations were used before application of the RSM. It was started with a full factorial design to check the significant of each factor. Then a regression model for the response was obtained. Subsequently, by application of the steepest ascent method along the path of the steepest ascent, the maximum response was obtained. Finally, with design of the new model, the optimum setting of condition was predicted.
The Sintering time and temperature are the two factors considered in this study. The high and low level of these factors with three center point is given in Table 1. Design of Experiment software was employed for statistical design and data analysis.
Table 1
The factors and their levels.
Factor Symbol Levels
-1 (0) +1
Temperature (ᵒC) A 500 600 700
Time (min) B 10 20 30
2.3 Sintering procedure and Micro-hardness test
Once air drying of the as-deposited samples at 60 °C for 24 hours was completed, the sintering process was conducted based on 11 different runs in a muffle furnace with a Setpoint Ramp Rate (SP.rr) of 10 ᵒC/min. The results of Rockwell Micro-hardness test are shown in Table 2.
Table 2.
The result of experiments with two replication and 3 centre points.
Run A:Tempreature
(ᵒC)
B:Time (min)
M-hardness (HRB)
1 500 10 118.8
2 500 10 112.6
3 700 10 175.5
4 700 10 180.7
5 500 30 146.5
6 500 30 131
7 700 30 198.2
8 700 30 201.4
9 600 20 200.4
10 600 20 202.1
11 600 20 175.6
Experiment software (Version 7). As it is shown in ANOVA in Table 3, F-value of the model is 50.38 which reveal the significance of the model. Comparison between the F-value of the time and the temperature indicates that the sintering temperature is a more significant factor rather than the sintering time in determining of HA Micro-hardness. The ‘‘Lack of fit F-value’’ of 9.142E-003 implies that the lack of fit is not significant relative to the pure error, that is a desirable result. There is 0.9269 % probability that ‘‘Lack of fit F-value’’ occur because of the noises. The significance of curvature indicates that the first-order model is not accurate to reach the maximum
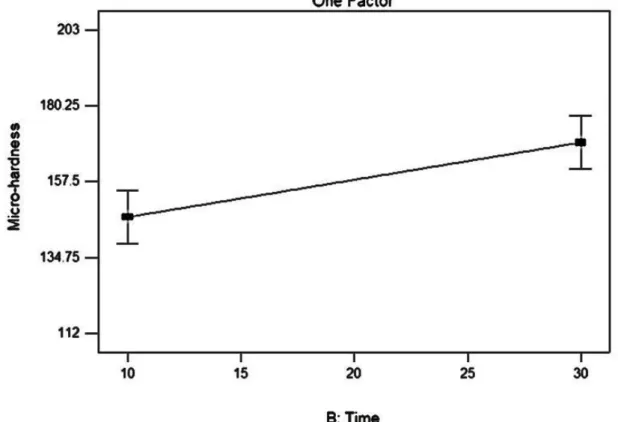
Micro-hardness of specimens. Therefore the second-order model needs to be employed to reach the optimum point of response which is the maximum Micro-hardness of the HA-coated layer. To do this the steepest ascent method was applied. Figurer 1 and 2 show the main effect plot which is used to determine the effect of each factor (sintering time and temperature) on the response (Micro-hardness) and to compare the relative strength of the effects. As it is obvious both factors has effect on the Micro-hardness however the effect of sintering temperature is more significant than the effect of sintering time.
Table 3
The Analysis of variance (ANOVA) for productivity.
Source Sum of Squares DF Mean Square F_Value p-value
Prob> F
Model 8621.23 2 4310.62 50.38 < 0.0001 Significant
A-Temperature 7619.95 1 7619.95 89.05 < 0.0001
B-Time 1001.28 1 1001.28 11.70 0.0111
Curvature 2613.87 1 2613.87 30.55 0.0009 Significant
Residual 598.96 7 85.57
Lack of Fit 0.91 1 0.91 9.142E-003 0.9269 not significant
Pure Error 598.05 6 99.67
Cor Total 11834.06 10
Figure 2 main effect plot for time.
The procedure of the Steepest Ascent method is to move sequentially to the direction of the maximum increase in response. In this method the path of the steepest ascent through the centre point of experiment is determined. According to the suggestion of the experts 10°C was considered as an appropriate basic step size for the sintering temperature. After determining the temperature step size, Minitab Software (Minitab Macro) was used to calculate the path of the steepest ascent which is shown in Table 4. For each step of the table, Micro-hardness test was applied separately.
Table 4
POSA experiment results.
Steps Temperature
(ᵒC)
Time
(min)
Hardness
(HRB)
1 600 20.00 202.1
2 610 20.36 207.3
3 620 20.72 212.4
4 630 21.09 217.4
5 640 21.45 212.5
6 650 21.81 210.8
7 670 22.17 207.9
8 680 22.54 204.2
The highlighted area in the Table 4 indicates that the
centre points based on the steepest of ascent results are shown in Table 5. The POSA results create a new set of level for each factor. The low and high levels for the temperature were 620 oC and 640 oC, respectively. The same for the time factor were 20.72 minutes and 21.45 minutes, respectively. In order to perform the phase 2 of the experiments, the augment of this design with enough points was used to fit the second-order model. Central Composite Design (CCD) was applied for fitting the second-order model. To achieve this goal, four points which are ( =0,
= ) and ( = , =0) were added to the
experiment. The results of the second-order-response model based on the ANOVA are shown in Table 6. The Model F-value of 29.11 implies that the model is significant. The "Lack of Fit F-value" of 0.4629 implies the Lack of Fit is not significant relative to the pure error. This indicates that the model is fit. There is a 46.29% chance that the "Lack of Fit F-value" could occur due to the noises. Non-significant Lack of Fit is favourable and shows that the model is fit. The main effect of factor A and squared terms of factor A and B were found significant for the Micro-hardness results.
Table 5
New levels and centre point.
Factor Symbol
Levels
-1 (0) +1
Temperature (ᵒC) A 620 630 640
Table 6
ANOVA for the response surface quadratic model.
Source Sum of Squares DF Mean Square F Value Prob> F Remarks
Model 15885.90 4 3971.47 29.11 0.0005 significant
A 4776.92 1 4776.72 35.02 0.0010 significant
B 49.37 1 49.37 0.36 0.5694 Not significant
A2 11046.88 1 11046.88 80.98 0.0001 significant B2 1179.80 1 1179.80 8.65 0.0259 significant
Residual Error 818.45 6 136.41
Lack-of-Fit 599.80 4 149.95 1.37 0.4629 Not significant
Pure Error 218.65 2 109.32
The coefficients of the regression equation were calculated using Design of Experiment software. In order to achieve a more accurate model it is required to develop a second-order model through the RSM. Equations 1 is the final empirical model in terms of the coded factors established from CCD experiment:
(1)
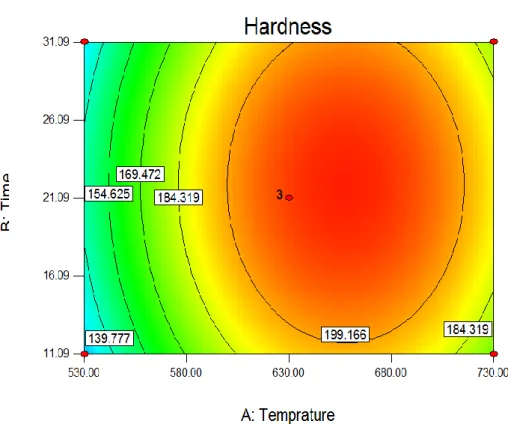
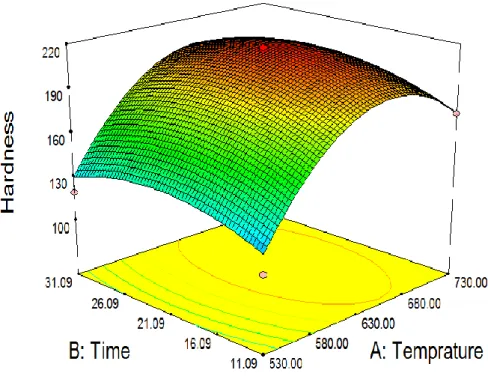
Figures 3 and 4 illustrate 3D response surface and 2D contour plot for Micro-harness of the HA coating layer. Both graphs indicate that with increase of sintering temperature and time of the Micro-hardness will decrease which is desirable. The main objective of these plots is determination of optimum values of the factors such that response is maximized. As it can be seen, the maximum response occurs in the point of 217.4 that is relevant to temperature (A) = 630 and Time (B) = 21.09 min.
Fig. 4. 3D Surface Plot for Micro-hardness.
In order to validate the quadratic regression model, the predicted value of the model should be compared with the actual data from the experiment. Therefore, after conducting the confirmation run of the selected points, the
percentage of the errors can be calculated between the predicted and actual values. Table 7 shows that the percentage of the errors for the all three experiments is less than 5%, which is generally acceptable
.
Table 7
Percentage of the errors in the confirmation test.
Factors Micro-hardness (N/mm2) Error (%)
Temperature (oC) Time (min) Predicted Value (Y) Actual Value (Real)
530 21.09 141.8 138.7 2.2
630 11.09 193.6 196.3 1.3
730 21.09 190.7 199.9 4.6
4. Conclusions
In this study, Micro-hardness of sol-gel-derived hydroxyapatite coating layer on Ti-13Nb-13Zr in different sintering conditions was planned and analysed by full factorial design and followed by surface response methodology. Analysis of variance from obtained data indicates that the sintering temperature is a more significant factor rather than sintering time in determining the Micro-hardness of the HA coating layer. Finally, a mathematical model was created in order to be used for prediction of Micro-harness value in different sintering conditions. Then the validity of the generated model was confirmed through the confirmation test and comparing the predicted values and experimental results. The obtained error confirmed the precision of model that can be applied for Micro-hardness prediction of the HA-coated layer.
Acknowledgement
The authors would like to acknowledge the Ministry of Higher Education of Malaysia and Universiti Teknologi Malaysia for providing research facilities.
Reference
Aksakal, B., Gavgali, M., & Dikici, B. (2010). The effect of coating thickness on corrosion resistance of hydroxyapatite coated Ti6Al4V and 316L SS implants. Journal of materials engineering and performance, 19(6), 894-899.
Eisenbarth, E., Velten, D., Müller, M., Thull, R., & Breme, J. (2004). Biocompatibility of β-stabilizing elements of titanium alloys. Biomaterials, 25(26), 5705-5713.
Frank A. Mu¨ ller et.al, In vitro apatite formation on chemically treated (P/M) Ti–13Nb–13Zr, dental materials, vol 24,2008, 50–56
Ghodsiyeh, Danial, Mohammadreza Askaripour Lahiji, Mahdi Ghanbari, Mostafa Rezazadeh Shirdar, and Abolfazl Golshan. "Optimizing Material Removal Rate (MRR) in WEDMing Titanium alloy (Ti6Al4V) using the Taguchi method." Res. J. Appl. Sci., Eng. Technol 4, no. 17 (2012): 3154-3161. Golshan, Abolfazl, Mostafa Rezazadeh Shirdar, and S. Izman. "A
Comparison of optimization methods in cutting parameters using Non-dominated Sorting Genetic Algorithm (NSGA-II) and micro genetic algorithm (MGA)." Int. J. of Experimental Algorithms 2, no. 2 (2011): 62-73.
Golshan, Abolfazl, Mostafa Rezazadeh Shirdar, Soheil Gohari, and Mohammadfarid Alvansazyazdi. "Optimization of Pre-Treatment Parameters before Diamond Coating using Non-dominated Sorting Genetic Algorithm (NSGA-II)." Advanced Materials Research 463 (2012): 399-405.
Gutiérrez, A., Paszti, F., Climent, A., Jimenez, J. A. & López, M. F. Comparative study of the oxide scale thermally grown on titanium alloys by ion beam analysis techniques and scanning electron microscopy. Journal of Materials Research, 2008, vol.23, pp.2245-2253
Hayashi, K., et al., Effect of surface roughness of hydroxyapatite—coated titanium on the bone-implant interface shear strength. Biomaterials, 1994. 15(14): p. 1187-1191.
Kim, H.-W., et al., Hydroxyapatite coating on titanium substrate with titania buffer layer processed by sol–gel method. Biomaterials, 2004. 25(13): p. 2533-2538.
Lahiji, M. A., M. Ghanbari, M. R. Shirdar, and M. R. Shirdar. "‘Optimizing Rough Cut in WED-Ming Titanium Alloy (Ti6Al4V) by Brass Wire Using the Taguchi Method." Journal of Basic and Applied Scientific Research 2, no. 8 (2012): 7488-7496.
Liu, D.-M., T. Troczynski, and W.J. Tseng, Water-based sol–gel synthesis of hydroxyapatite: process development. Biomaterials, 2001. 22(13): p. 1721-1730.
López, M. F., Gutiérrez, A., Jiménez, J. A., Martinesi, M., Stio, M. & Treves, C.. Thermal oxidation of vanadium-free Ti alloys: An X-ray photoelectron spectroscopy study. Materials Science and Engineering: C, 2010, vol.30, pp.465-471 Niinomi, M., Recent metallic materials for biomedical
applications. Metallurgical and materials transactions A, 2002. 33(3): p. 477-486.
O.S. Yildirim, B. Aksakal, H. Celik, Y. Vangolu, and A. Okur, An Investigation of the Effects of Hydroxyapatite Coatings on the Fixation Strength of Cortical Screws, J. Med. Eng. Phys., 2005, 27(3), p 221–228
Rack, H. and J. Qazi, Titanium alloys for biomedical applications. Materials Science and Engineering: C, 2006. 26(8): p. 1269-1277.
Rahaman, M.N., et al., Ceramics for prosthetic hip and knee joint replacement. Journal of the American Ceramic Society, 2007. 90(7): p. 1965-1988.
Shirdar, Mostafa Rezazadeh, Abolfazl Golshan, Sudin Izman, and Danial Ghodsiyeh. "The Application of Surface Response Methodology to the Pretreatment of WC Substrates Prior to Diamond Coating." Journal of materials engineering and performance 23, no. 1 (2014): 13-24. and Performance, 2013. DOI: 10.1007/s11665-013-0691-z