133
The learning officer decision matrix – a structural
equation modeling approach for the management
of asynchronous e-Learning projects
Nuno Pena, UnYLeYa Portugal and ISEG - School of Economics and Management, University of Lisbon, Portugal, [email protected]
Abstract
Effectiveness is one of the major concerns in corporate e-Learning and is critical when projects face financial and time-to-market constraints. Organizations and corporate universities seek methodologies and tools to help them manage more efficiently diverse e-Learning Projects. This paper describes the outcome of a case study on the assessment of the effectiveness of an e-Learning project (n =1317), from sixteen different corporations in the context of insurance and banking industry in Portugal. Results will be presented on the application of the methodology proposed by Levy for the assessment of the effectiveness of e-Learning systems. Based on the output of this assessment, this paper will present a new tool, the Learning Officer Decision Matrix, which will contribute to a more efficient management of corporate e-Learning projects.
Keywords: e-Learning, effectiveness, quality, asynchronous, Partial Least Squares.
Introduction
The concept of e-Learning is subject to constant change. An inclusive definition describes e-Learning as “an approach to teaching and learning, representing all or part of the educational model applied, that is based on the use of electronic media and devices as tools for improving access to training, communication and interaction and that facilitate the adoption of new ways of understanding and developing learning” (Sangrà, Vlachopoulos, & Cabrera, 2012).
In order to better delimit this wide-ranging concept, Negash and Wilcox (2008) proposed six types of Learning classifications: (1) Learning with physical presence and without e-communication (face-to-face), (2) e-Learning without presence and without e-e-communication (self-learning), (3) e- Learning without presence and with e-communication (asynchronous), (4) e-Learning with virtual presence and with e-communication (synchronous), (5) e-Learning with occasional presence and with communication (blended/hybrid-asynchronous), and (6) e-Learning with presence and with e-communication (blended/hybrid-synchronous).
134
Purpose of the Study and methodology
The main objectives of this paper are (1) to assess the effectiveness of an e-Learning project, more specifically, an asynchronous e-Learning project, (2) to determine and manage quality improvement measures of an asynchronous e-Learning project, and (3) based on the output of the previously stated objectives, to conceive a managerial instrument, a highly practical and accurate tool that can contribute to a more efficient management of corporate e-Learning projects. Consistent with its objectives, this paper is organized in the following manner. First, a case study on the assessment of the effectiveness of an e-Learning project (n =1317), from 16 different corporations in the context of insurance and banking industry in Portugal will be presented. Secondly, the results from this assessment of effectiveness, through the use of an online questionnaire, will be presented and analyzed based on the application of the methodology proposed by Levy (missing year of publication) for the assessment of the effectiveness of e-Learning systems. Since the original model was adapted for asynchronous e-e-Learning, a new model was restructured based on three dimensions and 41 characteristics. Next, in order to test this new model, author resorted firstly to exploratory factor analysis through Principle Component Analysis (PCA) and subsequent to the structured equation model (Partial Least Squares methodology). Finally, based on the output of these methodologic procedures, a new tool was conceived, a Learning Officer Decision Matrix, which will contribute to a more efficient management of corporate e-Learning Projects. The conclusions and recommendations round out the paper.
Assessment of effectiveness
An e-Learning project (Insurance Broker Training Program Certifications – General, Life, Non-life and Reinsurance) was developed based on IPTEACES e-Learning framework (Pena, & Isaias, 2012; 2013). IPTEACES (acronym for Involvement, Preparation, Transmission,
Exemplification, Application, Connection, Evaluation and Simulation) is an e-Learning Framework conceived to facilitate e-Learning by reducing diversity in programs facing a non-homogeneous audience. This instructional design framework was primarily developed through a pedagogical benchmark, mainly the Nine Events of Instruction (Gagne, Briggs, & Wager, 1992), Merrill (2002; 2007)’s Principles of Learning, Keller (2008)’s ARCS’s model, and van Merrienboer’s et al (2005), Ten Steps to Complex Learning (van Merriënboer & Kirschner, 2012), the investigating award winning e-courses (e.g. Brandon Hall Excellence in Learning Awards, International eLearning Association Awards), and Bersin & Associates' corporate E-Learning best practices.
135
Table 1: Characterization of student’s demographic indicators
Industry: 1,614 learners (43,3%) came from the insurance industry and 2112 learners (56,7%) from the banking industry.
Gender: 1,953 male learners (52,4%) and 1,773 female learners (47,6%).
Age groups:
Average of 34 years old, with a standard deviation of 8.8 years. Learners range from 18 years old to 71 years old. The distribution was higher in the age category between ‘24 and 34’ years old.
Academic Qualifications:
Secondary education 1,607 (43,1%); Undergraduate degree 1,447 (38,8%) and 522 with Primary Education (14,0%).
Residency: Residence shows a high variability; learners came from 18 regions of the Portuguese territory (majority of main cities)
Among the 3,726 learners who attended the Insurance Broker Training Program certifications e-courses, 3,542 passed the course (approbation rate of 95.0%), and 184 failed (failure rate of 4.9%). More precisely, concerning the three exam sessions, 3,100 learners (83,2%) were approved the first time they took the exam, 382 learners were approved on the second exam session (10,2%), and finally 60 learners on the third exam session (1,6%). The global average score of the learners was 82.5%, with a standard deviation of 11.0.
Among the 3,526 learners, 1,770 learners answered the survey of evaluation of satisfaction, obtaining a response rate of 50.2%. The analysis of the answers showed that, generally, the learners were satisfied or very satisfied with the courses, ranking their answers over 3 on a 4 point Likert scale. An overwhelming majority (76.9%) of the students did not have a previous e-Learning experience in a professional context.
This project produced results that are considered to fulfill the traditional main pedagogical objectives of a corporate e-Learning project. In the quest for effectiveness, the author searched to identify an international benchmark that could help identify the actual effectiveness of this e-Learning project and fundamentally to help recognize items for quality improvement. In the context of the assessment of e-Learning System's effectiveness, Levy (2006) as well as Levy, Murph, & Zanakisy 2009) developed an investigation by querying students concerning the characteristics of e-Learning systems that they value and consider important during their learning experience. This author states that it is not the number of satisfied students or the level of satisfaction that suggest the system’s effectiveness - it is the extent in which students are more
satisfied with the system performance with what they perceive as important.
136
instrument item scales ranged from (1) very unsatisfied to (6), extremely satisfied and (1) not important to (6) extremely important. Levy proposed 48 e-Learning System characteristics, grouped according to the four dimensions proposed by Webster and Hackley (1997)’s technology and support (14 characteristics), course (12 characteristics), professor (7 characteristics), and learner’s dimension (15 characteristics).
In order to determine the level of effectiveness of the Insurance Broker Training e-Learning project, the author applied Levy’s proposed methodology. Due to the specificity of this e-Learning project (asynchronous e-e-Learning), the Professor dimension was withdrawn (therefore seven characteristics directly linked with this dimension), leaving three dimensions and respectively 41 system characteristics – Dimension A “Technology and Support; Dimension B “Course” and Dimension D “Student” - ( cf. Appendix A).
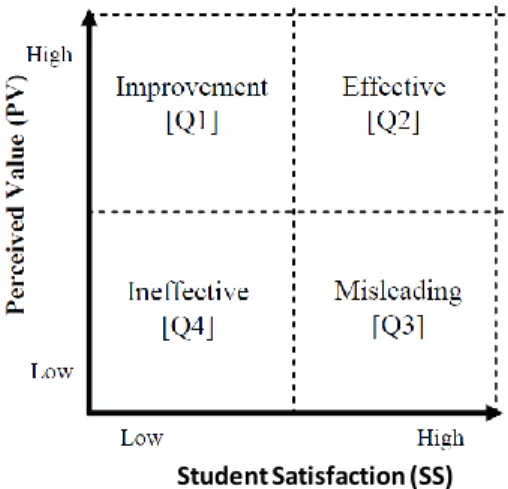
Levy (2006) as well as Levy et al. (2009) proposed two benchmark tools based on the outputs of the questionnaire that can be complemented: “the Value-Satisfaction grid” and “LeVIS index”. The objective of “Value-Satisfaction grid" is to provide an indication of action and improvement priorities for the e-Learning system dimension and the e-Learning system characteristics. The “Value-Satisfaction grid” was based on aggregated student perceived satisfaction as well as aggregated student-perceived value of e-Learning system characteristics. In this study the measures scale ranges from 1 to 6, while no scores were noted below 3 in satisfaction and below 3 in value, resulting in the use of 4.5 as the cutoff point between low and high on both axes of the grid.
Figure 1: The Value-Satisfaction grid (Levy, 2006; Levy et al., 2009)
The “ValuSatisfaction grid” does not provide however a measure of the magnitude of e-Learning system effectiveness and therefore should be complemented with another tool. The “LeVIS index” proposed by Levy (2006) provides that measure as an overall index of learners’ perceived effectiveness of e-Learning systems by combining e-Learning system value measures and e-Learning systems satisfaction measures. “LeVIS index” is proposed as a benchmarking tool combining the learners’ perceived value and satisfaction in order to indicate learners’ perceived e-Learning system's effectiveness.
137
The “Value-Satisfaction grid” suggests that it is not sufficient that only value or only satisfaction measures are high, rather the combination of both value and satisfaction. Consequently, the “LeVIS index” was proposed by Levy as the multiplication of the overall satisfaction (S◦) by the overall value (V◦). “LeVIS index” provides a score of the overall magnitude of the effectiveness of the e-Learning system under study. The magnitude of LeVIS provides that when LeVIS is near 0, this indicates very low learners’ perceived e-Learning system's effectiveness. When LeVIS is near 1, this indicates very high learners’ perceived e-Learning system's effectiveness. This measure provides that if only one of the two measures (S◦ or V◦) is high, the overall system measure (LeVIS) score is not high. As noted by Levy, an observed limitation of LeVIS is due to the equal importance given for value and satisfaction.
Assessing the effectiveness of the Insurance Broker e-Learning Project
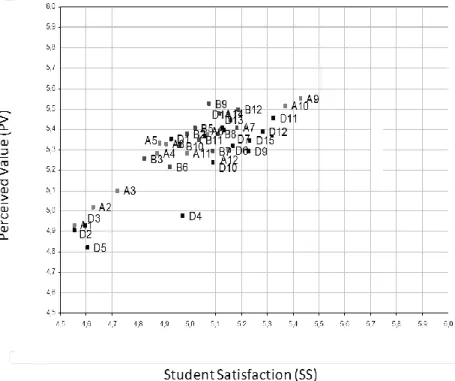
Due to corporate policies and constraints, the application of the adapted version of the online questionnaire targeted only 2,531 students of the original 3,726 students. The response rate was 52.03%, i.e., 1,317 trainees. More specifically, 59.6% of respondents were from the banking industry, 40.4% were from the insurance industry.Results from Overall Value-Satisfaction Grid are presented below:
Figure 2 – Overall Value-Satisfaction Grid (all dimensions)
The Overall Value-Satisfaction Grid shows that all the 41 e-Learning system characteristics are situated in the in the ‘Effective Quadrant’. All the characteristics and dimensions are considered
138
These seven e-Learning system characteristics positioned on the lower corner of the quadrant somehow represent that there are two groups (or sub-categories) that should be considered to have priority in terms of quality improvement: HelpDesk (A1, A2 and A3) originally corresponding to “Dimension A - Technology and Support” and Class (D3, D2, D4 and D5) originally corresponding to “Dimension D – Learner” - (cf. Appendix A).
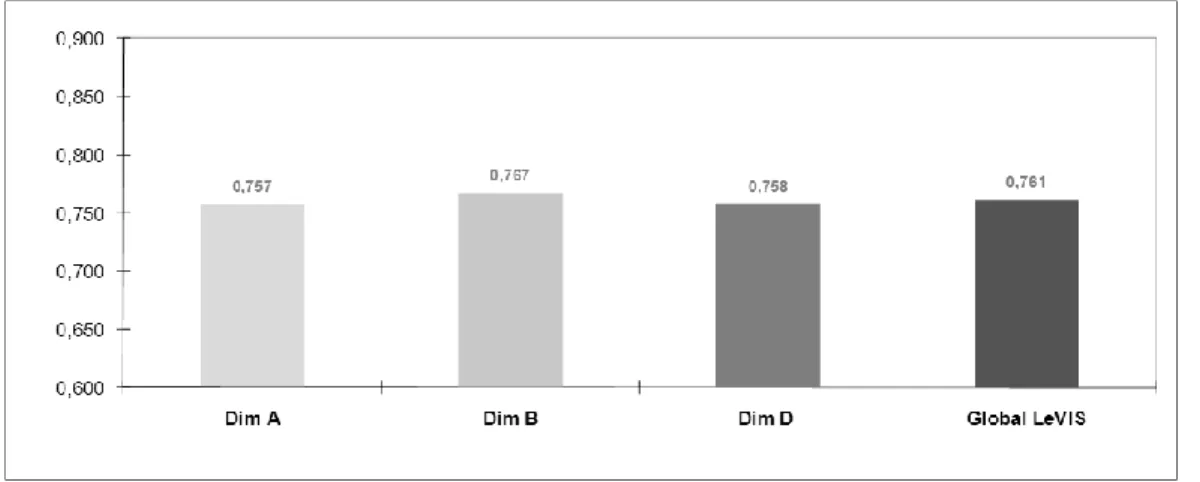
Results from the Global LeVIS index indicate (see Figure 3) that the overall e-Learning system under study reached a global LeVIS score of 0.781 and therefore should be classified as “High Effectiveness”. All the dimensions are above 0.75 global scores and therefore can be considered as having High Effectiveness, (Dimension A – 0.757; Dimension B – 0.767, Dimension D – 0.758), with a particular emphasis on Dimension B – Course which had the highest score of all dimensions.
Figure 3 – LeVIS index (all dimensions)
Testing the adapted Model
Based on the outputs of Overall Value-Satisfaction Grid, the author felt the need to review the new model based on three dimensions (adapted for asynchronous e-Learning) and to reanalyze their correspondent attributes (41 characteristics). In order to design and test the new model, the author used firstly exploratory factor analysis through Principle Component Analysis and subsequently structured equation model (Partial Least Squares methodology).
To perform the Exploratory Factor Analysis the author resorted to Principle Component Analysis (PCA) – (n=1317) with Varimax Rotation and Kaiser Normalization.
Table 2: Bartlett's sphericity test and Kaiser-Meyer-Olkin measure of sampling adequacy
Kaiser-Meyer-Olkin measure of sampling adequacy. .980
Bartlett's test of sphericity
Chi - Square 32250,824
Degrees of Freedom 820
139
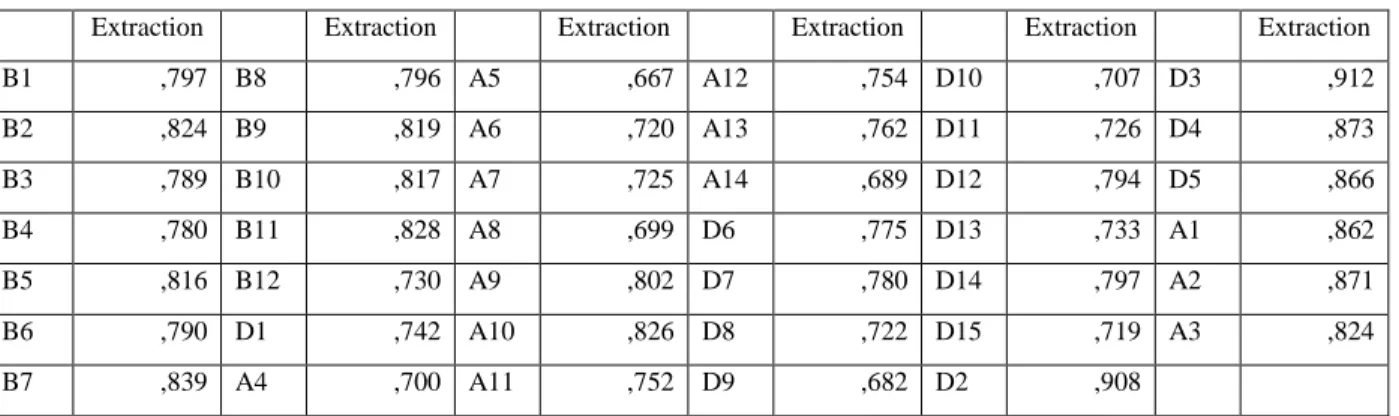
Table 3, below, presents commonalities and the total explained variance.
Table 3: Presentation of Factors - Rotation Method: Varimax with Kaiser Normalization.
Extraction Extraction Extraction Extraction Extraction Extraction
B1 ,797 B8 ,796 A5 ,667 A12 ,754 D10 ,707 D3 ,912
B2 ,824 B9 ,819 A6 ,720 A13 ,762 D11 ,726 D4 ,873
B3 ,789 B10 ,817 A7 ,725 A14 ,689 D12 ,794 D5 ,866
B4 ,780 B11 ,828 A8 ,699 D6 ,775 D13 ,733 A1 ,862
B5 ,816 B12 ,730 A9 ,802 D7 ,780 D14 ,797 A2 ,871
B6 ,790 D1 ,742 A10 ,826 D8 ,722 D15 ,719 A3 ,824
B7 ,839 A4 ,700 A11 ,752 D9 ,682 D2 ,908
The saturations of the variables in each factor have been always above the required minimum of 40%, which is confirmed by the following structure of five factors:
Factor 1 – Course Contents: This factor is related to the availability and quality of the content of the course and includes 13 items (α = 0.977);
Factor 2 - Accessibility / Asynchronous: This factor includes 11 items related to accessibility and operability of access to the course (α = 0.957). The variable A4 (System operation time (up-time)), included in this factor, is slightly more associated with Factor 5, however, due to the similarity of values and theoretical relevance, the author chooses to keep this variable associated factor 2.
Factor 3 - Perceived Value: The third factor includes 10 items (α = 0.959), which are related to perceived value in the possibility of reconciling the course with daily and professional activities as well as extra-professional activities.
Factor 4 - Class: The class factor includes four items related to peer interaction in training (α = 0.962).
Factor 5 - Helpdesk: This factor includes three items of response, related to quality and support provided by the helpdesk (α = 0.939).
Grouping Factor - There is, therefore, an appropriate grouping factor. The internal consistency analysis produced results that allow verifying the suitability of the factors identified. The Cronbach's alpha (α) had values well above 0.7, which indicate a high internal consistency. In factor 2, the Cronbach's alpha (α) of 0.957 also allows supporting the decision to keep the item “A4” associated with this factor, since its elimination would result in a lower level of consistency factor (0.957 to 0.954).
Structural Equation Modeling
140
variable in the study - Global LeVIS – the author resorted to Structural Equation Model, more specifically, to Partial Least Squares (PLS) methodology. “Educational researchers frequently work in a situation with massive amounts of data, but the relative scarcity of theoretical knowledge. In such a problem area, partial least squares (PLS) path analysis with latent constructs is a useful and flexible tool for statistical model building. The use of PLS may be considered especially when the research situation at hand demands the investigation of complex models in an exploratory rather than a confirmatory fashion” (Sellim, 1995).
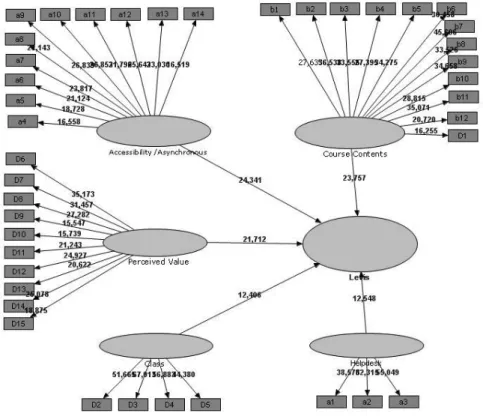
Figure 4: Partial Least Squares - Values of T for the correlations
Table 4: Synthesis of Global data model quality (PLS)
Average variance extracted
Composite
Reliability Cronbach’s Alpha Commonality Redundancy
Levis 0,5938 0,9835 0,9826 0,5938 0,2527
Accessibility
/Asynchronous 0,6868 0,9602 0,9543 0,6868 0,0000 Course Contents 0,7681 0,9773 0,9747 0,7681 0,0000
Helpdesk 0,8856 0,9587 0,9355 0,8856 0,0000
Class 0,9003 0,9731 0,9631 0,9003 0,0000
141
The average extracted variance for each factor exceeds the minimum required value of 0.50 (Fornell & Bookstein, 1981). In this case, all values from the Internal Consistency Composite exceed 0.96. The model based on five proposed factors - Course Content, Accessibility / Asynchronous, Perceived Value, Class and Helpdesk - was totally confirmed. Appendix B presents detailed results from the PLS model.
Chief Learning Officers’ Decision Matrix
In the quest for “excellence” and in order to support a systematic program of actions to be implemented in line with a continuous quality improvement, the author performed the identification of indicators, which represent priorities’ to act on. In order to conceive a new tool which could contribute to a more efficient management of corporate e-Learning Projects, author developed the “Learning Officer Decision Matrix” (LODM). LODM has as input the data produced by LeVIS index as well as the data resulting from Partial Least Squares, based on the new model of three dimensions and their correspondent attributes (specially adapted for asynchronous e-Learning).
Below are descriptions of concepts used in the following tables:
Concepts:
Factors Standardized Weights – standardized output of PLS Path Coefficients, specifically “Original Sample”;
Items Standardized Weights – standardized output of PLS Outer Weights; LeVIS – Score from students (Standardized (satisfy * important));
Excellence = 1 (i.e., 100%);
Market Deviation = Excellence – LeVIS score;
Competitive Deviation = Market Deviation * Standardized Weights; Effort = Standardized Competitive Deviation;
Priorities = Ranking of Effort.
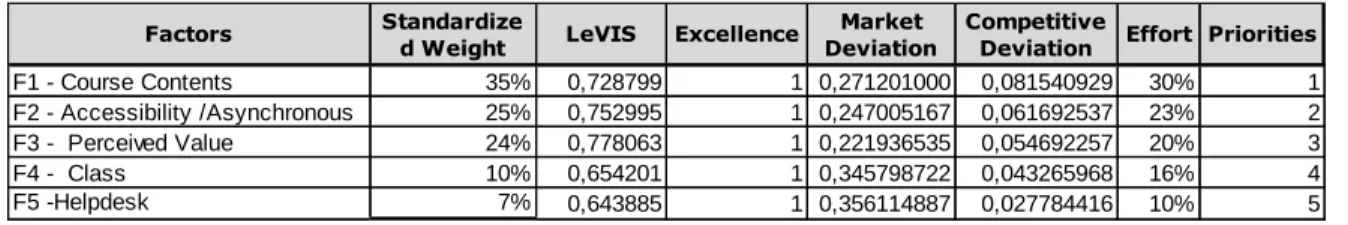
Based on the outputs resultant from Structural Equation Modeling through PLS, table 5 below presents the ranking of the five dimensions priorities for quality improvement intervention, i.e., the factors (dimensions) which can contribute more to raise Global LeVIS score.
Table 5 – Dimension improvement ranking
142
The factor 1 – “Course Contents” emerges as the first priority factor for action improvement, which should be invested an effort of 35% to improve effectiveness, i.e., to improve Global LevIS. The second factor “Accessibility / Asynchronous” emerges as second priority to invest, where the effort should be about 25%, while the third factor “Perceived Value” is the third priority of intervention that requires an effort of 24%. Factors “Class” and “Helpdesk” are the 4th and 5th priority, which should focus respectively 10% and 7% of intervention efforts at the level of measures to improve global LeVIS.
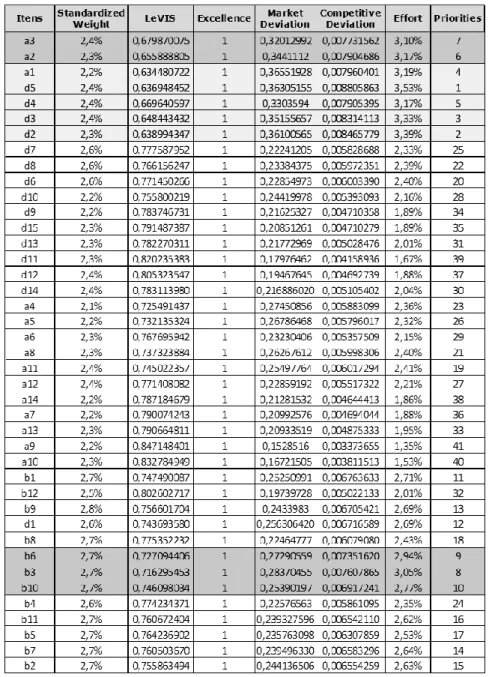
As the next step and in order to identify more detail priorities for action improvement, specifically with regard to each item (characteristic) belonging to each factor (dimension), the author performed the analysis of the priorities of every single indicator/characteristic (cf. Appendix A).
Data presented in Table 6 reveals that the first priorities for action improvement relate to the three items linked to “class”, in which item D5 “Being part of a ‘class’ although it was online” should be the first priority intervention, representing 3.53% of the improvement efforts. D2 “Amount of interaction with classmates” and D3 -" Quality of interaction with classmates ", appear as the second and third priority, requiring respectively 3.39% and 3.33% of the intervention efforts.
Data also shows that item A1 - “Quick answer from technical support (HelpDesk) via phone", performance-related to the helpdesk, is the fourth priority for action, representing an effort of 3.19%. After the fifth priority item D4 - “Classmates’ attitude (across all courses)” which is again related to Class Dimension, requires 3.17% of intervention efforts of improvement actions. Subsequently, items A2 - " Quick answer from technical support (Help Desk) after-hours via e-mail” and A3 " Quality of technical support (Help Desk)”, again related to the Helpdesk Dimension, represent, respectively the 6th and 7th priority, which should be invested 3.17% and 3.10% of the effort.
143
and B10 – “Gathering information quickly” are respectively the 8th, 9th and 10th priorities where intervention efforts should be 3.05%, 2.94% and 2.77% respectively.
Table 6 – Improvement ranking for all items
Conclusion and Further Research Directions
144
this e-Learning project. Results showed that the Global LeVIS of the e-Learning system under study reached a score of 0.781 and therefore should be classified as “highly effective”. All of the 41 e-Learning system characteristics were situated in the in the ‘Effective Quadrant’. In order to review the new model based on three dimensions (adapted for asynchronous e-Learning) and also to reanalyze their corresponding attributes, the author performed a firstly exploratory factor analysis through Principle Component Analysis and subsequently a structural equation model (Partial Least Squares methodology). Based on the output of these methodology procedures, the author developed a new tool, a Learning Officer Decision Matrix, which will contribute to a more efficient management of corporate e-Learning Projects. The Learning Officer Decision Matrix (LODM) produces practical and actionable information for decision making and gives metrics such as “priorities” and “effort” that are more understandable and pragmatic for managers. Managers can replicate the proposed procedure in order to gain more intelligibility on their own projects and mainly to manage more efficiently corporate Learning systems and e-Learning projects. More importantly, LODM provides impartial and accurate information that can support managers on how they should apply and distribute adequately their budgets in quality improvement specific areas of their projects and the expected impact that each measures will produce (dimension level and characteristic level).
This study is however limited to a specific e-Learning project, in Portugal, although the number of students under study (n=1317) and Organizations (n=16) is statistically representative. The Learning Officer Decision Matrix (LODM) was developed specifically for asynchronous e-Learning Project, though it can be adapted for other types of e-e-Learning and/or blended e-Learning projects. Further research with larger and more diverse typologies of e-Learning projects is required in the future to strengthen the research findings.
References
Bersin, & Associates. (2012). Learning Leaders is now the Bersin and Associates Whatworks Awards. Retrieved from http://bersin.com/wwawards/
Brandon Hall Group. (2012). Winners of the 2012 Brandon Hall Excellence in Learning Awards. Retrieved from http://www.brandonhall.com/awards/excellence-in-learning/winners-of-the-2012.html
Cronbach, L. J., & Shavelson, R. J. (2004). My current thoughts on coefficient alpha and successor procedures. Educational and Psychological Measurement, 64(3), 391-418.
Fornell, C., & Bookstein, F. L. (1982). The two structural equation models: LISREL and PLS applied to customer exit-voice theory. Journal of Marketing Research, 19, 440–452.
145
Keller, J. M. (2008). First principles of motivation to learn and e3‐learning. Distance Education,
29(2), 175-185.
Levy, Y. (2006). Assessing the value of e-Learning systems. Hershey, PA: Information Science Publishing.
Levy, Y. Murph, K. & Zanakisy (2009). A Value-Satisfaction Taxonomy of IS Effectiveness (VSTISE): A Case Study of User Satisfaction with IS and User-Perceived Value of IS.
International Journal of Information Systems in the Service Sector, 1(1), 93-118.
Merrill, M. D. (2002). First principles of instruction. Educational technology research and development, 50(3), 43-59.
Merrill, M. D. (2007). First Principles of Instruction: A Synthesis. In R. A. Reiser & J. V. Dempsey (Eds.), Trends and Issues in Instructional Design and Technology. Columbus: Ohio: Merrill Prentice Hall.
Negash, S., & Wilcox, V. M. (2008). E-Learning Classifications: Differences and Similarities. In Negash, S., Whitman, M., Woszczynski, A., Hoganson, K., and Mattord, H. (Eds.),
Distance Learning for Real-Time and Asynchronous Information Technology Education, IGI Global, Hershey: Information Science Reference.
Nisbet, R., Elder, J. & Miner, G. (2009). Handbook of statistical analysis and data mining applications. London: Academic Press.
Sangrà, A., Vlachopoulos, D., & Cabrera, N. (2012). Building an inclusive definition of e-Learning: An approach to the conceptual framework.The International Review Of Research In Open And Distance Learning, 13(2), 145-159.
Van Merrienboer, J. J., & Sweller, J. (2005). Cognitive load theory and complex learning: Recent developments and future directions. Educational psychology review, 17(2), 147-177.
Van Merriënboer, J. J., & Kirschner, P. A. (2012). Ten steps to complex learning: A systematic approach to four-component instructional design. Routledge.
146
Appendix A – e-Learning System Characteristics
TECHCNOLOGY AND SUPPORT DIMENSION
A1 Quick answer from technical support via phone
A2 Quick answer from technical support after-hours via e-mail
A3 Quality of technical support
A4 System operation time (up-time)
A5 Reduced system errors
A6 System security (discourage hacking, secure access, etc.)
A7 Access to courses from anywhere in the world (via the Internet)
A8 High Network availability & Low network congestion
A9 Learning at any time of the day (schedule flexibility)
A10 Submit assignments from anywhere (via the Internet)
A11 Different system tools (chat, bulletin-board or discussion forums, etc.)
A12 Access of all courses from one area (My LMS)
A13 Taking quizzes remotely (off-campus)
A14 Review course materials
COURSE DIMENSION
B1 Availability of course content
B2 Quality content of courses
B3 Amount of material in courses
B4 Interesting subject matter
B5 Difficulty of subject matter
B6 Availability of other content (syllabus, objectives, assignments, schedule)
B7 Enjoyment from the courses/lessons
B8 Ease-of-use (with course content, navigation, interface, etc.)
B9 Similar of interface across all online courses
B10 Gathering information quickly
B11 Organization of courses (content of courses, organization of assignments, etc. across all course
modules)
B12 Taking practice tests prior to graded test
LEARNER DIMENSION
D1 Learning a lot in these classes
D2 Amount of interaction with classmates
147
D4 Classmates’ attitude (across all courses)
D5 Being part of a ‘class’ although it was online
D6 Your comfort with online learning and technology
D7 Your Internet and computer skills
D8 Self-discipline and time management
D9 Cost of courses
D10 Cost of ISP and Internet access
D11 Reduced travel cost/time (to and from campus)
D12 Ability to travel while taking online courses (for business or other)
D13 Employer support and your ability to work while learning
D14 Attendance to family responsibilities
148
Appendix B - Partial Least Squares: Outer Weights and Path Coefficients
Course
Contents
Accessibility/
Asynchronous
Perceived Value
Class Helpdesk Levis
b1 0,0877 0,0343
b2 0,0879 0,0344
b3 0,0878 0,0343
b4 0,0850 0,0332
b5 0,0876 0,0343
b6 0,0882 0,0345
b7 0,0900 0,0352
b8 0,0886 0,0346
b9 0,0902 0,0353
b10 0,0892 0,0349
b11 0,0895 0,0350
b12 0,0833 0,0325
D1 0,0858 0,0335
a4 0,1038 0,0290
a5 0,1048 0,0293
a6 0,1117 0,0312
a7 0,1083 0,0303
a8 0,1106 0,0309
a9 0,1069 0,0299
a10 0,1104 0,0308
a11 0,1143 0,0319
a12 0,1169 0,0327
a13 0,1128 0,0315
a14 0,1057 0,0295
D6 0,1300 0,0348
D7 0,1297 0,0347
D8 0,1264 0,0338
D9 0,1078 0,0288
D10 0,1093 0,0292
149
D12 0,1193 0,0319
D13 0,1143 0,0306
D14 0,1165 0,0312
D15 0,1118 0,0299
D2 0,2594 0,0277
D3 0,2616 0,0280
D4 0,2647 0,0283
D5 0,2683 0,0287
a1 0,3359 0,0260
a2 0,3543 0,0274
a3 0,3725 0,0288
Original sample
(O)
Sample mean (M)
Standard Deviation
(STDEV)
Standard Error
(STERR)
Statistica l T
p
Accessibility/
Asynchronous -> Levis
0,2794 0,2787 0,0115 0,0115 24,3406 <0,001
Course Contents -> Levis 0,3909 0,3925 0,0165 0,0165 23,7574 <0,001
Helpdesk -> Levis 0,0773 0,0761 0,0062 0,0062 12,5478 <0,001
Class -> Levis 0,1069 0,1075 0,0086 0,0086 12,4063 <0,001
Perceived Value -> Levis 0,2674 0,2668 0,0123 0,0123 21,7117 <0,001
Path Coefficients – Correlation coefficients between factors and Dimension
Author's Biography