Research Article
A study of visual evoked potentials and effect of relaxation technique in
patients with migraine
Dalia A. Biswas*, Meghana A. Gaikwad
INTRODUCTION
Migraine is a common disorder seen in the neurology outpatient department, all over the world. It is a much under-diagnosed and under-managed disorder. These cases are usually passed off as headache without characterization. In view of inadequate and correct diagnosis, such cases are deprived of specific treatment. Absence of empathy and accuracy of diagnosis by the physician are partly responsible for the recurrence of episodes of headache leading to anxiety and depression. Various causes of this problem have been hypothesized based on family researches. There are a number of genetic loci, which have been speculated as the primary defects in migraine patients. Familial migraine is the only type of migraine having a definite genetic basis. Among the families with a history of headache, a large number of
cases showed inheritance from the maternal side.1 Stress is a well-known trigger factor for migraine.2 There is lack of data regarding the epidemiology of migraine in India, specially the family researches. Literature review shows that migraine is more frequent in the female population. An epidemiological report from United States showed migraine in 18% women and 6% men with a female:male ratio of 3:1.3
The international headache society criteria classification4 shows majority of the patients of migraine did not have aura during the attacks3 and the prevalence was 83.8%. Migraine with aura was less prevalent while complications due to migraine were rare.
Irrespective of its genetic basis, the incidence and severity of the headache is modified by environmental
ABSTRACT
It is a cross-sectional comparative study in which comparison was done between 1) group A comprising of 15 cases of migraine (without aura) on medication only, 2) group B comprising of 15 cases of migraine (without aura) and practicing Rajyoga meditation and deep breathing and 3) control group who were 15 age matched normal subjects. This study was conducted in the interictal period. The most striking finding was - A decrease in P100 (ms) at post-test in both the eyes in group B, (though this finding is not significant), in contrast to group A which showed a significant increase in P100 (ms) at post-test. Both the groups showed an increase in P100-N75 (µv) & this finding was not significant in both. Multiple comparisons using Tukey test and one way ANOVA showed significant finding between groups and within groups for P100 and N145 latencies for the right eye. No such difference was seen with left eye. We conclude that Rajyoga meditation and deep breathing can be used as adjuncts to routine antimigraine therapy. We advocate the continuous practice of these interventions which might decrease the frequency of attacks & finally the elimination of this problem.
Keywords: Rajyoga meditation, Migraine, Antimigraine therapy
Department of Physiology, Jawaharlal Nehru Medical College, Sawangi (Meghe), Wardha, Maharashtra, India
Received: 25 April 2014
Accepted: 8 May 2014
*Correspondence:
Dr. Dalia A. Biswas,
E-mail: [email protected]
© 2014 Biswas DA et al. This is an open-access article distributed under the terms of the Creative Commons
Attribution Non-Commercial License, which permits unrestricted non-commercial use, distribution, and reproduction in any medium, provided the original work is properly cited.
factors. The most common factors are travel, hunger, mental tension, lack of sleep, watching television and various odor producing substances ranging from perfumes and incense to petrol, cigarette smoke and body odor.5
Visual symptoms and photophobia are common features of migraine, but are not exclusively confined to attacks. Hypersensitivity to light and grating patterns of definite spatial frequency have been shown to persist even between attacks. Recent researches have shown that, differences in information processing are not limited to the visual system only but are also associated with central hypersensitivity, which may be genetic to some extent. The important aspect of central information-processing dysfunction is found to be reduced habituation to stimuli, specially, for Visual Evoked Potentials (VEP). A widely accepted and standardized test to assess excitability in the occipital cortex is the Visual Evoked Potential (VEP).2
Lifestyle and behavior modification programmes can significantly lower the frequency and severity of migraines in some people. Stress management, relaxation techniques, and cognitive behavioral therapy don't work for all people for migraine prevention. However, these techniques can be pursued without fear of unwanted side effects. By reducing stress levels, many individuals also reduce muscle tension in the neck and shoulder area, which can both aggravate and cause headaches.6 Thus, this study was taken up to check the hypothesis that relaxation method like Rajyoga meditation has beneficial effects in migraine patients (without aura) as assessed by Pattern Reversal Visual Evoked Potentials (PRVEP).
METHODS
This study was conducted in the neuro-physiology lab of department of physiology, Jawaharlal Nehru medical college, Sawangi (Meghe), Wardha.
It is a cross-sectional comparative study. Group A and B consisted of patients attending the Acharya Vinoba Bhave Rural Hospital (A.V.B.R.H.) Sawangi medicine out-patient department. The diagnosis of migraine was confirmed at the time of patient recruitment based on criteria laid down by the International Headache Society (IHS) in 1988.
Subjects
All subjects had normal visual acuity and no visual abnormalities. Migraine frequency varied between 1-2 attacks per week to 1 attack per 6 mths. Group A consisted of 15 migraine subjects on medication only. Group B consisted of 15 migraine subjects on medication and practicing deep breathing and Rajyoga meditation. The control group were 15 ages matched normal subjects. This study was conducted in the interictal period. The
Inclusion criteria for the study
1. Patients having episodes of migraine headaches for at least 2 years and suffered at least 2 attacks per month in the last quarter year.
2. Not taken preventive therapy for migraine during the preceding 6 months.
3. Occasional use of analgesics, ergotamine, sumatriptan and antiemetics for acute attack.
4. No other neurological, ophthalmological or systemic disease known to cause abnormalities in VEP.
5. With normal or corrected normal vision.
Exclusion criteria for study group
1. Patients with any neurological, ophthalmological or systemic disease known to cause abnormalities in VEP.
2. Patients on preventive therapy for migraine during the preceding 6 months.
Study parameters
1. Peak P100 latencies.
2. P100 amplitude (N75-P100).
3. Interocular latency difference.
Experimental design and recordings
Subjects were sited at a distance of 100 cms from a TV monitor, which was attached to a polywrite (RMS make). The TV monitor displayed a reversal checker board pattern with a fluctuating red point. The subjects were asked to concentrate on this red point. A 2 channel montage was used for recording VEP which is as follows - Channel 1 as Oz to Fpz and channel 2 as Oz to linked ear.
recommendation for VEP study (IFCN). The latency of N75, P100, N145 & P100- N75 (µv) was measured.
Relaxation technique
Comprised of deep breathing and Rajyoga meditation.
Deep breathing
It is simple breathing through the nose, letting the stomach expand as much as possible. The hands are firmly and comfortably placed on the r stomach during the exercise. After deep inspiration, breath was held for a few seconds, and then expired slowly through the mouth. This procedure is repeated for 3 or 4 times a day.
Meditation
Rajyoga meditation was practiced in 3 steps namely- Initiation, Concentration & Realization.
Statistical Analysis
It was done using SPSS version 14 and significance was set at P <0.05. Student’s t test, Tukey test and one way ANOVA was used for multiple comparisons.
RESULTS
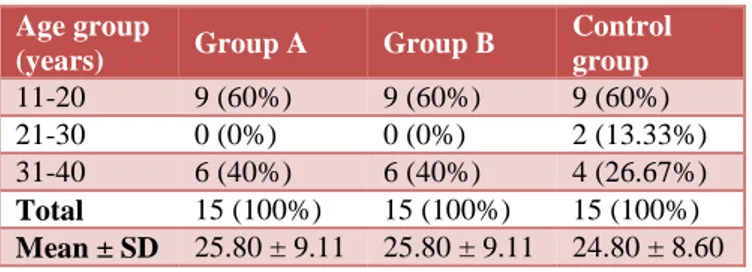
The age group of subjects was from 11-40 years with a mean age of 26 years as seen from Table 1. 8 male subjects and 7 female subjects comprised both the groups with an age matched control group having 9 males and 6 females respectively (Table 2).
Table 1: Age wise distribution of patients in three groups.
Age group
(years) Group A Group B
Control group
11-20 9 (60%) 9 (60%) 9 (60%)
21-30 0 (0%) 0 (0%) 2 (13.33%)
31-40 6 (40%) 6 (40%) 4 (26.67%)
Total 15 (100%) 15 (100%) 15 (100%)
Mean ± SD 25.80 ± 9.11 25.80 ± 9.11 24.80 ± 8.60
Figure 1: Age wise distribution of patients in three groups.
Table 2: Gender wise distribution of patients in three groups.
Gender Group A Group B Control
group Male 8 (53.33%) 8 (53.33%) 9 (60%) Female 7 (46.67%) 7 (46.67%) 6 (40%)
Total 15 (100%) 15 (100%) 15 (100%)
Figure 2: Gender wise distribution of patients in three groups.
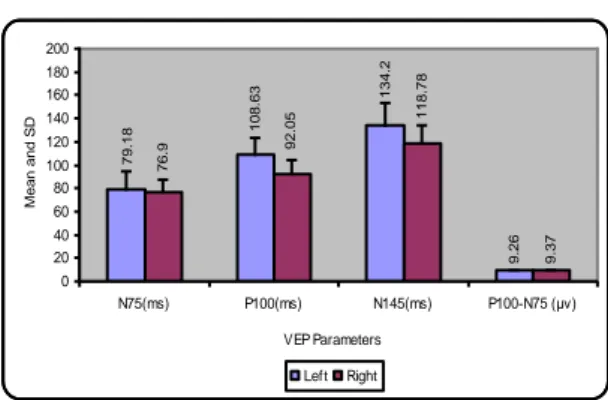
A comparison of VEP parameters in group A at pre-test for right and left side showed a significant P100 (ms) finding whereas, post test data showed both P100 (ms) and N145 (ms) as significant finding. The P100 (ms) showed an increase in the left eye at post-test which indicates no beneficial effect (Table 3 & 4).
Table 3: Comparison of VEP parameters in groups A at pre-test for right and left side.
Left Right t value P value
N75 (ms) 84.24 ± 14.16 83.25 ± 17.81 0.217 0.831 NS, P >0.05 P100 (ms) 103.82 ± 14.93 114.86 ± 12.36 2.394 0.031 S, P <0.05 N145 (ms) 137.16 ± 13.73 145.34 ± 14.71 1.215 0.245 NS, P >0.05 P100-N75 (μv) 8.98 ± 0.89 9.00 ± 0.71 0.213 0.834 NS, P >0.05
60% 60% 60%
0% 0%
1
3
.3
3
%
40% 40%
2
6
.6
7
%
0% 10% 20% 30% 40% 50% 60% 70% 80% 90% 100%
%
o
f
p
a
ti
e
n
ts
11--20 21-30 31-40
Age Group(years) Group A Group B Control Group
5
3
.3
3
%
5
3
.3
3
%
60%
4
6
.6
7
%
4
6
.6
7
%
40%
0% 10% 20% 30% 40% 50% 60% 70% 80% 90% 100%
%
o
f
p
a
ti
e
n
ts
Male Female Gender
Table 4: Comparison of VEP parameters in groups A at post-test for right and left side.
Left Right t value P value
N75 (ms) 79.18 ± 14.87 76.90 ± 11.11 0.391 0.702 NS, P >0.05 P100 (ms) 108.63 ± 14.87 92.05 ± 11.59 4.887 0.000 S, P <0.05 N145 (ms) 134.20 ± 19.17 118.78 ± 15.93 2.170 0.048 S, P <0.05 P100-N75 (μv) 9.26 ± 0.81 9.37 ± 0.70 2.086 0.056 NS, P >0.05
Figure 3: Comparison of VEP parameters in groups A at pre-test for right and left side.
Figure 4: Comparison of VEP parameters in groups A at post-test for right and left side.
Table 5: Comparison of VEP parameters in groups B at pre-test for right and left side.
Left Right t value P value
N75 (ms) 86.60 ± 12.69 81.07 ± 11.95 1.691 0.113 NS, P >0.05 P100 (ms) 110.53 ± 14.07 114.88 ± 10.82 1.061 0.306 NS, P >0.05 N145 (ms) 140.58 ± 13.12 144.30 ± 13.47 0.709 0.490 NS, P >0.05 P100-N75 (μv) 8.82 ± 0.99 8.84 ± 0.92 0.100 0.921 NS, P >0.05
Table 6: Comparison of VEP parameters in groups B at post-test for right and left side.
Left Right t value P value
N75 (ms) 84.78 ± 12.36 83.38 ± 15.49 0.365 0.721 NS, P >0.05 P100 (ms) 109.10 ± 12.87 111.74 ± 13.26 0.784 0.446 NS, P >0.05 N145 (ms) 139.38 ± 12.42 142.38 ± 13.61 0.650 0.526 NS, P >0.05 P100-N75 (μv) 8.97 ± 0.92 9.04 ± 0.87 0.496 0.628 NS, P >0.05
8 .9 8 9 1 3 7 .1 6 1 0 3 .8 2 8 4 .2 4 1 4 5 .3 4 1 1 4 .8 6 8 3 .2 5 0 20 40 60 80 100 120 140 160 180 200
N75(ms) P100(ms) N145(ms) P100-N75 (μv) VEP Parameters M e a n a n d S D Left Right 9 .2 6 9 .3 7 1 3 4 .2 1 0 8 .6 3 7 9 .1 8 1 1 8 .7 8 9 2 .0 5 7 6 .9 0 20 40 60 80 100 120 140 160 180 200
N75(ms) P100(ms) N145(ms) P100-N75 (μv) VEP Parameters M e a n a n d S D Left Right 8 .8 2 8 .8 4 1 4 0 .5 8 1 1 0 .5 3 8 6 .6 1 4 4 .3 1 1 4 .8 8 8 1 .0 7 0 20 40 60 80 100 120 140 160 180 200
N75(ms) P100(ms) N145(ms) P100-N75 (μv) VEP Parameters M e a n a n d S D Left Right 8 .9 7 9 .0 4 1 3 9 .3 8 1 0 9 .1 8 4 .7 8 1 4 2 .3 8 1 1 1 .7 4 8 3 .3 8 0 20 40 60 80 100 120 140 160 180 200
Table 7: Comparison of VEP parameters in control group right and left side.
Left Right t value P value
N75 (ms) 82.80 ± 12.73 82.92 ± 12.83 0.491 0.631 NS, P >0.05 P100 (ms) 102.48 ± 15.25 103.68 ± 14.66 0.884 0.392 NS, P >0.05 N145 (ms) 138.16 ± 16.87 139.81 ± 16.93 0.762 0.459 NS, P >0.05 P100-N75 (μv) 8.86 ± 0.91 8.92 ± 0.81 1.058 0.308 NS, P >0.05
Figure 7: Comparison of VEP parameters in control group right and left side.
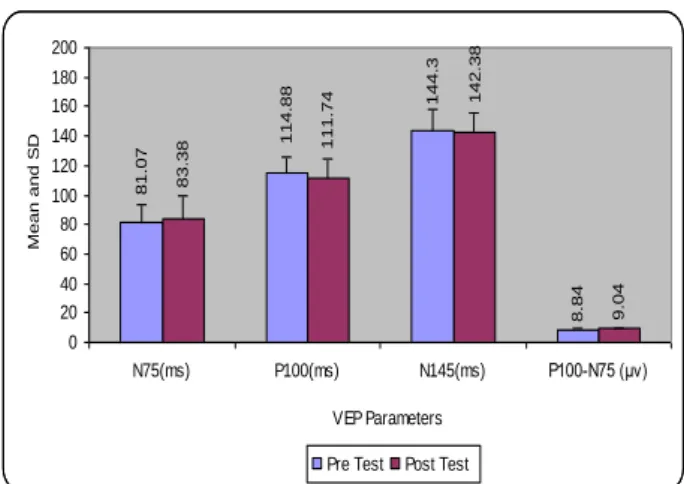
For group B, the pre-test and post-test for right and left eye showed no significant finding , though a decrease in the latency was observed regarding N75, P100 and N145 (ms) at post-test. This decrease in latency at post test is an important finding (Table 5 & 6). Table 7, showed no interocular latency & amplitude difference in the control group.
The comparison of VEP parameters in group A at pre and post-test of left eye showed a significant P100-N75 (µv) finding (Table 8). Whereas for right eye as per Table 9, a significant finding of 2 latencies namely P100 (ms) and N145 (ms) was seen. P100-N75 (µv) finding was also significant (Table 9). When these same comparisons were done for group B of left & right eye, it was seen that the finding of P100-N75 (µv) was significant (Table 10 & 11).
Table 8: Comparison of VEP parameters in group A, pre and post-test, left eye.
Pre-test Post-test t value P value
N75 (ms) 84.24 ± 14.16 79.18 ± 14.87 0.959 0.354 NS, P >0.05 P100 (ms) 103.82 ± 14.93 108.63 ± 14.87 0.854 0.407 NS, P >0.05 N145 (ms) 137.16 ± 13.73 134.20 ± 19.17 0.510 0.618 NS, P >0.05 P100-N75 (μv) 8.98 ± 0.89 9.26 ± 0.81 3.400 0.004 S, P <0.05
Table 9: Comparison of VEP parameters in group A, pre and post-test, right eye.
Pre-test Post-test t value P value
N75 (ms) 83.25 ± 17.81 76.90 ± 11.11 1.283 0.220 NS, P >0.05 P100 (ms) 114.86 ± 12.36 92.05 ± 11.59 5.066 0.000 S, P <0.05 N145 (ms) 145.34 ± 14.71 118.78 ± 15.93 5.710 0.000 S, P <0.05 P100-N75 (μv) 9.00 ± 0.71 9.37 ± 0.70 3.157 0.007 S, P <0.05
Table 10: Comparison of VEP parameters in group B, pre and post-test, left eye.
Pre-test Post-test t value P value
N75 (ms) 86.60 ± 12.69 84.78 ± 12.36 1.469 0.164 NS, P >0.05 P100 (ms) 110.53 ± 14.07 109.10 ± 12.87 1.452 0.169 NS, P >0.05 N145 (ms) 140.58 ± 13.12 139.38 ± 12.42 1.061 0.306 NS, P >0.05 P100-N75 (μv) 8.82 ± 0.99 8.97 ± 0.92 2.323 0.036 S, P <0.05
8
.8
6
8
.9
2
1
3
8
.1
6
1
0
2
.4
8
8
2
.8
1
3
9
.8
1
1
0
3
.6
8
8
2
.9
2
0 20 40 60 80 100 120 140 160 180 200
N75(ms) P100(ms) N145(ms) P100-N75 (μv) VEP Parameters
M
e
a
n
a
n
d
S
D
Table 11: Comparison of VEP parameters in group B, pre and post-test, right eye.
Pre-test Post-test t value P value
N75 (ms) 81.07 ± 11.95 83.38 ± 15.49 1.840 0.087 NS, P >0.05 P100 (ms) 114.88 ± 10.82 111.74 ± 13.26 1.839 0.087 NS, P >0.05 N145 (ms) 144.30 ± 13.47 142.38 ± 13.61 1.000 0.334 NS, P >0.05 P100-N75 (μv) 8.84 ± 0.92 9.04 ± 0.87 3.623 0.003 S, P <0.05
Figure 8: Comparison of VEP parameters in group A, pre and post-test, left eye.
Figure 9: Comparison of VEP parameters in group A, pre and post-test, right eye.
Figure 11:Comparison of VEP parameters in group B, pre and post-test, right eye.
Thus it was seen that the group B showed an important finding of decrease in P100 latency at post-test in both the eyes in contrast to left eye finding of group A.
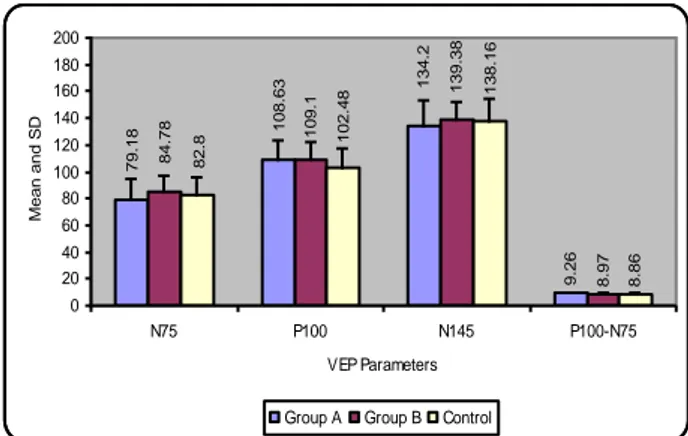
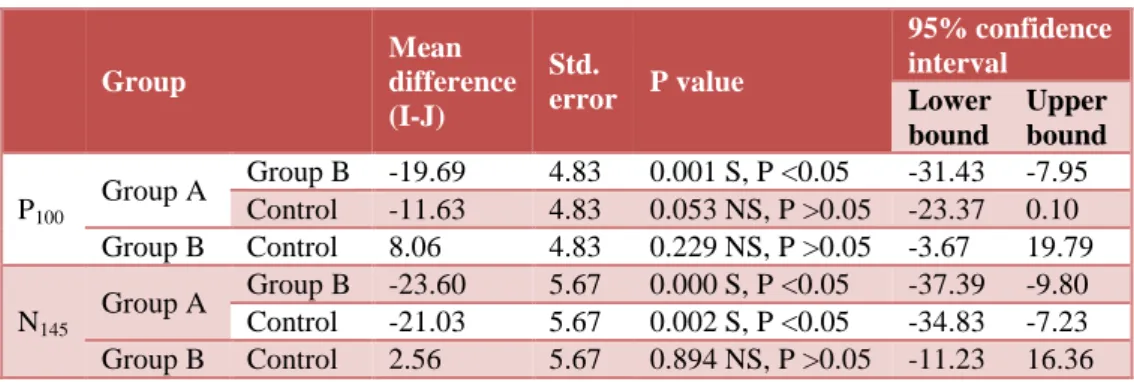
The multiple comparison using Tukey test between and within groups for left eye showed non-significant finding (Table 12), but for right eye a significant finding was observed in relation to P100 & N145 latencies (Table 14).
Table 12: Comparison of N75, P100, N145 and P100-N75 in
three groups: left eye (Multiple comparison: Tukey test) descriptive statistics.
N Mean ± SD Std.
error
N75
Group A 15 79.18 ± 14.87 3.84 Group B 15 84.78 ± 12.36 3.19 Control 15 82.80 ± 12.73 3.28
P100
Group A 15 108.63 ± 14.87 3.84 Group B 15 109.10 ± 12.87 3.32 Control 15 102.48 ± 15.25 3.93
N145
Group A 15 134.20 ± 19.17 4.95 Group B 15 139.38 ± 12.42 3.20 Control 15 138.16 ± 16.87 4.35
P100-N75
Group A 15 9.26 ± 0.81 0.20 Group B 15 8.97 ± 0.92 0.23 Control 15 8.86 ± 0.91 0.23
8 .9 8 9 .2 6 1 3 7 .1 6 1 0 3 .8 2 8 4 .2 4 1 3 4 .2 1 0 8 .6 3 7 9 .1 8 0 20 40 60 80 100 120 140 160 180 200
N75(ms) P100(ms) N145(ms) P100-N75 (μv) VEP Parameters M e a n a n d S D
Pre Test Post Test
9 9.3
7 1 4 5 .3 4 1 1 4 .8 6 8 3 .2 5 1 1 8 .7 8 9 2 .0 5 7 6 .9 0 20 40 60 80 100 120 140 160 180 200
N75(ms) P100(ms) N145(ms) P100-N75 (μv) VEP Parameters M e a n a n d S D
Pre Test Post Test
8 .8 2 8 .9 7 1 4 0 .5 8 1 1 0 .5 3 8 6 .6 1 3 9 .3 8 1 0 9 .1 8 4 .7 8 0 20 40 60 80 100 120 140 160 180 200
N75(ms) P100(ms) N145(ms) P100-N75 (μv) VEP Parameters M e a n a n d S D
Pre Test Post Test
8 .8 4 9 .0 4 8 1 .0 7 1 1 4 .8
8 144
.3
8
3
.3
8 11
1
.7
4 14
2 .3 8 0 20 40 60 80 100 120 140 160 180 200
N75(ms) P100(ms) N145(ms) P100-N75 (μv)
VEP Parameters M e a n a n d S D
Table 13: One way ANOVA.
Source of variation Sum of
squares df
Mean
square F P value
N75
Between groups 242.034 2 121.017
0.677 0.514 NS, P >0.05 Within groups 7506.517 42 178.727
Total 7748.551 44
P100
Between groups 408.677 2 204.339
0.989 0.380 NS, P >0.05 Within groups 8675.411 42 206.557
Total 9084.088 44
N145
Between groups 219.830 2 109.915
0.409 0.667 NS, P >0.05 Within groups 11293.083 42 268.883
Total 11512.912 44
P100-N75
Between groups 1.321 2 0.661
0.845 0.437 NS, P >0.05 Within groups 32.839 42 0.782
Total 34.160 44
Note: F-value is insignificant; Tukey multiple comparison test cannot be applied
Figure 12:Comparison of N75, P100, N145 and P100-N75
in three groups: left eye.
Table 14:Comparison of N75, P100, N145 and P100-N75 in
three groups: right eye (Multiple comparison: Tukey test) descriptive statistics.
N Mean ± SD Std.
error
N75
Group A 15 76.90 ± 11.11 2.86 Group B 15 83.38 ± 15.49 4.00 Control 15 82.92 ± 12.83 3.31
P100
Group A 15 92.05 ± 11.59 2.99 Group B 15 111.74 ± 13.26 3.42 Control 15 103.68 ± 14.66 3.78
N145
Group A 15 118.78 ± 15.93 4.11 Group B 15 142.38 ± 13.61 3.51 Control 15 139.81 ± 16.93 4.37
P100-N75
Group A 15 9.37 ± 0.70 0.18 Group B 15 9.04 ± 0.87 0.22 Control 15 8.92 ± 0.81 0.21
Table 15: One way ANOVA.
Source of variation Sum of
squares df
Mean
square F P value
N75
Between groups 393.04 2 196.52
1.11 0.337 NS, P >0.05 Within groups 7398.52 42 176.15
Total 7791.57 44
P100
Between groups 2940.62 2 1470.31
8.39 0.001 S, P <0.05 Within groups 7353.87 42 175.09
Total 10294.49 44
N145
Between groups 5029.74 2 2514.87
10.39 0.000 S, P <0.05 Within groups 10160.88 42 241.92
Total 15190.63 44
P100-N75
Between groups 1.65 2 0.82
1.28 0.287 NS, P >0.05 Within groups 27.00 42 0.64
Total 28.66 44
9
.2
6
8
.9
7
8
.8
6
7
9
.1
8 1
0
8
.6
3 13
4
.2
8
4
.7
8 109
.1
1
3
9
.3
8
8
2
.8 1
0
2
.4
8 13
8
.1
6
0 20 40 60 80 100 120 140 160 180 200
N75 P100 N145 P100-N75 VEP Parameters
M
e
a
n
a
n
d
S
D
Table 16: Multiple comparison: Tukey test.
Group
Mean difference (I-J)
Std.
error P value
95% confidence interval
Lower bound
Upper bound
P100
Group A Group B -19.69 4.83 0.001 S, P <0.05 -31.43 -7.95 Control -11.63 4.83 0.053 NS, P >0.05 -23.37 0.10 Group B Control 8.06 4.83 0.229 NS, P >0.05 -3.67 19.79
N145
Group A Group B -23.60 5.67 0.000 S, P <0.05 -37.39 -9.80 Control -21.03 5.67 0.002 S, P <0.05 -34.83 -7.23 Group B Control 2.56 5.67 0.894 NS, P >0.05 -11.23 16.36
Figure 13:Comparison of N75, P100, N145 and P100-N75
in three groups: right eye.
DISCUSSION
This study was conducted in the interictal period. The most striking finding was-
A decrease in P100 (ms) at post-test in both the eyes in Group B though this finding is not significant. In contrast in Group A there was a significant increase in P100 (ms) at post-test.
Both the groups showed an increase in P100-N75 (µv) & this finding was not significant in both.
Multiple comparisons using Tukey test and one way ANOVA showed significant finding between groups and within Groups for P100 and N145 latencies for the right eye. No such difference was seen with left eye.
Abnormalities of visual evoked potentials were first reported by Kennard et al using pattern reversal method in migraine patients.7 He found that the latency of P100 was greater and its amplitude was larger in migraine patients. Our prolonged latency findings at pre-test is in line with findings of other workers.7-10 Kennard et al. suggested that repeated attacks cause ischemic damage
and bright lights. In fact, in many cases, noises and bright light have precipitated migraine attacks.11,12 If we test these patients neurophysiologically we would get decreased latencies but what we found was increased latencies, which might be due to synaptic delays.13 Also, it may suggest that cortex is hypoexcitable in between attacks.14 Rajyoga meditation causes shifting of autonomic balance in favour of parasympathetic instead of sympathetic.15 This explains the decrease in the latencies at post-test. There are no specific researches available explaining the effects of Rajyoga meditation on VEP in migraine patients but the above mentioned reason explains its overall beneficial effect on the body.
Studies of the cortical VEP have shown contradictory results. Review by Schoenen1992 showed inability of researchers to demonstrate differences between migrainers and control group.16 Increase in P100 (µv) was seen by Diener et al 1984 & Khalil 1991 for subjects having migraine less than 10 years.17,18 Skuse & Burke 199219 have found that prolonged checker board stimulation causes a progressive decrease in P100-N75 (µv) in the absence of drowsiness , when examined by reaction time task. This is due to habituation. Thus, habituation of VEP is a physiological phenomenon in the visual cortex, which is absent in migraine patients in between attacks, and thus a large amplitude is obtained. . This finding is in line with our study at pre-test. Similar finding was also seen at post-test which indicates that recovery of cortical damage is not complete with these interventions.
The habituation activity of cortex depends on certain neurotransmitters like serotonin, dopamine, histamine, noradrenaline and acetylcholine.21 These transmitters have diffuse innervations of the sensory cortices mainly the layer IV pyramidal cells and interneurons. The serotoninergic neurons in the raphe nuclei play a main modulatory role in cortical information processing.22 A review by Ferrari 1992,23 in his topic on migraine pathogenesis reports the role of serotonin in causing low interictal activity in the raphe-cortical-serotoninergic pathway which could be responsible for a low preactivation level of sensory cortices which could cause
9
.3
7
9
.0
4
7
6
.9 9
2
.0
5 11
8
.7
8
8
3
.3
8 11
1
.7
4 14
2
.3
8
1
0 20 40 60 80 100 120 140 160 180 200
N75 P100 N145 P100-N75 VEP Parameters
M
e
a
n
a
n
d
S
D
“ceiling” effect.24 Thus this deficient habituation again might be the cause of larger amplitudes in migraine patients. Our finding of increased amplitude even after intervention might also point to the role of abnormal genes as found in a study by Ophoff et al. 1996. His hypothesis is that the major functional outcome in the brain activity can be changed by neurotransmitter system which also includes the subcortical-cortical-serotoninergic pathway since the identified genes codes, for the ionophore of a P/Q calcium channel that regulates transmitter release, which is responsible for lack of habituation.25 Another cause for this increase in the amplitude could be an excessive increase in cortical lactate levels which may induce a metabolical instability like lactate accumulation triggering a spreading depression.26 Recent study by Watanabe et al. 1996 showed increased lactate levels in the occipital cortex in migraine patients.
Significant interocular latency difference as regards to P100 and N145 was seen in right eye as compared to left eye. No specific data is available to explain such difference. However, Ipata et al. assessed the interhemispheric visual transfer of information in humans. They found that more anterior locations of electrode sites yielded shorter values and overall transfer time which tended to be shorter for N75 component than for P100 component.27,28
A further study can be taken up on a larger group of subjects comparing duration of migraine and latency, repetitive attacks and amount of ischemic damage, physiological and biochemical parameters, location of electrode site and migraine attacks and interhemispheric transfer of visual information as compared to right and left eye.
CONCLUSION
Thus, we can conclude that Rajyoga meditation along with deep breathing can be used as adjuncts to routine antimigraine therapy. We advocate the continuous practice of these interventions which might decrease the frequency of attacks and finally the elimination of this problem.
ACKNOWLEDGEMENTS
The authors wish to acknowledge the help rendered by the staff of Neurophysiology section of physiology department at Jawaharlal Nehru Medical College, Wardha, the subjects and the staff of ophthalmology and medicine departments of AVBR Hospital, Wardha.
Funding: No funding sources Conflict of interest: None declared
Ethical approval: The study was approved by the institutional ethics committee
REFERENCES
1. Samhita Panda, Manjari Tripathi. Clinical profile of migraineurs in a referral centre in India. J Assoc Physicians India. 2005 Feb;53:111-5.
2. Gianluca Coppola, Antonio Curra, Simona Liliana Sava, Alessia Alibardi Vincenzo Parisi, Francesco Pierelli et al. Changes in visual-evoked potential habituation induced by hyperventilation in migraine. J Headache Pain. 2010;11:497-503.
3. Stewart WF, Lipton RB, Celentano DD, Reed ML. Prevalence of migraine in the United States. Relation to age, income, race and other socio-demographic factors. J Am Med Assoc. 1992;267:64-9.
4. Headache Classification Committee of the International Headache Society. Classification and diagnostic criteria for headache disorders, cranial neuralgias and facial pain. Cephalalgia. 1988;8(Suppl 7):1-96.
5. Ottman R, Hong S, Lipton RB. Validity of family history data on severe headache and migraine. Neurol. 1993;43:1954-60.
6. Migraine prevention: techniques are available, but underutilized. New guidelines emphasize ways to reduce the number of migraine attacks. Duke Med Health News. 2012 Jul;18(7):6-7.
7. KennardC, Gawel M, Rudolph Nde M, Rose FC. Visual evoked potentials in migraine subjects. Res Clin Stud Headache. 1987;6;73-80.
8. Winter A. Electrophysiological studies of the visual system of people with classical migraine. In: Winter A, eds. Ph.D. thesis. Surrey, UK: University of Surrey, 1985.
9. Polich J, Ehlers CL, Dalassio DJ. Pattern shift visual evoked responses and EEG in migraine. Headache. 1986;26(9):451-6.
10. MarianiE, MoschiniV, Pastorino GC et al. Pattern reversal visual evoked potential (VEP-PR) in migraine subjects with visual aura. Headache. 1990;30(7):435-8.
11. Wilkins A, Nimmo-Smith I, Tait A, McManus C, Della Sala S, Tilley A et al. A neurological basis for visual discomfort. Brain. 1984;107:989-1017. 12. Marcus DA, Soso MJ. Migraine and stripe induced
visual discomfort. Arch Neurol. 1989;46:1129-32. 13. Headache Classification Committee of the
International Headache Society. Classification and diagnostic criteria for headache disorder, cranial neuralgias and facial pain. Cephalalgia. 1988;8(Suppl 7):1-96.
14. Afra J, Proietti Cecchini A, De Pasqua V, Albert A, Schoenen J. Visual evoked potentials during long periods of pattern reversal stimulation in migraine. Brain. 1998;121:233-41.
16. Schoenen J. Abnormal cortical information processing between migraine attacks. In: Sandler M, Ferrari M, Harnett S, eds. Migraine: Pharmacology and Genetics. 1st ed. London: Altman; 1996: 233-253.
17. Diener HC, Ndosi NK, Koletzki E, Langohr HD. Visual evoked potentials in migraine. In: Pfaffenrath V, Lundberg PJ, Sjaastad O, eds. Updating in Headache. 2nd ed. Berlin: Springer-Verlag; 1984: 439-465.
18. Khalil NM. Investigations of visual function in migraine using visual evoked potentials and visual psychological tests. In: Khalil NM, eds. PhD thesis. London: University of London; 1991.
19. Skuse NF, Burke D. Sequence dependent deterioration in the visual evoked potential in the absence of drowsiness. Electroencephalogr Clin neurophysiol. 1992;84:20-5.
20. Judit Afra, Alberto Proietti Cecchini, Victor De Pasqua, Adelin Alberta, Jean Schoenen. Visual evoked potentials during long periods of pattern - reversal stimulation in migraine. Brain. 1998;121:233-41.
21. Mesulam MM. Large-scale neurocognitive networks and distributed processing for attention, language and memory. Ann Neurol. 1990;28:597- 613.
22. Jacobs BL, Azmitia EC. Structure and function of the brain serotonin system. Physiol Rev. 1992;72:165-229.
23. Ferrari MD. Biochemistry of migraine. Pathol Biol (Paris). 1992;40:284-92.
24. Knott JR, Irwin DA. Anxiety, stress, and the contingent negative variation. Arch Gen Psychiatr. 1973; 29:538-41.
25. Ophoff RA, Terwindt GM, Vergouwe MN, Eijk R van, Oefner PJ, Hoffman SM et al. Familial hemiplegic migraine and episodic ataxia type 2 are caused by mutations in the Ca2+ channel gene Cacnlia4. Cell. 1996;87:543-52.
26. Lauritzen M. Pathophysiology of the migraine aura. The spreading depression theory. Brain. 1994;117:199-210.
27. Ipata A, Girelli M, Miniussi C, et al. Interhemispheric transfer of visual information in humans: the role of different callosal channels. Arch Ital Biol. 1997 Mar;135(2):169-82.
28. Andrew B. Evans, Selim R. Benbadis et al. Clinical utility of evoked potentials, 2014. Available at http://emedicine.medscape.com/article/1137451-overview. Accessed 18 March 2014.
DOI: 10.5455/2349-3933.ijam20140506
Cite this article as: Biswas DA, Gaikwad MA.A