[Mehta* 4(12): December, 2017] ISSN 2349-4506
Impact Factor: 2.785
G
lobal
J
ournal of
E
ngineering
S
cience and
R
esearch
M
anagement
COMPARISON AND EVALUATION OF CLUSTER BASED IMAGE
SEGMENTATION TECHNIQUES
Hetangi D. Mehta*, Daxa Vekariya, Pratixa Badelia
*Student of M.E.(C.E.), Noble Group of Institutions, Junagadh, Gujarat, India
Assistant Professor, Dept. of Computer Science, Noble Group of Institutions, Junagadh, Gujarat, India Assistant Professor, Dept. of Computer Science, Noble Group of Institutions, Junagadh, Gujarat, India
DOI: 10.5281/zenodo.1098696
KEYWORDS
:
Clustering, k-means, enhanced k-means and fuzzy c-mean algorithms, algorithm, Subtractive clustering, GAKM.ABSTRACT
Image segmentation is the classification of an image into different groups. Numerous algorithms using different approaches have been proposed for image segmentation. A major challenge in segmentation evaluation comes from the fundamental conflict between generality and objectivity. A review is done on different types of clustering methods used for image segmentation. Also a methodology is proposed to classify and quantify different clustering algorithms based on their consistency in different applications. There are different methods and one of the most popular methods is k-means clustering algorithm. K-means clustering algorithm is an unsupervised algorithm and it is used to segment the interest area from the background. Enhanced k-means clustering is used to improve accuracy and efficiency of k means clustering algorithm. The number of clusters is changed for fuzzy c-mean algorithm. Subtractive cluster is used to generate the initial centers and these centers are used in k-means algorithm for the segmentation of image. Genetic algorithm is used for centroids in the given value K clusters (GAKM). GAKM is good for complex problems it retains best features. An outcome revealed that the accuracy and performance of GAKM is better than simple K-means and other clustering algorithms.
INTRODUCTION
Partitioning of an image into several constituent components is called image segmentation. Segmentation is an important part of practically and automated image recognition systems [1,2]. Image segmentation is one of the mostly used methods to classify the pixels of an image correctly in a decision oriented application. It divides an image into a number of discrete regions such that the pixels have high similarity in each region and high contrast between regions [3]. It is a valuable tool in many field including health care, image processing, traffic image, pattern recognition etc. There are different techniques for image segmentation like threshold based, edge based, cluster based, neural network based [4]. From the different technique one of the most efficient methods is the clustering method.
Clustering is one of the key techniques in the KDD (Knowledge Discovery in Databases) process. It is usually applied aiming at uncovering hidden structures underlying a collection of objects. Clustering is the process of dividing the data into groups of similar objects according to a similarity measure. In the last decades, several clustering algorithms have been developed for a large spectrum of applications [5].
There are different types of clustering: K-means clustering, Fuzzy C-means clustering, mountain clustering method and subtractive clustering method. One of most used clustering algorithm is k-means clustering. It is simple and computationally faster than the hierarchical clustering. It can also work for large number of variable [3]. The k-means algorithm is the most popular due to its simplicity and efficiency. However, the k-medoids based algorithms have been shown to be more robust since they are less sensitive to the existence of outliers [5], do not present limitations on attribute types and also, because the clustering found does not depend on the input order of the dataset.
[Mehta* 4(12): December, 2017] ISSN 2349-4506
Impact Factor: 2.785
G
lobal
J
ournal of
E
ngineering
S
cience and
R
esearch
M
anagement
images. In such techniques, image is separated into a set of disjoint regions with each region associated with one of the finite number of classes that are characterized by distinct parameters [6].
A potential problem for a measure of consistency between different segmentations available is that there is no unique segmentation of an image. A major challenge in segmentation evaluation comes from the fundamental conflict between generality and objectivity [2].
RELATED WORK
Several works were done in the area of image segmentation by using different methods. Many are done based on different application of image segmentation. K-means algorithm is the one of the simplest clustering algorithm and there are many methods implemented so far with different method to initialize the centre. Many researchers are also trying to produce new methods which are more efficient than the existing methods, and shows better segmented result.
Wang Shunye [7] motivated by the problem of random selection of initial centroid and similarity measures, the researcher presented a new K-means clustering algorithm based on dissimilarity. This improved k-means clustering algorithm basically consists of three steps. The first step discussed is the construction of the dissimilarity matrix i.e dm. Secondly, Huffman tree based on the Huffman algorithm is created according to dissimilarity matrix. The output of Huffman tree gives the initial centroid. Lastly the k-means algorithm is applies to initial centroids to get k cluster as output. Iris, Wine and Balance Scale datasets are selected from UIC machine learning repository to test the proposed algorithm. Compared to traditional k-means, the proposed algorithm gives better accuracy rates and results.
Navjot Kaur et al. [8] enhanced the traditional k-means by introducing Ranking method. Author introduces Ranking Method to overcome the deficiency of more execution time taken by traditional k-means. The Ranking Method is a way to find the occurrence of similar data and to improve search effectiveness. The tool used to implement the improved algorithm is Visual Studio 2008 using C#.
Pallavi Purohit and Ritesh Joshi [9] proposed an improved approach for original K-means clustering algorithm due to its certain limitations. The main reason for poor performance of K-means algorithm is selection of initial centroids randomly. The proposed algorithm deals with this problem and improves the performance and cluster quality of original k-means algorithm. The new algorithm selects the initial centroid in a systematic manner rather than randomly selecting. It first find out the closest data points by calculating Euclidian distance between each data point and then these points are deleted from population and forms a new set. This step is repeated on new set by finding data points that are closest to each other. Performance comparison is done using MATLAB tool. The proposed algorithm gives more accurate results and also decreases the mean square distance. But the proposed algorithm works better for dense dataset rather than sparse.
Wang and Su [10] discussed an improved k-means clustering algorithm to deal with the problem of oulier detection of existing k-means algorithm. The proposed algorithm uses noise data filter to deal with this problem. Density based outlier detection method is applied on the data to be clustered so as to remove the outliers. The motive of this method is that the outliers may not be engaged in computation of initial cluster centres. In the next step fast global k-means algorithm proposed by Aristidis Likas is applied to the output generated previously. The results between k-means and improved k-means are compared using Iris, Wine, Abolone datasets. The factors used to test are clustering accuracy and clustering time. The disadvantage of the improved k-means is that while dealing with large data sets, it will cost more time.
[Mehta* 4(12): December, 2017] ISSN 2349-4506
Impact Factor: 2.785
G
lobal
J
ournal of
E
ngineering
S
cience and
R
esearch
M
anagement
Nazeer and Sebastian [12] proposed an enhanced algorithm to improve the accuracy and efficiency of the k-means clustering algorithm. They present an enhanced k-means algorithm which combines a systematic method consisting two approaches. First one is finding the initial centroid and another is assigning the data point to the clusters. They have taken different initial centroid and tested execution time and accuracy. From the result it can be conclude that the proposed algorithm reduced the time complexity without sacrificing the accuracy of clusters. Nameirakpam et al. [3] compared image segmentation using K-means clustering algorithm and subtractive clustering algorithm. Subtractive clustering method is data clustering method where it generates the centroid based on the potential value of the data points. So subtractive cluster is used to generate the initial centers and these centers are used in k-means algorithm for the segmentation of image. Then finally medial filter is applied to the segmented image to remove any unwanted region from the image. The comparison for RMSE and PSNR are done for proposed method and classical K-means algorithm and it is found that the proposed method have better performance result.
Yogita Chauhan et al. [13] done survey of K-means and GAKM – Hybrid clustering algorithm. First they cluster the data using K-Means clustering algorithm with the value of K number of clusters then calculate the centroid of K cluster obtain from the previous step. After this step, they apply genetic algorithm for centroids for the given value K clusters (GAKM). After applying the GAKM, they compared the result of simple K-Means and GAKM algorithm. The experimental results showed that the cluster obtained from GAKM provides more optimal result in comparison of simple K-Means algorithm cluster result.
CLUSTER BASED IMAGE SEGMENTATION
Partitioning an image into several disjoint segments is what is termed as image segmentation. It simplifies and changes the representation of an image, image is transferred into something more meaningful and easier to analyze. Typically it is used to locate objects of interest and boundaries like lines, curves in an image [1]. Segmentation algorithms are based on two basic properties of an image intensity value: discontinuity and similarity. To study discontinuities in an image, divide image based on the abrupt changes in intensity such as edges. Mathematically the regions obtain after partitioning an image into regions is considered to be homogeneous with respect to some image property of interest. Image property can be intensity, color, or texture. If 𝐼={𝑥𝑖𝑗, 𝑖=1…
𝑁𝑟, 𝑗=1 …𝑁𝑐} is the input image with 𝑁𝑟 rows and 𝑁𝑐 columns and measurement value 𝑥𝑖𝑗 at pixel (𝑖,𝑗), then the segmentation can be expressed as 𝑙={𝑆1,….,𝑆𝑘} with the 𝑙𝑡ℎ segment 𝑆𝑙={i𝑙1, 𝑗𝑙1 ,…, 𝑖𝑙𝑁1, 𝑗𝑙𝑁1} consisting of
a connected subset of the pixel coordinates. No two segments share any pixel locations and the union of all the segments covers the entire image. Segmentation can be achieved in a more efficient manner through clustering. Clustering is an interesting approach for finding similarities in data and putting similar data into groups. Cluster partitions data set into several groups such that the similarity within a group is larger than that among the groups. Clustering algorithms are used extensively not only to organize and categorize data, but are also useful for data compression [14]. The applicability of clustering methodology to the image segmentation problem was recognized over three decades ago, and the paradigms underlying the initial pioneering efforts are still in use today. It defines feature vectors at every image location called as pixel component of both functions of image intensity and functions of pixel location itself.
The key issues in the design of any clustering – based segmenter are the choice of pixel measurements (features) and dimensionality of the feature vector, a measure of similarity which is appropriate for the selected features and the application domain, the identification of the clustering algorithm, the development of strategies for feature and data reduction, and the identification of necessary pre- and post-processing techniques.
[Mehta* 4(12): December, 2017] ISSN 2349-4506
Impact Factor: 2.785
G
lobal
J
ournal of
E
ngineering
S
cience and
R
esearch
M
anagement
PROPOSED SYSTEM
In this section to study the relative performance of cluster based image segmentation methods the following methodology is proposed.
A Test image database construction
At the first stage in testing the consistency we collect around 100 different real natural images from internet, different repositories and some well known image databases such as corel. A particular requirement is that each image should have different area of interest to be analyzed. This database consists of images from different fields and each image is totally different from other. Fields chosen can be agriculture, medical, remote sensing, architectural, industrial images etc. To make this benchmark for testing consistency suitable for evaluating large variety of cluster based image segmentation algorithms, color information is removed and all the images will be unified to 256-bit gray scale image in JPEG format.
IV.B Selected cluster based image segmentation methods We will evaluate the following cluster based image segmentation methods.
1) K means
2) Enhanced k-means
3) Fuzzy c means
4) Subtractive clustering
5) Genetic Algorithm-k-means (GAKM)
K-MEANS ALGORITHM
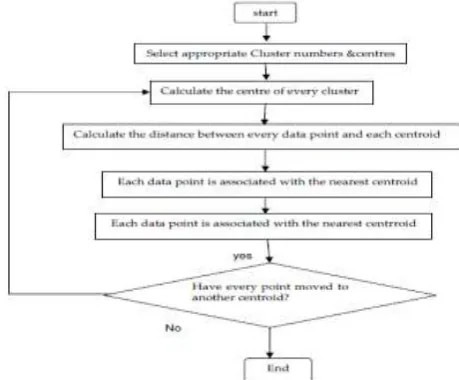
Partitioning based method creates K partitions, called clusters (group of similar data objects) from the given set of n data objects. Initially some data objects are assigning to some of the partitions. An alternative relocation technique is used to improve the partitioning by moving objects from one cluster to another cluster. The data objects in the one cluster are similar to each other or we can say them homogeneous data objects, but these data objects are different from the another cluster data objects. The each partition is represented by either a centroid or a medoid, A centroid is the average of the all data objects in a partition, while a medoid is the most representative point of a cluster. The fundamental requirements of the partitioning based methods are each cluster must contained at least one data object, and each data object must belong to exactly one cluster. In this category of clustering the k-means is the simplest and easy method to cluster the data. The similarity measurement for this method is carried out by distance measurement. It is most common to calculate the dissimilarity between two patterns using a distance measure define on the feature space. The most popular metric for distance measurement is Euclidean distance. A flow chart for K-means algorithm is given below:
[Mehta* 4(12): December, 2017] ISSN 2349-4506
Impact Factor: 2.785
G
lobal
J
ournal of
E
ngineering
S
cience and
R
esearch
M
anagement
K-means Clustering Algorithm• Let us consider an image with resolution of x × y and the image has to be cluster into k number of cluster. Let p(x, y) be an input pixels to be cluster and ck be the cluster centers. The algorithm for k-means clustering is following as:
1. Initialize number of cluster k and centre.
2. For each pixel of an image, calculate the Euclidean distance d, between the center and each pixel of an image
using the relation given below.
d = || p(x, y) − ck || …. (1)
3. Assign all the pixels to the nearest centre based on distance d.
4. After all pixels have been assigned, recalculate new position of the centre using the relation given below
Ck = (1/k) ∑ ∑ p(x, y) ……. (2)
y∈ck x∈ck
5. Repeat the process until it satisfies the tolerance or error value. 6. Reshape the cluster pixels into image.
The advantage of K-means algorithm is that it is very efficient and it can be apply for high dimensional data. Some drawbacks are also there for K-means like it is only used when data objects are numeric value or we can say that K-means only applicable for the numeric data. The number of clusters (the k value) is to be define by user. One of the most important drawback is if outlier and noise point are available than the mean values are changes, k-means is very sensitive for noise or outlier point because it is going to effect the mean point of the cluster.
ENHANCED K-MEANS ALGORITHM
An enhanced k-means clustering algorithm is used to improve the accuracy and the efficiency of the k-means clustering algorithm. However, the initial centroids are selected randomly. Hence, this method is very sensitive to the initial starting points and it does not promise to produce the unique clustering results. In this algorithm two methods are used, one method for finding the better initial centroids and the other method for an efficient way for assigning data points to appropriate clusters. A new approach for finding the better initial centroids with reduced time complexity was also proposed [11]. The pseudocode for the enhanced k-means clustering algorithm is outlined as Algorithm 2. In the algorithm-2 first they are checking, the given data set contain the negative value attributes or not. If the data set contains the negative value attributes then these are transforming the all data points in the data set to the positive space by subtracting the each data point attribute with the minimum attribute value in the given data set. Here, the transformation is required, because in the proposed enhanced algorithm we calculate the distance from origin to each data point in the data set. We will get the same Euclidean distance from the origin. This will result in incorrect selection of the initial centroids. To overcome this problem all the data points are transformed to the positive space. If data set contains the all positive value attributes then the transformation is not required.
Enhanced k-means Algorithm:
Require: D = {d1, d2, d3,..., di,..., dn } // Set of n data points.
di = { x1, x2, x3,..., xi,..., xm } // Set of attributes of one data point.
k // Number of desired clusters.
Ensure: A set of k clusters. Steps:
1. In the given data set D, if the data points contains the both positive and negative attribute values then go to step 2, otherwise go to step 4.
2. Find the minimum attribute value in the given data set D.
3. For each data point attribute, subtract with the minimum attribute value. 4. For each data point calculate the distance from origin.
5. Sort the distances obtained in step 4. Sort the data points accordance with the distances. 6. Partition the sorted data points into k equal sets.
7. In each set, take the middle point as the initial centroid.
[Mehta* 4(12): December, 2017] ISSN 2349-4506
Impact Factor: 2.785
G
lobal
J
ournal of
E
ngineering
S
cience and
R
esearch
M
anagement
9. Repeat
10. For each data point di, find the closest centroid cj and assign di to cluster j. 11. Set Cluster Id [i] = j. // j:Id of the closest cluster.
12. Set Nearest Dist[i] = d(di, cj).
13. For each cluster j (1 <= j <= k), recalculate the centroids.
14. For each data point di,
14.1 Compute its distance from the centroid of the present nearest cluster.
14.2 If this distance is less than or equal to the present nearest distance, the data point stays in the same cluster.
14.2.1 For every centroid cj (1<=j<=k) compute the distance d(di, cj).
• End for;
• Until the convergence criteria is met.
FUZZY C--MEANS ALGORITHM
Fuzzy clustering is really a powerful unsupervised method for the analysis of data and construction of models. Fuzzy clustering is more and more natural than other hard clustering. Objects on the boundaries between multiple classes are not forced to totally relations to classes, but rather are to be assigned membership degrees between zero and one indicating their partial membership. Fuzzy c-means algorithm is widely used. Fuzzy c-means clustering reported in the literature for a unique case (m=2) by Joe Dunn in 1974. The basic case developed by Jim Bezdek in his PhD thesis at Cornell University in 1973. It can be improved by Bezdek in 1981. The FCM indicates fuzzy partitioning like that a data point can be a part of all groups with various membership grades between zero and one.
Fuzzy C-means (FCM) is an ultimate method of clustering that permits one part of data to belong to more than two clusters. It is frequently used in pattern recognition method. It depends on minimization of the following objective function:
N C
Jm = ∑ ∑uij ||xi - cj||2……. (3)
i=1 j=1
where m is any real number greater than 1, uij is the degree of membership of xi in the cluster j, xi is the ith of
d-dimensional measured data, cj is the d-dimension center of the cluster, and ||*|| is any norm expressing the similarity between any measured data and the center.
SUBTRACTIVE CLUSTERING ALGORITHM
Subtractive clustering is a method of extension of Mountain method to find the optimal data point to define a cluster centroid based on the density of surrounding data points. Mountain method is very simple and effective. It estimates the number and initial location of the cluster centers. It distribute the data space into gridding point and compute the potential for each data point base on its distance to the actual data point. So the grid point with many data point nearby will have high potential value. And so this grid point with highest potential value will be choose as first cluster centre. So after selecting the first cluster centre we will try to find the second cluster centre by calculating the highest potential value in the remaining grid points. As grid points near the first cluster center will reduce its potential value, the next cluster center will be grid with many data point nearby other than first cluster center grid point. So this procedure of acquiring new cluster center and reducing the potential of surrounding grid point repeat until potential of all grid points falls below a threshold value. So this method is one of the simplest and effective methods to find the cluster centers. But with increase in the dimension of data, its computation complexity grows exponentially. So, subtractive clustering algorithm solves the computational method associated with mountain method. It uses data points as the candidates for cluster centre and the computation of this method is proportional to the problem size.
Consider a collection of n data points: X = {x1, x2, x3. . . xn}. Then each point is considered as a potential cluster
[Mehta* 4(12): December, 2017] ISSN 2349-4506
Impact Factor: 2.785
G
lobal
J
ournal of
E
ngineering
S
cience and
R
esearch
M
anagement
nPn = ∑ eW …….. (4)
i=1 where W=(−4xn−xi2)/r
a2 ra is hyper sphere cluster radius in data space and it is a positive constant which is used
to define the neighbourhood. The symbol || . || denotes the Euclidean distance. So the measure of the potential for the data point is a measure of function of distance to all other data points. After finding the potential of each data points, select the data point with maximum potential as the first cluster centre. Let us consider x1 and p1 as first
cluster centre and its corresponding potential respectively. Then revise the potential of each data point by using the formula given below.
Pn = Pn − P1ez …….. (5)
where Z =(−4xn−xi2)/r
b2rb is the hyper sphere penalty radius in data space and it is a positive constant. Here an
amount of potential is subtracted from each data point as a function of distance from the first cluster center. So the data points near the first cluster center will have greatly reduced potential, and therefore it have less chance to select as next cluster center. After calculating the revise potential of each data points, find the next highest potential as the next cluster center. So these processes continue until a sufficient number of cluster centre are obtained.
GENETICALGORITHM – K-MEANS
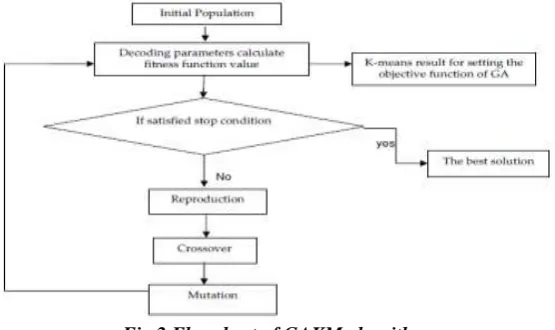
Jenn-Long Liu et al. [15] proposed GAKM a hybrid method that combines a genetic algorithm (GA) and K-means algorithm. The function of GAKM is to determine the optimal weights of the attributes and cluster centres of clusters that are needed to classify the dataset. Genetic algorithm is a stochastic search algorithm which is based on the Darwinian principal of natural selection and natural genetics. The selection is biased toward more highly fit individuals, so the average fitness of the population to improve from one generation to the next. In general GA generates an optimal solution by means of using reproduction, crossover, and mutation operators [16, 17]. The genetic algorithm initially starts with population generated, population is the collection of chromosomes, chromosome is the collection of genes, the fitness for the population is calculated by using a suitable fitness function accordingly. In GAKM the result of K-means algorithm is used for setting the objective function of GA. If fitness value is satisfied, the best solution is obtained. Otherwise the GA parameters (reproduction, crossover, mutation) are apply for obtain a optimal no. of cluster. The flowchart for GAKM is as fo llows:
Fig 2 Flowchart of GAKM algorithm
[Mehta* 4(12): December, 2017] ISSN 2349-4506
Impact Factor: 2.785
G
lobal
J
ournal of
E
ngineering
S
cience and
R
esearch
M
anagement
Algorithm for GAKM is give below [18]:Input:
Mutation probability, Pm; Population Size, N;
Maximum number if generations, MAX-GEN;
Output:
Solution string, s*;
{ Initialize the population, P; geno = MAX-GEN;
s* = P1; (Pi is the length in P) While (geno> 0)
s* = P1; (Pi is the ith string in Pi) P = Selection (P);
for i = 1 to N, Pi = Mutation (Pi); for I = 1 to N, K-means (Pi);
S = string in P such that the corresponding weight matrix Ws has the minimum SE measures; If (S(Ws)) > S(Ws)), s* = S;
Geno = geno-1; }
Output s*; }
The steps involve in GAKM are coding, initialization, selection, mutation. The coding is string-of group-numbers encoding [19]. The initial population P(0) is selected randomly. For the selection the roulette wheel strategy is used for random selection. The use of one step K-Means in GAKM instead of the crossover operator used in conventional GA. In the GAKM biased mutation operator is define specific to clustering called distance based mutation. Thus GAKM combines the simple-k-Means and GA.
We chose these methods based on the following considerations:
1) All the above methods are relatively new methods for image segmentation. 2) They represent the different categories of segmented images well.
IV.C. Performance Measure The quality of the segmented image is analyzed using the measurement value of Root Mean Square Error (RMSE), Peak to Signal Noise Ration (PSNR), and Compression Ratio (CR).
1. Root Mean Square Error: It has been used as a standard performance measurement of the output image. It gives how much output image is deviated from the input image.
2. Peak to Signal Noise Ratio: The peak to signal noise ratio is the proportion between maximum attainable powers and the corrupting noise that influence likeness of image. It is used to measure the quality o f the output image.
[Mehta* 4(12): December, 2017] ISSN 2349-4506
Impact Factor: 2.785
G
lobal
J
ournal of
E
ngineering
S
cience and
R
esearch
M
anagement
low and the value of PSNR is getting above 30 and when both methods are compared it is found that the proposed method has better result. Therefore it is concluded that the output image resulted from the proposed algorithm are of good quality.
Compression Ratio (CR)
The method to calculate is CR = n1/n2
where n1 and n2 denote the number of information carrying bits in the original and encoded images.
CONCLUSIONS
In this work a comparison study has been performed among five clustering algorithms viz., K-Means partitioning algorithm, enhanced K-Means algorithm, Fuzzy c-Means Algorithm, Subtractive Clustering Algorithm and Genetic Algorithm-k-mean (GAKM) according to their capabilities to model a set of non-linear systems and experimental data. A concise literature review is provided. The basic parameters that control each algorithm are presented as well. K-means clustering is an important topic of research now-a-days in data mining. However k-means is still at the stage of exploration and development. The survey concludes that many improvements are basically required on k-means to improve problem of cluster initialization, cluster quality and efficiency of algorithm. The number of clusters is changed for the fuzzy c-mean algorithm. As for subtractive clustering, the radii parameter is changed to obtain different number of clusters. Generally, increasing the number of generated cluster yields an improvement in the validity index value. The models generated from subtractive clustering usually are more accurate than those generated using FCM algorithm. Subtractive algorithm produces consistent results. GAKM- an hybrid algorithm which is the combination of simple Means and Genetic Algorithm. K-means is combine with GA to get the optimize no. of clusters from the result of simple K-Means algorithm. All algorithm are simple to understand and can be applicable for various type of data like genomic data set, numerical data set. Its review from study that K-means applicable only when mean of cluster is defined; it is not applicable on categorical data. But it is easy to understand and implement. GAKM is good for complex problems it retains best features. It is an outcome that the accuracy and performance of GAKM is better than simple K-means.
REFERENCES
[1] Sowmya B.and Sheelarani, B.(2009). Colour image segmentation using soft computing techniques. International Journal of Soft Computing Applications, Issue-4,pp.69-80
[2] Kaur Jaskirat, Agrawal Sunil and Vig Renu (2012). A Methodology for the performance analysis of clustering based image Segmentation. International Journal of Engineering Research and Applications (IJERA), 2(2): 664-667.
[3] Nameirakpam Dhanachandra, Manglem Khumanthem and Chanu Yambem Jina (2015). Image segmentation using k-means clustering algorithm and subtractive clustering algorithm. Eleventh International Multi-Conference on Information Processing-2015 Procedia Computer Science 54:764 – 771.
[4] Khaled Hammouda (2011). A Comparative study of Data Clustering technique. Department of System Design Engineering, University of Waterloo, Canada.
[5] Maria Camila N. Barioni, Razente humberto L., Traina Agma J.M. and Caetano Traina Jr. (2000). An efficient approach to scale up k-medoid based algorithms in large databases”. XXI Simpósio Brasileiro de Banco de Dados.
[6] R.Harikumar, B. Vinoth Kumar and, G.Karthick and I.N. Sneddon (2012). Performance analysis for quality measures using k means clustering and EM models in segmentation of medical images. International Journal of Soft computing and Engineering, 1(6):74-80.
[7] Wang Shunye (2013). An improved k-means clustering algorithm based on dissimilarity. International Conference on Mechatronic Sciences, Electric Engineering and Computer (MEC) during Dec 20-22, 2013, Shenyang, China IEEE
[8] Navjot Kaur, Jaspreet Kaur Sahiwal, Navneet Kaur (2012). Efficient k-means clustering algorithm using ranking method in data mining. International Journal of Advanced Research in Computer Engineering & Technology. 1(3):56-61.
[Mehta* 4(12): December, 2017] ISSN 2349-4506
Impact Factor: 2.785
G
lobal
J
ournal of
E
ngineering
S
cience and
R
esearch
M
anagement
[10]Juntao Wang and Xiaolong Su (2011). An improved k-means clustering algorithm. IEEE
[11]Madhu Yedla, Srinivasa Rao Pathakota and T. M. Srinivasa (2010). Enhanced k-means clustering algorithm with improved initial center. International Journal of Science and Information Technologies, 1(2):121–125.
[12]K. A. Abdul Nazeer and M. P. Sebastian (2001). Improving the accuracy and efficiency of the k-means clustering algorithm, In Proceedings of the World Congress on Engineering, London, WCE, Vol. 1:75-80.
[13]Yogita Chauhan, Vaibhav Chaurasia and Chetan Agarwal (2014). A survey of k-means and GAKM- the hybrid clustering algorithm. International Journal of Scientific & Technology Research.3(6):119-122. [14]A.K. Jain, M.N. Murty and, P.J. Flynn. (1999). Data Clustering : A Review. ACM computing Surveys.
.31(3):144-147.
[15]Jenn-Long Liu, Yu-Tzu Hsu, Chih-Lung Hung (2012). Development of evolutionary data mining algorithms and their applications to Cardiac disease diagnosis. WCCI 2012 IEEE World Congress on Computational Intelligence held during June 2012.
[16]D. Goldberg. (1989). Genetic Algorithm in Search, Optimization and Machine Learning. Addison Wesley, 1989.
[17]Z. Michalewicz (1999). Genetic Algorithms + Data Structures = Evolution Programs, 3rd ed., Springer-Verlag, 1999.
[18]K. Krishna and M Narasimha Murty. (1999). Genetics k-means algorithm,” IEEE transactions on system, man and cybernetics, Part-B: Cybernetics , Vol. 29, No. 3, pp. 433-439