Human Factors and IT Competitive Value
27
0
0
Full text
(2) HUMAN IT REFEREED SECTION. According to the most recent findings, a large part of the positive effect of IT on business results seems to reside in the fact that the technology encouraged organizational changes (Orlikowski & Iacono 2000), such as restructuring into interdisciplinary workgroups, an increase in decision-making autonomy and a support for worker training (Brynjolfsson & Hitt 2000). Additionally, some human factors have been proposed, which provide a complementary effect alongside the technology (Powell & Dent-Micallef 1997; Bharadwaj 2000). The literature Various theoretical approaches in the field of business administration and sociology have tried to explain the link between information technology, value creation and obtaining and maintaining competitive advantage. Among them, the resource based view of the firm (RBV) (Penrose 1959; Wernerfelt 1984; Peteraf 1993; Barney 1991, 1995) has suggested new ideas helping to explain, at least partially, the function of IT as a strategic tool in the company. According to RBV, business elements susceptible of becoming key resources, such as IT, might be valuable (Prahalad & Hamel 1990; Barney 1995, 1996), rare (Grant 1996), and difficult to imitate or to substitute (Dierickx & Cool 1989; Wilcox-King & Zeithmal 2001). Barney (1996) added a fourth condition that consists in the element being complementary to other elements or resources of the organization resulting in complementary or synergy effects that would explain improvements in competitive position that are more than proportionate when the resources operate jointly, compared to when they operate separately. Applying the assumptions made by RBV, IT – considered in isolation – may constitute a value-generating resource (Byrd & Turner 2001), in its most advanced form it may be rare, but it can hardly be called difficult to imitate (Barney 1996; Kettinger et al. 1994). Moreover, due to the current rapid distribution of technological innovations (Freeman & Soete 1996), IT would be closer to the concept of commodity than to the notion of differentiating element. Nevertheless, when IT acts in conjunction with other human or management elements, it can generate a positive synergy effect which rival organizations find much more difficult to imitate or substitute (Keen 1993).. 48.
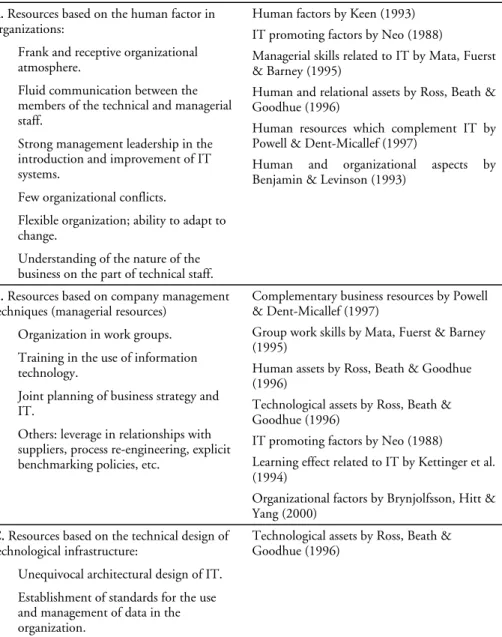
(3) ALFONSO VARGAS, M. JESÚS HERNÁNDEZ & SEBASTIÁN BRUQUE. However, what are the factors that produce a positive combinatorial effect alongside information technology? Various authors have tried to answer this question. Neo (1988) identified ten such factors, such as the existence of fluid communication between management and technical staff, harmony between a firm’s strategic planning and IT, and previous experience in technological development. Kettinger et al. (1994) identified as key elements the upper management’s commitment to IT implementation and the existence of a strong learning effect related to technological development. Mata, Fuerst & Barney (1995) pointed out the ability of executives to conceive, develop and exploit applications based on IT. Ross, Beath & Goodhue (1996) stressed three areas which promoted technological efficacy: the first related to the human dimension, the second with the design of the technological platform and the third with the relations between the organization’s management and technical teams. Powell & Dent-Micallef (1997) put forward as key elements the absence of conflict, organizational flexibility, a fluid internal communication and certain management techniques. In a similar vein, although using a different methodology, is the work of Brynjolfsson, Hitt & Yang (2000). According to Table 1 it is possible to divide resources complementary to IT into two large groups (Powell & Dent-Micallef 1997). In one group would be those elements related to the human factor inside the organization. Among these are the existence of an open and receptive climate in the organization, the fluidity of communication between management and technical staff and the leadership among upper management of the implementation of new technologies. In the second group would be those resources related to the techniques of business administration, such as the use of interdepartmental workgroups, a dedication to training in the new technologies, as well as the joint planning of business and technology. Additionally, and with reference to the work of Ross, Beath & Goodhue (1996), we have noted a third component related to the way technology is organized inside the company. This body of resources is related to the existence of an unmistakable design of the technological infrastructure, which allows the distribution of information between the different departments and functional areas, and to the existence of. 49.
(4) HUMAN IT REFEREED SECTION. standard procedures for the manipulation and management of data (Davenport 1999). Based on the RBV exposed above, we propose to test two hypotheses which relate the objective of this paper. Firstly, we aim to determine the effect of IT on the competitive position of companies. According to the RBV (Powell & Dent-Micallef 1997), having technological tools is not sufficient on its own in order to gain and maintain competitive advantage, a claim which is contained in the following hypothesis: Hypothesis H1 The level of utilization of IT, considered in isolation, is not related to the obtaining of better competitive positions. Secondly, following the work which has dealt with the effect of the function of IT in the organization (Powell & Dent-Micallef 1997; Bharadwaj 2000; Brynjolfsson, Hitt & Yang 2000), the combined influence of human elements complementary to IT (see appendix), alongside the implementation of IT, does lead to an improvement in competitive position. Thus the following hypothesis claims: Hypothesis H2 Complementary human resources, when used jointly with IT, are associated with the obtaining of better competitive positions.. 50.
(5) ALFONSO VARGAS, M. JESÚS HERNÁNDEZ & SEBASTIÁN BRUQUE. Complementary resource:. Corresponds to:. A. Resources based on the human factor in organizations:. Human factors by Keen (1993) IT promoting factors by Neo (1988). •. Frank and receptive organizational atmosphere.. Managerial skills related to IT by Mata, Fuerst & Barney (1995). •. Fluid communication between the members of the technical and managerial staff.. Human and relational assets by Ross, Beath & Goodhue (1996). •. Strong management leadership in the introduction and improvement of IT systems.. •. Few organizational conflicts.. •. Flexible organization; ability to adapt to change.. •. Understanding of the nature of the business on the part of technical staff.. Human resources which complement IT by Powell & Dent-Micallef (1997) Human and organizational Benjamin & Levinson (1993). aspects. by. B. Resources based on company management techniques (managerial resources). Complementary business resources by Powell & Dent-Micallef (1997). •. Organization in work groups.. •. Training in the use of information technology.. Group work skills by Mata, Fuerst & Barney (1995). •. Joint planning of business strategy and IT.. •. Others: leverage in relationships with suppliers, process re-engineering, explicit benchmarking policies, etc.. Human assets by Ross, Beath & Goodhue (1996) Technological assets by Ross, Beath & Goodhue (1996) IT promoting factors by Neo (1988) Learning effect related to IT by Kettinger et al. (1994) Organizational factors by Brynjolfsson, Hitt & Yang (2000). C. Resources based on the technical design of technological infrastructure: •. Unequivocal architectural design of IT.. •. Establishment of standards for the use and management of data in the organization.. Technological assets by Ross, Beath & Goodhue (1996). Table 1. Identification of complementary IT resources and capabilities. A summary.. 51.
(6) HUMAN IT REFEREED SECTION. The data and variables We have analyzed the relationships arising between IT, human factors and competitive advantage in the population of pharmaceutical distribution firms in a wide area of southern and central Spain. This sector has a long experience in the use of IT for organizational purposes, and was one of the pioneers in introducing computing into companies, computerizing and roboticizing their internal processes for the first time in the early 1970’s (Malo 1994, 83). The area under analysis comprises 16 wholesale firms that provide pharmaceutical products through pharmacies to a population of 8,834,000 inhabitants (22 % of the total Spanish population). We describe below the operationalization of the variables used in the analysis. According to the RBV, the competitive position that each organization achieves can be measured using economic performance variables such as ROI (Return on Investment ratio). In this way, there is a competitive advantage when a company generates better economic results over a sustained time period (Mehra 1996; Miller & Shamsie 1996; Sharma & Vredenburg 1998). However, we believe that indexes based on profitability (such as ROI) lose a large part of their efficacy in our study, due principally to the important role that co-operative firms have acquired in this industry. Co-operative firms control more than 70% of the market in the Spanish pharmaceutical distribution industry. Cooperative firms tend to engage in anticipated distribution of profits in a way that measures based on profitability can be distorted. After analyzing the literature (Miller & Shamsie 1996; Majumdar 1998), we propose a mixed system for measuring the competitive position, incorporating data from primary (based on client perception) as well as secondary sources (based on market share variation). The competitive position index will be determined by adding the mean interannual variation of market share over the period 1994-1998 and a subjective index formed from client perceptions of service excellence. Using both indexes together allows us to get a more complete view of the nature of competitive advantage, while avoiding the inconsistencies that arise when each index is used alone. The mean inter-annual variation of market share has been obtained from the business information directory Fomento de la Producción. 52.
(7) ALFONSO VARGAS, M. JESÚS HERNÁNDEZ & SEBASTIÁN BRUQUE. (2000), as well as from other sectorial databases (Infotel 2000). The global sales of pharmaceutical products in the various Spanish regions come from the database of the General Subdirectorate for Health Care and Pharmaceutical Provision of the Spanish Ministry of Health. The opinions of clients on the quality of service were obtained by sending a questionnaire to a total of 1,060 pharmaceutical clients. In the questionnaire the client was asked to evaluate each distribution company on a scale of 1 to 10, according to the quality of global service. At the same time we gathered additional information about which factors companies excelled in. As for the relevance of the territorial distribution of the companies, we used a design of survey according to probabilistic sampling, stratified in function of geographical location, with a nonproportional affixation, and implemented by sending by post, combined with personally administered questionnaires with interviewer. The fieldwork was carried out in June, July and September 2000. We received 623 valid evaluations from a total of 231 clients, which represents a proportion of response of 21.86%. This figure is comparable to those obtained by previous studies in the field of business analysis. Hall (1992) obtained a figure of 8.22% in a mailing to 847 executives. Powell (1992) achieved an index of 21%, while Powell & Dent-Micallef (1997); Gómez-Mejía (1992) and Zahra & Covin (1993) achieved superior figures (26, 28 and 28 per cent respectively). In the field of IT, Martins & Kambil (1999) achieved a response of 24% for their study. The procedure used when measuring the presence of the human variables was the following: after contacting a manager in each company by telephone, we elaborated an information-gathering procedure using interviews in the head offices of the companies that in 1999 were active in pharmaceutical distribution in the area under analysis. Interviewees from the companies represented three levels: top managers, IT managers and employees in operations. After analyzing the literature and the preliminary study, in which managers from three companies participated, we designed a different questionnaire for each level with a maximum of 45 items with 5 point Likert type scales and semantic differential scales. The technology managers and operations employees answered fewer questions, 33 and 10 respectively. In the questionnaire some of the questions had the aim of identifying the level at which intangible. 53.
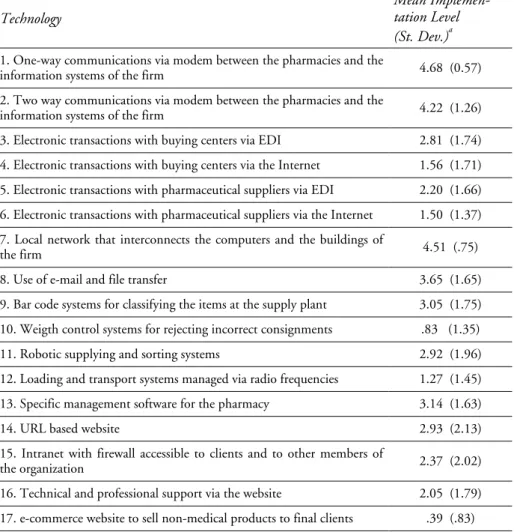
(8) HUMAN IT REFEREED SECTION. resources complementary to technology would appear, as well as the intensity at which each company used IT. The questionnaire initially consisted of open question interviews designed to be an introduction for the subsequent phase, and to obtain qualitative information. The period of information gathering ran from December 1999 to October 2000, with a total of 36 interviews in the 16 organizations of the population, where the interviewees comprised 16 upper management, 14 IT managers and 6 operations personnel. We remained in each organization during at least one workday. The average response from the three groups at each question gave us an evaluation of the resources that each company possessed. Measures were taken to avoid systematic error and error unrelated to the sample, and we eliminated sampling error by addressing the whole population. As a whole, and based on the theoretical review described above, we have analyzed 18 intangible resources with a positive complementary effect alongside IT although in this paper we only analyze the resources of human nature (see appendix). With the intention of synthesizing the combined effect which human intangibles may have on the competitive position of the company, we have brought the different intangibles together into one final variable. Thus the human factor complementary to IT value was obtained by calculating the arithmetic mean of the following values: (1) open and frank internal communication; (2) organizational consensus; (3) cognitive and creative capacity of the technical personnel; and (4) level of acceptance of change on behalf of the members of the organization. To measure the utilization of IT, we have identified a total of 17 computing, robotic and telecommunications tools (Madnick 1991) used in the pharmaceutical distribution sector. The presence of these types of technology was evaluated by including the items with Likert type scales 0-5 in the questionnaire given to members of the organizations forming part of the study, during the interviews described above. In this case, the value 0 indicated that the organization was not interested in the implementation of technology, while 1 meant that the organization was interested in developing it, but had not yet begun to do so. The average statistics describing the population are shown in Table 2.. 54.
(9) ALFONSO VARGAS, M. JESÚS HERNÁNDEZ & SEBASTIÁN BRUQUE. Mean Implementation Level a (St. Dev.). Technology 1. One-way communications via modem between the pharmacies and the information systems of the firm. 4.68 (0.57). 2. Two way communications via modem between the pharmacies and the information systems of the firm. 4.22 (1.26). 3. Electronic transactions with buying centers via EDI. 2.81 (1.74). 4. Electronic transactions with buying centers via the Internet. 1.56 (1.71). 5. Electronic transactions with pharmaceutical suppliers via EDI. 2.20 (1.66). 6. Electronic transactions with pharmaceutical suppliers via the Internet. 1.50 (1.37). 7. Local network that interconnects the computers and the buildings of the firm. 4.51 (.75). 8. Use of e-mail and file transfer. 3.65 (1.65). 9. Bar code systems for classifying the items at the supply plant. 3.05 (1.75). 10. Weigth control systems for rejecting incorrect consignments. .83 (1.35). 11. Robotic supplying and sorting systems. 2.92 (1.96). 12. Loading and transport systems managed via radio frequencies. 1.27 (1.45). 13. Specific management software for the pharmacy. 3.14 (1.63). 14. URL based website. 2.93 (2.13). 15. Intranet with firewall accessible to clients and to other members of the organization. 2.37 (2.02). 16. Technical and professional support via the website. 2.05 (1.79). 17. e-commerce website to sell non-medical products to final clients. .39 (.83). a. A value of 0 means that the firm is not interested in developing the technology; a value of 1 means that the implementation has not begun yet and 5 indicates that the company has implemented the technology at the maximum level.. Table 2. Information Technology in the Pharmaceutical Distribution Industry. Level of Use.. With the intention of facilitating the next analysis, we have built two indexes summarizing the level of IT in an organization. The first, which we will call General Technological Index, refers to the global level of. 55.
(10) HUMAN IT REFEREED SECTION. technology use of the company, and consists of the average value of the 17 technological items. The second indicator, the Specific Technological Index, is more selective in the sense that it only includes the most advanced technologies, and therefore the least widespread. These technologies are: (1) systems of internal communication or endogenous networks; (2) robotic and warehouse management technologies; and (3) Internet/Intranet technologies. Finally, we have used a number of variables related to the structure of the industry, and from the organizations themselves, with the intention of testing their effect on the competitive position of the companies. These variables are: (1) the size of the organization; (2) the co-operative character of the company; (3) the strategic orientation towards territorial expansion; (4) the competitive intensity which each organization faces; and (5) territorial differences in pharmaceutical consumption. The size has been considered a moderating variable in numerous studies related to RBV (Pettus 2001) and organizational analysis (e.g. Sepherd 1972; Hansen & Wernerfelt 1989; Ramaswamy 2001), and was calculated as the logarithm of the mean sales of the company in the period 1994-1998. Owing to the importance of the co-operative subgroup, we have used a dichotomous variable which is identified with the legal form of the company, 1 corresponding to a co-operative firm and 0 to a non-co-operative firm. There are various precedents that explain the way in which the ownership structure of companies affects their results (e.g. Côté 1991; Li & Simerly 1998), which given our earlier analysis of the sector could be especially significant in the pharmaceutical distribution industry. Considering the earlier analysis of the structure and characteristics of the industry, we have calculated the following variables: strategic orientation towards territorial expansion, differences in competitive intensity and territorial differences in pharmaceutical consumption. All derive from the strong local element of the competition that is found in the pharmaceutical distribution industry in Spain (Malo 1994). The “strategic orientation towards territorial expansion” variable was calculated based on the assessments of the company management by Likert type 5-point scales. The territorial differences in pharmaceutical consumption was defined as the quotient of the mean growth in pharmaceutical con-. 56.
(11) ALFONSO VARGAS, M. JESÚS HERNÁNDEZ & SEBASTIÁN BRUQUE. sumption in the province or provinces where the company was active in the period 1994-1998, and the mean growth of pharmaceutical consumption in Spain in the same period. This data was provided by the General Subdirectorate for Health Care and Pharmaceutical Provision of the Ministry of Health. Finally, the differences in competitive intensity were calculated from the number of companies with which, on average, each company competes. These figures were obtained from the information given by the pharmaceutical clients in the survey process described above. In our case it was not possible to use another type of measure for the competitive intensity index, because, like the Herfindhal Index (Hannah & Kay 1977), they all measure the global rivalry in the sector rather than the differences between companies. Table 3 depicts the descriptive values of the variables and their respective levels of association measured by Spearman’s ρ coefficient. The procedures To test the hypotheses H1 and the effects of the moderating variables, we will use the bivariate and partial correlation analysis. In this point, we must stress that in the population there is a clear heterocedastic effect in the analyses with the variables competitive intensity and variation of market share (Goldfeld-Quandt tests f = 5.58 for the competitive position index and f = 7.01 for mean inter-annual variation in market share), so that we have eliminated the population element with extreme values in the analyses in which these variables occur (see Vargas, Hernández & Bruque 2003 for a more detailed view). After analyzing Table 3, the industrial or organizational variables with a stronger association are, in this order: the index of competitive intensity, co-operative character and size factor. Taking into account the strong link between the variables’ size and co-operative character (ρ = -0.812), we have chosen to include as moderating variables in the analysis of partial correlation only the size and the index of competitive intensity. The results of this analysis are displayed in Table 4, and show that both variables explain a large part of the differences in competitive position.. 57.
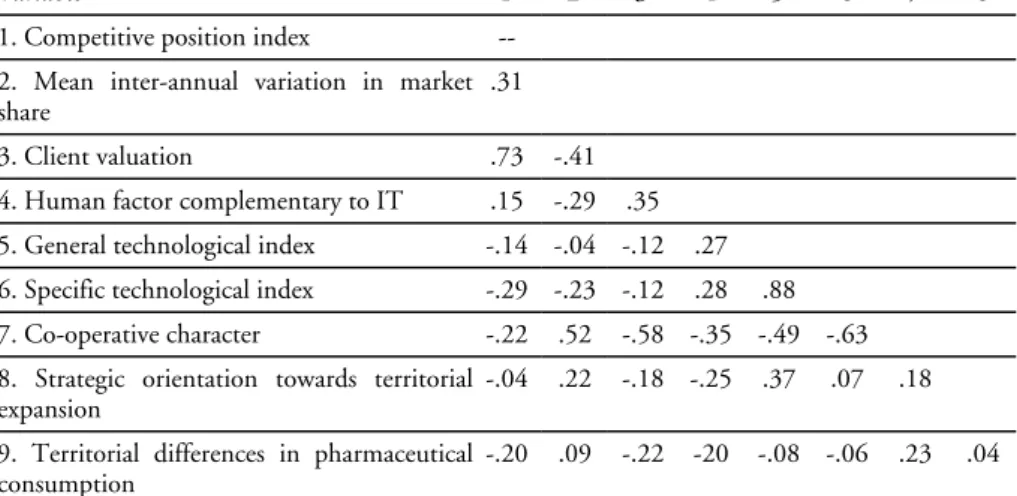
(12) HUMAN IT REFEREED SECTION. Variable 1. Competitive position index. Mean. St. Dev.. .00. 1.91. 1. 2. 3. 4. 5. 6. 7. 8. 9. 10. 2. Mean interannual variation in 94.36 10.46 .50 market share 3. Clients valuation 6.99 1.17. .86. .15. 4. Human factor complementary to IT. 3.78. .46. .65. .15. .63. 5. General 2.46 technological index. .90. .40. .42. .46. .51. 6. Specific 2.46 1.13 technological index. .39. .40. .50. .50. .94. 7. Size. 3.92. .65. .58. .40. .61. .52. .84. 8. Competitive intensity index. 3.57. .74. -.77 -.35 -.77 -.69 -.44 -.43 -.47. 9. Co-operative a character. .37. .50. -.61 -.16 -.84 -.58 -.78 -.84 -.81. 10. Strategic orientation towards 2.56 1.50 -.01 territorial expansion 11. Territorial differences in pharmaceutical consumption. .84. .00. .41. .88. .61. -16. -.19. .38. .34. .28. .29. -.08. -.32 -.10 -.31. .01. .07. .15. .13. .31. .14. .21. a. Correlation results for the co-operative variable must be treated with caution due to its dichotomous character.. b. It is not useful to calculate the level of confidence because the data comes from the whole population (there is no sample error).. Table 3. Descriptive statistics and Spearman’s Correlations.. b. Table 4 also shows partial correlation indexes moderated by the previous variables, which are used to check Hypothesis H1. According to these results, there are no significant links between general level of information. 58.
(13) ALFONSO VARGAS, M. JESÚS HERNÁNDEZ & SEBASTIÁN BRUQUE. technology and competitive position. What is more, this relation is weakly negative, even if the components of the index of competitive position – inter-annual variation of market share and client evaluation – are taken individually. We therefore accept the claim made in H1. On the other hand, the association relationships between the co-operative character and the levels of technology and human resources are worthy of note, whereby co-operative companies achieve superior results. Variable. 1. 1. Competitive position index. --. 2. 3. 4. 5. 6. 7. 8. 2. Mean inter-annual variation in market .31 share 3. Client valuation. .73. -.41. 4. Human factor complementary to IT. .15. -.29. 5. General technological index. -.14 -.04 -.12. .27. 6. Specific technological index. -.29 -.23 -.12. .28. 7. Co-operative character. -.22. .52. -.58 -.35 -.49 -.63. 8. Strategic orientation towards territorial -.04 expansion. .22. -.18 -.25. .37. .07. .18. 9. Territorial differences in pharmaceutical -.20 consumption. .09. -.22. -.08 -.06. .23. .35. -20. .88. .04. a. It is not useful to calculate the level of confidence because the data comes from the whole population (there is no sample error). a. Table 4. Partial Correlations . Moderating Variables: Size and Competitive Intensity.. Finally, hypothesis H2 asserts that information technology, if it is used in conjunction with complementary human resources, results in a better competitive position in companies which have both types of factors. Taking into account that combinatorial effects between variables cannot be explained by correlation calculations, we have designed a different method of testing the hypothesis (Vargas, Hernández & Bruque 2003), which will be discussed in the following. Among the techniques applicable in testing Hypothesis H2 we have chosen Data Envelopment Analysis (DEA), described for the first time by Charnes, Cooper & Rhodes (1978), and developed in later work. 59.
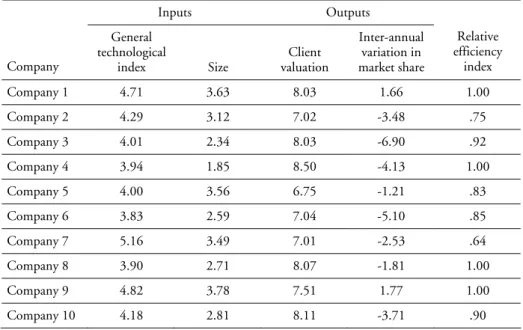
(14) HUMAN IT REFEREED SECTION. (Banker, Charnes & Cooper 1984; Charnes et al. 1985). This is a nonparametric analysis, which requires the identification of the inputs and outputs with which the relative efficiency of the companies in the use of these inputs or factors is measured. Applying the DEA analysis to the problem of the validation of Hypothesis H2 we have the following aims: (1) to identify those companies that achieve a higher index of efficiency in the management of IT; (2) to check the principal variables that might affect the relation between IT and competitive position; and (3) to compare, finally, the efficiency results obtained from the DEA with the quality of the human intangibles in the company. In short, we shall accept that Hypothesis H2 is proved if we find a relationship between a company’s efficiency in the management of IT and the quality of the human intangible, simultaneously checking the variables that may affect the relationship. For this we have identified as inputs of the DEA model the General Technological Index and the company size. The model has as outputs the two measures of competitive position: clients valuation and mean inter-annual variation in market share for the period 1994-1998. The above approach ensures that the efficiency indicator finally obtained will be a reliable reflection of good practice in the management of the technological resource and of the company size. The differences between the companies in their efficiency indexes will therefore be due to the skill with which some have managed to combine their technological resources with other resources. Every time that company size is included in the model, and consequently its controlled effects, the differences in efficiency must be down to factors related to human resources, or to adaptation of technological infrastructure, which are contributory to the technological element. We should however point out that there may be other variables which may exogenously affect the model, especially the competitive intensity which each organization faces, and the co-operative character of the companies. In order to check the effect of the co-operative character, we have applied the DEA analysis only to co-operative societies. The reason for this restriction lies in the fact that this is a homogeneous group of entities which also happens to be numerous in the population, since it. 60.
(15) ALFONSO VARGAS, M. JESÚS HERNÁNDEZ & SEBASTIÁN BRUQUE. comprises 10 of the 16 companies, which is 62.5% of the total. The competitive intensity can also have a certain influence on the results, so it will be taken into account at the moment of discussing and making definite conclusions. The results of the DEA model for the co-operative societies which make up the population appear in Table 5. These results express the level of efficiency with which the organizational units manage their IT resources and their company sizes. In four cases, the companies analyzed achieve a maximum efficiency index, while the other cases show some level of inefficiency. Inputs. Outputs. Size. Client valuation. Inter-annual variation in market share. Relative efficiency index. 4.71. 3.63. 8.03. 1.66. 1.00. Company 2. 4.29. 3.12. 7.02. -3.48. .75. Company 3. 4.01. 2.34. 8.03. -6.90. .92. Company 4. 3.94. 1.85. 8.50. -4.13. 1.00. Company 5. 4.00. 3.56. 6.75. -1.21. .83. Company 6. 3.83. 2.59. 7.04. -5.10. .85. Company 7. 5.16. 3.49. 7.01. -2.53. .64. Company 8. 3.90. 2.71. 8.07. -1.81. 1.00. Company 9. 4.82. 3.78. 7.51. 1.77. 1.00. Company 10. 4.18. 2.81. 8.11. -3.71. .90. General technological index. Company 1. Company. Table 5. Inputs, Outputs and DEA Results.. In Table 6 are shown the levels of association for the variable pairs which relate the relative efficiency index to human resources. The results indicate that there is a moderate relation between the efficiency index obtained via DEA and human resources complementary to IT. The Spearman correlation coefficients are positive but relatively weak. However, for the case of human variables extreme values can clearly affect the. 61.
(16) HUMAN IT REFEREED SECTION. global results, implying therefore that a heterocedastic situation exists (tests Goldfeld-Quandt f > 2 for the human factor complementary to IT and management factor complementary to IT). Variable. 1. 1. Relative efficiency index. --. 2. Human factor complementary to IT. .41. a. It is not useful to calculate the level of confidence because the data comes from the whole population (there is no sample error). Table 6. Efficiency in the Management of IT and Quality of Human Resources (N=10). a. If we remove the extreme element from the above calculations we obtain the association indexes that are shown in Table 7. Looking at the new results, there is strong level of association between the relative efficiency index of the technological resources and company size on the one hand, and the intangible resources of the human factor complementary to IT on the other. This situation does not change substantially if we calculate the partial correlation indexes for the above pairs of variables moderated by the index of competitive intensity (coefficients in parentheses) with which the affirmation made in Hypothesis H2 is proved. Variable. 1. 1. Relative efficiency index. -.844 (.489). 2. Human factor complementary to IT a. In brackets are shown the partial correlation index with competitive intensity as moderating variable. It is not useful to calculate the level of confidence because the data comes from the whole population (there is no sample error).. Table 7. Management Efficiency of IT and Quality of the Human, Managerial and a Technological Adaptation Resources (N=9). 62.
(17) ALFONSO VARGAS, M. JESÚS HERNÁNDEZ & SEBASTIÁN BRUQUE. Discussion and final remarks This study provides empirical evidence of the existence of some human factors that have a synergic effect jointly with the use of information technology. Although many studies and researchers have anticipated that some human intangibles may have a positive influence on business results, there are only a small number of studies that empirically test this relationship. Furthermore, there are even fewer studies carried out in Europe. Our work tries to fill this research and geographical gap while using an original methodological design. Our results show that the utilization of IT appears, in principle, to be associated with better competitive results. This relation is however strongly moderated by the effect of the size of the company and by the difference in competitive intensity that the firms face. On the other hand, testing Hypothesis H2 has brought to light that once all the variables that may intervene in the relation are checked, the combination of IT and complementary human factors are indeed associated with companies that finally obtain more competitive success. There is therefore some agreement between our results and those of followers of the strictest version of what is known as the productivity paradox (Solow 1987), and with some ideas in the somewhat technoskeptical work of Strassmann (1990). Indeed, just as Davenport (1999) claimed, it is not enough to throw computers at a problem to solve it, nor to improve the economic or production situation. It is necessary to have and to strengthen the framework formed by human and company elements which will enable and develop the potential beneficial effect of technology (Mirvis, Sales & Hackett 1991). Our results coincide in general with the assumptions from the hypothesis of strategic necessity, which claims that IT is a necessary but not sufficient condition to achieve privileged competitive positions (Clemons & Kimbrough 1986). In order for that to be achieved, IT must be accompanied by management, economic and human resources, which is the core of our argument. From the point of view of RBV, IT, considered separately, is a valuable resource, and in its most advanced form it may be rare, but it can hardly be defined as difficult to imitate (Barney 1991). In fact, in the pharmaceutical distribution industry we have been able to verify that the. 63.
(18) HUMAN IT REFEREED SECTION. robotic technologies used in the warehouse were implemented in practically all the companies by the same supplier, and even by the same technicians. This technology would therefore be closer to the concept of commodity than to that of the differentiating element. If, as in fact is the case, IT appears to be related to human complementary resources (Ross, Beath & Goodhue 1996), its positive effects could be strengthened in such a manner that it does become an element which generates competitive advantage (Powell & Dent-Micallef 1997; Bharadwaj 2000). This result bears a relation to the last condition introduced by Barney (1996) (but mentioned prior to that by Amit & Schoemaker (1993)), in the model of obtaining and maintaining competitive advantage, which claims that some resources, in this case IT, must act in conjunction with other resources or capabilities in order to generate sustainable advantage (Barney 1996, 160). The method of empirical evaluation which we have described ensures, additionally, that the combination of resources is associated with net gains in competitive position in companies, leaving aside other industrial and company factors (Porter 1980; Rajagopalan & Prescott 1990), so we have used a one-industry design in the empirical analysis (Rouse & Daellenbach 1999). We have also taken into account the explicative capacity of the size factor (Hansen & Wernerfelt 1989; Powell 1996), of territorial differences in market growth and of the strategic orientation of the company (Lee & Miller 1999; Hitt et al. 2001). In short, our results show that companies with an optimal level of technology, combined with adequate human resources, are able to achieve better competitive results (Vargas, Hernández & Bruque 2003). Another important finding of the present work lies in the identification of some factors of an intra-industrial nature which intervene in the relation between IT, intangible resources and competitive advantage. These are the intensity of the competitive rivalry that each company faces, on the one hand, and the ownership structure of the company, whether co-operative or non-co-operative, on the other. The intensity of competition in an industry has been analyzed by the Industrial Organization (Porter 1980), finding that an increase in competitive intensity in the long term leads to a reduction in the number of companies in competition, while the ones that remain are forced to. 64.
(19) ALFONSO VARGAS, M. JESÚS HERNÁNDEZ & SEBASTIÁN BRUQUE. improve their commercialization capacity to adopt to changes in technology and in processes, and to pay more attention to controlling production costs (Ramaswamy 2001, 991). Finally, this study demonstrates that the human factors complementary to IT are similar for North American companies as well as for European companies. Nevertheless, much more research is needed in this area to identify differences that may arise between the set of complementary human resources in Europe and the set previously identified in the United States. The differences regarding the economic structure, the legal regulation and the sociological and cultural factors between both sides of the Atlantic Ocean may lead to the existence of new complementary resources in the case of the European firms. One of the main differences can be related to the distinctive point of view that agents have on labor relations at the workplace. We encourage researchers to analyze if a more stable, long-term labor relationship may be related to a quicker and more effective implementation of new IT, and if this more effective IT implementation positively affects the level of organizational success. The study has some limitations, which we shall now enumerate. Firstly the results refer to the pharmaceutical distribution industry in Spain, so that the results may not be similar in other industries or other countries. Secondly the analyses we have undertaken are based fundamentally on correlation analysis. Thus it is only possible to certify that there are association relationships between variables, and not to claim causality. Finally, we have used as a statistical tool the DEA model, which has proved better able to explain findings of the work, but at the same time has imposed certain restrictions, such as a decrease in the number of organizations forming part of the study.. Alfonso Vargas-Sánchez is professor at the Management and Marketing Department of the University of Huelva, Spain. His research interests are strategic management, human resources management and information technology and competitive advantage. E-mail: [email protected]. 65.
(20) HUMAN IT REFEREED SECTION. M. Jesús Hernández-Ortiz is professor at the Business Administration, Accounting and Sociology Department of the University of Jaen, Spain. Her main research interests are the management of cooperative firms and the relationship between information technology utilization and competitive advantage. E-mail: [email protected] Sebastián Bruque-Camara is associate professor at the Business Administration, Accounting and Sociology Department of the University of Jaen in Spain. His main research interests are information technology utilization and competitive advantage, the information technology role in the pharmaceutical distribution industry, and human impact on information technology effectiveness. E-mail: [email protected]. 66.
(21) ALFONSO VARGAS, M. JESÚS HERNÁNDEZ & SEBASTIÁN BRUQUE. Appendix Human complementary resources used 1. Written and oral communication are very open in our firm 2. Our personnel communicate widely and not just with their own department 3. Management and technological staff frequently consult with management about technological or managerial decisions 4. The IT personnel are able to negotiate, train and give technological support appropriately 5. There is a lot of conflict in our firm (reversed) 6. We have a lot of conflict between our home office and our territorial warehouses (reversed) 7. Our technological personnel are very creative 8. Our IT personnel are committed to continuous learning 9. Our people are open and trusting with one another 10. Our people adapt quickly to changes 11. Our people have enthusiastically accepted the use of innovative IT. 67.
(22) HUMAN IT REFEREED SECTION. References amit, r. & p. j. h. schoemaker (1993). “Strategic Assets and Organizational Rent.” Strategic Management Journal 14: 33-46. amit, r. & c. zott (2001). “Value Creation in E-business.” Strategic Management Journal 22: 493-520. banker, r. d., a. charnes & w. w. cooper (1984). “Some Models for Estimating Technical and Scale Efficiencies in Data Envelopment Analysis.” Management Science 30.9: 1078-1092. barney, j. (1991). “Firm Resources and Sustained Competitive Advantage.” Journal of Management 17.1: 99-120. barney, j. (1995). “Looking Inside for Competitive Advantage.” Academy of Management Executive 9.4: 49-61. barney, j. (1996). Gaining and Sustaining Competitive Advantage. Reading: Addison-Wesley. benjamin, r. i. & e. levinson (1993). “A Framework for Managing IT-Enabled Change.” Sloan Management Review Summer: 23-33. bharadwaj, a. s. (2000). “A Resource-Based Perspective on Information Technology Capability and Firm Performance.” Management Information Systems Quarterly 24.1: 169-198. brynjolfsson, e. (1993). “The Productivity Paradox of Information Technology.” Communications of the ACM 26.12: 67-77. brynjolfsson, e. & l. hitt (1996). “The Customer Counts.” Information Week 596: 48-53.. 68.
(23) ALFONSO VARGAS, M. JESÚS HERNÁNDEZ & SEBASTIÁN BRUQUE. brynjolfsson, e., l. hitt & s. yang (2000). Intangible Assets: How the Interaction of Computers and Organizational Structure Affects Stock Market Valuations. (MIT Working Paper). Cambridge, MA: MIT, 2000-11-30. <http://ecommerce.mit.edu/erik/index.html>. byrd, t. a. & e. t. turner (2001). “An Exploratory Examination of the Relationship Between Flexible IT Infrastructure and Competitive Advantage.” Information and Management 39: 41-52. charnes, a., w. w. cooper & e. rodhes (1978). “Measurement in the Efficiency of Decision Making Units.” European Journal of Operational Research 2: 429444. charnes, a. et al. (1985). “Foundations of Data Envelopment Analysis for ParetoKoopmans Efficient Empirical Production Functions.” Journal of Econometrics 30: 91107. clemons, e. k. & s. o. kimbrough (1986). “Information Systems, Telecommunications, and Their Effects on Industrial Organization.” Proceedings of the Seventh International Conference on Information Systems. San Diego: Association for Information Systems. 99-108. côté, d. o. (1991). “La eficiencia de la empresa y la estructura de propiedad.” CIRIEC España 10: 17-40. davenport, t. h. (1999). “Human-Centered Information Management.” Harvard Business Review on the Business Value of IT. Boston, MA: Harvard Business School Press. 1-33. dierickx, i. & k. cool (1989). “Asset Stock Accumulation and Sustainability of Competitive Advantage.” Management Science 35.12: 1.504-1.511. fomento de la producción (2000). Data Bases. Barcelona: Fomento de la Producción. freeman, c. & l. soete (1996). Cambio tecnológico y empleo. Madrid: Fundación Universidad-Empresa. gómez-mejía, l. (1992). “Structure and Process of Diversification, Compensation Strategy and Firm Performance.” Strategic Management Journal 13.5: 381-397. grant, r. m. (1996). “Toward a Knowledge Based View of the Firm.” Strategic Management Journal 17. Winter Special Issue: 109-122.. 69.
(24) HUMAN IT REFEREED SECTION. hall, r. (1992). “The Intangible Analysis of Strategic Resources.” Strategic Management Journal 13: 135-144. hannah, l. & j. a. kay (1977). Concentration in Modern Industry: Theory, Measurement and the UK Experience. London: McMillan. hansen, g. s. & b. wernerfelt (1989). “Determinants of Firm Performance: The Relative Importance of Economic and Organizational Factors.” Strategic Management Journal 10: 399-411. hitt, l. & e. brynjolfsson (1996). “Productivity, Business Profitability, and Consumer Surplus: Three Different Measures of Information Technology Value.” Management Information Systems Quarterly 20.2: 121-143. hitt, m. a. et al. (2001). “Direct and Moderating Effects of Human Capital on Strategy and Performance in Professional Service Firms: A Resource-Based Perspective.” Strategic Management Journal 44.1: 13-28. infotel (2000). Databases. <http://www.infotel.es>. [March-October 2000] keen, p. (1993). “Information Technology and the Management Difference: A Fusion Map.” IBM Systems Journal 32: 17-39. kettinger, w. j. et al. (1994). “Strategic Information Systems Revisited: A Study in Sustainability and Performance.” Management Information Systems Quarterly March: 31-58. lee, c. s. (2001). “Modeling the Business Value of Information Technology.” Information and Management 39: 191-210. lee, j. & d. miller (1999). “People Matter: Commitment to Employees, Strategy and Performance in Korean Firms.” Strategic Management Journal 20: 579-593. li, m. & r. l. simerly (1998). “The Moderating Effect of Environmental Dynamism on the Ownership and Performance Relationship.” Strategic Management Journal 19.2: 169-179. lichtenberg, f. r. (1995). “The Output Contributions of Computer Equipment and Personnel: A Firm-Level Analysis.” Economics of Innovation and New Technology 3: 201-217. madnick, s. e. (1991). “The Information Technology Platform.” The Corporation of the 1990s: Information Technology and Technological Transformation. Ed. Scott Morton. New York: Oxford UP. 27-60.. 70.
(25) ALFONSO VARGAS, M. JESÚS HERNÁNDEZ & SEBASTIÁN BRUQUE. majumdar, s. k. (1998). “On the Utilization of Resources : Perspectives from the U.S. Telecommunications Industry.” Strategic Management Journal 19: 809-831. malo, p. (1994). Cofares: una historia de la distribución farmacéutica. Madrid: Grupo Cofares. martins, l. l. & a. kambil (1999). “Looking Back and Thinking Ahead: Effects of Prior Success on Managers. Interpretations of New Technologies.” Academy of Management Journal 42.6: 652-661. mata, f. j., w. l. fuerst & j. b. barney (1995). “Information Technology and Sustained Competitive Advantage: A Resource Based Analysis.” Management Information Systems Quarterly December: 487-505. mehra, a. (1996). “Resource and Market Based Determinants of Performance in the U.S. Banking Industry.” Strategic Management Journal 17: 307-322. miller, d. & j. shamsie (1996). “The Resource Based View of the Firm in Two Environments: The Hollywood Film Studios from 1936 to 1965.” Academy of Management Journal 39.3: 519-543. mirvis, p. h., a. l. sales & e. j. hackett (1991). “The Implementation and Adoption of New Technology in Organizations: The Impact on Work, People and Culture.” Human Resource Management 30.1: 113-139. neo, b. s. (1988). “Factors Facilitating the Use of Information Technology for Competitive Advantage: An Exploratory Study.” Information and Management 15: 191201. orlikowski, w. c. & c. s. iacono (2000). “The Truth Is Not out there: An Enacted View of the Digital Economy.” Understanding the Digital Economy: Data, Tools and Research. Eds. E. Brynjolfsson & B. Kahin. Cambridge, MA: MIT Press. 352-381 penrose, e. g. (1959). The Theory of the Growth of the Firm. New York: Wiley. peteraf, m. (1993). “The Cornerstones of Competitive Advantage: A Resource Based View.” Strategic Management Journal 14.3: 179-191. pettus, m. l. (2001). “The Resource-Based View as a Developmental Growth Process: Evidence from the Deregulated Trucking Industry.” Academy of Management Journal 44.4: 878-896.. 71.
(26) HUMAN IT REFEREED SECTION. porter, m. e. (1980). Competitive Strategy: Techniques for Analyzing Industries and Competitors. New York: Free Press. powell, t. c. (1992). “Strategic Alignment as Competitive Advantage.” Strategic Management Journal 13.7: 551-558. powell, t. c. (1996). “How Much Does Industry Matter? An Alternative Empirical Test.” Strategic Management Journal 17: 323-334. powell, t. c. & a. dent-micallef (1997). “Information Technology as Competitive Advantage: The Role of Human, Business and Technology Resources.” Strategic Management Journal 18.5: 375-405. prahalad, c. k. & g. hamel (1990). “The Core Competences of the Corporation.” Harvard Business Review May-June: 79-91. rajagopalan, n. & j. prescott (1990). “Determinants of Top Management Compensation: Explaining the Impact of Economic, Behavioral and Strategic Constructs and the Moderating Effects of the Industry.” Journal of Management 16: 515-538. ramaswamy, k. (2001). “Organizational Ownership, Competitive Intensity, and Firm Performance: An Empirical Study of the Indian Manufacturing Sector.” Strategic Management Journal 22: 989-998. ross, j. w., c. m. beath & d. l. goodhue (1996). “Develop Long-Term Competitiveness through IT Assets.” Sloan Management Review Fall: 31-42. rouse, m. j. & u. s. daellenbach (1999). “Rethinking Research Methods for the Resource-Based Perspective: Isolating Sources of Sustainable Competitive Advantage.” Strategic Management Journal 20: 487-494. sepherd, w. g. (1972). “The Elements of Market Structure.” Review of Economics and Statistics 54.1: 25-37. sharma, s. & h. vredenburg (1998). “Proactive Corporate Environmental Strategy and the Development of Competitively Valuable Organizational Capabilities.” Strategic Management Journal 19: 729-753. solow, r. m. (1987). “We’d Better Watch out.” New York Times Book Review 12 July 1987: 36. strassmann, p. a. (1990). The Business Value of Computers. New Canaan: Information Economic Press.. 72.
(27) ALFONSO VARGAS, M. JESÚS HERNÁNDEZ & SEBASTIÁN BRUQUE. vargas, a., m. j. hernández & s. bruque (2003; forthcoming). “Determinants of Information Technology Competitive Value. Evidence from a Western European Industry.” Journal of High Technology Management Research 14: 245268. wernerfelt, b. (1984). “A Resource Based View of the Firm.” Strategic Management Journal 5: 171-180 wilcox-king, a. & c. p. zeithmal (2001). “Competencies and Firm Performance: Examining the Causal Ambiguity Paradox.” Strategic Management Journal 22: 75-99. zahra, s. & j. covin (1993). “Business Strategy, Technology Policy, and Firm Performance.” Strategic Management Journal 14.6: 451-478.. 73.
(28)
Figure
+2

Related documents
For the poorest farmers in eastern India, then, the benefits of groundwater irrigation have come through three routes: in large part, through purchased pump irrigation and, in a
• Speed of weaning: induction requires care, but is relatively quick; subsequent taper is slow • Monitoring: Urinary drug screen, pain behaviors, drug use and seeking,
National Conference on Technical Vocational Education, Training and Skills Development: A Roadmap for Empowerment (Dec. 2008): Ministry of Human Resource Development, Department
19% serve a county. Fourteen per cent of the centers provide service for adjoining states in addition to the states in which they are located; usually these adjoining states have
Assessing the Impact of Biodiversity Conservation in the Management of Maize Stalk Borer (Busseola f
Field experiments were conducted at Ebonyi State University Research Farm during 2009 and 2010 farming seasons to evaluate the effect of intercropping maize with
○ If BP elevated, think primary aldosteronism, Cushing’s, renal artery stenosis, ○ If BP normal, think hypomagnesemia, severe hypoK, Bartter’s, NaHCO3,
As noted in the Literature Review, above, scholarship on the determinants of foreign direct investment (FDI) variously argue the influence of GDP growth, the openness of a
The key segments in the mattress industry in India are; Natural latex foam, Memory foam, PU foam, Inner spring and Rubberized coir.. Natural Latex mattresses are
