Copyright © 2014 Vilnius Gediminas Technical University (VGTU) Press Technika http://www.bjrbe.vgtu.lt
doi:10.3846/bjrbe.2014.39 OF ROAD AND BRIDGE ENGINEERING ISSN 1822-427X / eISSN 1822-4288
2014 Volume 9(4): 325–332
1. Introduction
Stone mastic asphalt (SMA) generally consists of gap graded aggregate gradation bonded by mastic, which is combination of mineral filler, bitumen and a fiber (Brown et al. 1997). SMA contains higher binder content than a dense graded mix. Addition of filler and fiber in a SMA mixture mainly reduces the binder drain. This structure improves the strength and the performance of SMA. High percentage of binder content is important to ensure the durability and laying characteristics of SMA than conven-tional dense graded mixtures (Greer 2006;Tapkin, Ozcan 2012). Addition of fiber enhances the holding capacity of binder within the aggregate skeleton, otherwise fat spots on the pavement surfaces appear after construction. Also, aggregate type has influential effect on asphalt mixture performance (Haritonovs et al. 2013).
Several studies in the past mainly focused on the influence of different parameters on the SMA per-formance (Hafeez et al. 2014; Muniandy, Huat 2005). According to Brown et al. (1997), mastic is a mixture of bitumen, filler, sand and stabilizing additives. The
stabilizing agents may be fibers (more effective in drain down) or modifiers (more resistant to rutting of SMA in the laboratory wheel tracking test). Filler is an impor-tant part of SMA to ensure proper stone-on-stone con-tact. The angular nature of filler effects on the stiffness of mortar (Brown et al. 1997). Similarly, aggregate in SMA should be strong enough to resist fractures and abrasion (Harris, Stiuart 1995). Xie and Watson (2004) reported variation of air voids in SMA and its influence on perfor-mance. Different methodologies have so far been used with different techniques and testing methods especially dynamic creep testing, wheel tracking test, dynamic modulus test, imaging technique, and voids in coarse aggregates (VCA) to ascertain SMA mixtures rut poten-tial (Apeagyei 2011; Goh et al. 2011; Hafeez et al. 2009; Masad 2004; Pouget et al. 2014; Retherford, McDonald 2013; Seo et al. 2007; Sivilevičius 2011; Su et al. 2008; Watson 2003). Several studies in the past revealed that SMA mixtures perform better in rut resistance than su-perpave asphalt mixtures (Prowell et al. 2002; Schwartz et al. 2003; Watson et al. 2004).
ASSESSING RUTTING POTENTIAL OF STONE MASTIC ASPHALT USING
WHEEL TRACKER AND DYNAMIC MODULUS TESTING
Imran Hafeez1, Mumtaz Ahmad Kamal2, Muhammad Waseem Mirza3
1, 2Dept of Civil Engineering, University of Engineering & Technology, Khanpur Road, Taxila, 47050, Pakistan 3Parson, Building 4, C Ring Road, Al Emadi Financial Square area, Doha, Qatar
E-mails: 1[email protected]; 2[email protected]; 3[email protected] Abstract. Rutting potential of stone mastic asphalt with varying aggregate gradations was assessed in the past mainly
by uniaxial compression testing which is not the only test to predict its true performance in the field. Dynamic test-ing and accelerated wheel tracktest-ing test are considered the most suitable laboratory test procedures. Four stone mastic asphalt mixtures were prepared in this study using PG 58-22 binder, Viatop plus CT-40 fiber and four aggregate tions with nominal maximum sizes of 9.5 mm, 12 mm, 19 mm and 25.4 mm. To access the effects of aggregate grada-tions, single type of bitumen, filler and fiber was used. Mixtures were tested and evaluated under both type of testing procedures at different temperature levels. A regression model was developed using wheel tracker test data to ascertain significant parameters that are directly influencing the rut depth. The statistics of the model shows an excellent degree of determinacy of 0.92 and a relative accuracy of 0.29. Sigmoidal functions using Witczak equations were determined from dynamic modulus master curves for characterization of mixes and compared with previous studies. Correlation between the wheel tracking factor and a dynamic modulus factor was also established at three frequency levels. The study reveals that a reasonable relationship exists between the wheel tracking factor and dynamic modulus factor for stone mastic asphalt mixtures.
Current study is focused on ascertaining the rut po-tential of SMA using wheel tracking test and dynamic modulus test and determining relationship between the findings of both the testing methodologies. Aggregate gra-dation was the major variable to be used.
2. Experimental program
2.1. SMA mixtures
Four aggregate gradations were selected to investigate the influence of size on rutting potential as reported in Ta-ble 1. For ease of readers, aggregate gradations have been presented with their Nominal Maximum Aggregate Sizes (NMAS). Three gradations, 25.4 mm, 19 mm and 12 mm NMAS were taken from AASHTO MP-8:2003 Standard Specification for Designing Stone Mastic Asphalt while fourth gradation with 9.5 mm NMAS was taken from Aus-tralian Asphalt Pavement Association (Hafeez et al. 2014). Aggregates were obtained from a local source of Margal-la Crush Quarry, which is one of the best lime stone ag-gregate sources in Pakistan and meeting max demand of highways construction. The mechanical properties of ag-gregates were determined in accordance with American Association of State Highway and Transportation Officials, Washington D.C. specifications that included sizing and grading, particle shape (an average flakiness index of 7%), absorption (0.58%), sand equivalent (85%), toughness
(19%), and soundness (2.32%). Fig. 1 shows typical per-centages of aggregate gradation used in the mixtures.
Superpave method of mixture design was adopted for optimum bitumen content and air voids. Superpave gyrato-ry compactor was found to produce less aggregate breaka-ge than Marshall Compactor (Gao et al. 2014). Binder was selected from the single source, which is a major source of bitumen in Pakistan. The basic purpose of selecting the sin-gle type and source of binder was to minimize its variability effects on rutting potential of SMA. Bitumen content desi-gned for mixtures was ranging from 6% to 7% at 0.3% of fi-ber content as reported in Table 1. Mixtures were prepared at design air voids ranging from 3.87% to 4.35%. Min voids in mineral aggregate were obtained in the range 16% to 17%. Mastic for SMA’s was prepared with PG 58-22 binder, filler (limestone dust) and Viatop cellulose fiber from J. Ret-tenmaier and Sohne (Hafeez et al. 2014) Germany. Viatop plus CT-40 fiber in the form of pellets was selected to pre-vent drain down of bitumen. It has significant elastomeric effects that contribute in the rut resistance of SMA mixtu-res. The purpose was to increase the stiffness in the form of rut resistance and to enhance the binder storage ability of SMA. The origin of Viatop fiber is ARBOCELL ZZ 8/1, which is mainly an adhesion promoter in the SMA and its dosage was 0.3% by weight of bitumen. The other constitu-ent of Viatop was Fischer-Tropsch-Wax. Asphalt binder of PG 58-22 was recommended by JRS, Germany to combine with Viatop plus CT 40 fiber for SMA preparation. It offers the best characteristics to disperse a fiber pellet properly in the pug mill including good economical aspects.
2.2. Wheel tracking test
Slab specimens of 40.3×40.3×7.5 cm size were prepared us-ing a roller compactor and conducted a wheel trackus-ing test at 720 Newton load. The lift thickness of slab specimens was taken as 7.5 cm to cover the max size of 25.4 mm. The compaction pressure and number of roller compactor passes were selected to control air voids of SMA. Speci-mens in three replicates were tested under wheel tracking at 25 oC, 40 oC and 60 oC. This temperature range was se-lected on the basis of field conditions. The moving table in a wheel tracking test as shown in Fig. 2 reciprocates at a frequency of 53 passes per minute. The formation of rut was measured using linear variable differential transducers in accordance with BSEN12697-22:2003Bituminous Mix-tures. Test Methods for Hot Mix Asphalt. Wheel Tracking.
Wheel tracking machine applied 10 000 cycles of load on SMA mixtures and recorded the rut depth at each cycle. Rut depth data at each 400 cycle was extracted for Fig. 1. Aggregate gradations with NMAS
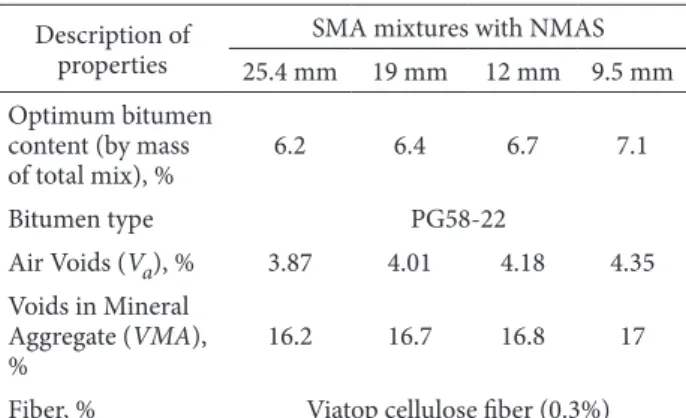
Table 1. Typical grading and bitumen content for SMA mixtures
Description of
properties 25.4 mm 19 mmSMA mixtures with NMAS12 mm 9.5 mm Optimum bitumen
content (by mass
of total mix), % 6.2 6.4 6.7 7.1
Bitumen type PG58-22
Air Voids (Va), % 3.87 4.01 4.18 4.35 Voids in Mineral
Aggregate (VMA),
% 16.2 16.7 16.8 17
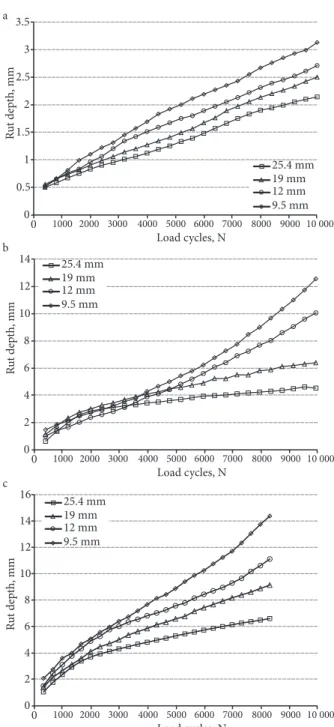
plotting the graphs. The main purpose of selecting 25 points in 10 000 cycles, each at every 400 cycle was to make a good presentation of mixture’s rut development. Influence of load cycles on rut depth at 25 oC, 40 oC and 60 oC have been shown in Fig. 3. It may be noted from Fig. 3 that that rut depth formation depends on number of load repetitions at a specific temperature. Plots show that with an increase in ag-gregate gradation size of SMA, rutting depth decreases. The summary of rut formation of SMA mixtures at 10 000 load cycles has presented in Table 2. At 60 oC, SMA mixture with 25.4 mm NMAS showed minimum value of rut depth and SMA with 9.5 mm NMAS yield highest value.
Regression analysis was performed on wheel tracking data of SMA mixtures against load cycles and correlations between rut depth and load cycles were developed on Log space as typically shown in Fig. 4. The intercept coefficient a and the slope coefficient b was determined at different tem-peratures from following typical linear fit line equations:
, (1)
where a and b – the intercept and slope coefficient of the best fit straight line.
The rut rate in the form of slope coefficient is an im-portant parameter that defines rut potential of asphalt mixtures. Fig. 5 shows the influence of max size of aggre-gate gradation on slope coefficient in a bar chart form. It may be noted that slope coefficient decreases with an in-crease in the max size of aggregate gradation and has max value at 60 oC.
It may be noted from Fig. 5 that resistance to rut of asphalt mixture increases with an increase in the nominal max size of aggregate gradation. Slope coefficient is an dicator of asphalt mixture’s resistance to rut. With an in-crease in temperature the slope coefficient inin-creases. 2.3. Dynamic modulus testing
Specimens (150 mm diameter by 180 mm thick) were pre-pared for four SMA mixtures, which were cored and cut to final size of 100 mm diameter by 150 mm thickness. Aver-age air voids of cored specimens were in the range of 3.32% to 4.05%. Dynamic modulus test was performed according to AASHTOTP-62:2004 Standard Method of Test for De-termining Dynamic Modulus of Hot-Mix Asphalt Concrete Mixtures at 25 oC, 40 oC and 60 oC. A sinusoidal compres-sive stress wave was applied to test specimens at loading fre-quencies of 25 Hz, 10 Hz, 5 Hz, 1 Hz, 0.5 Hz and 0.1 Hz. A stress level of 500 kPa, 200 kPa and 50 kPa was selected at 25 oC, 40 oC and 60 oC, respectively. The objective of apply-ing stress control mode was to get lower numbers of cycles to failure as compared to controlled strain test.
Results of dynamic modulus test at specified stress level at each temperature have only been reported in this study for comparison. Dynamic modulus and phase angles were recorded at each frequency and temperature level. It may be noted from Fig. 6 that temperature and frequency levels have significant influence on the dynamic modulus of SMA mixtures. In comparison, mixture with 25.4 mm max aggregate size gradation produced higher value of
dynamic modulus. Typical master curves at reference tem-perature of 25 °C were constructed to complete the cha-racterization of SMA mixtures. Individual stiffness curves Fig. 3. Rut depth formation of SMA at: a – 25 °C; b – 40 °C;
c – 60 °C
Table 2. Rut depth in SMA mixtures tested under the wheel
tracking machine
NMAS size, mm
Rut depth of SMA mixtures at 25 oC at 40 oC at 60 oC
mm
25.4 2.15 4.68 6.61
19 2.51 6.96 9.04
12 2.72 9.98 12.18
before applying a shift factor has been shown in Fig. 6. An arrow mark shows a direction of shift of one temperature data to a reference temperature data. Fig. 7 shows a de-veloped master curve between Log of Reduced Time (Tr) and Log E*. T
r is difference of time of loading (reciprocal of frequency) and logarithm of shift factor.
Master curve development using a dynamic modulus test data is considered as a critical input in flexible pave-ment design. Master curve helps in predicting the influence of different parameters on asphalt mixtures performance.
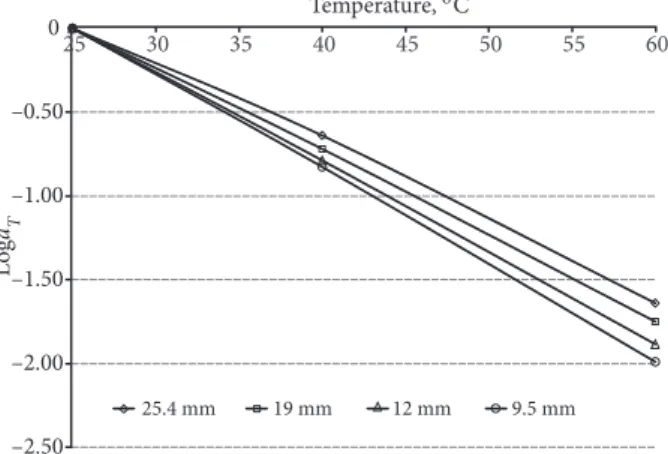
Nonlinear regression technique using a software packages was performed on the measured dynamic modulus test data. The shift factors (aT) at each temperature were deter-mined and plotted against temperature as shown in Fig. 8. Shift factor (aT) determines the amount of shift that has been made to superimpose the frequency-stiffness data at any temperature to a specific temperature. It is a ratio of time that is required to give a specified response at a cer-tain temperature and the time required to give an identi-cal response at the reference temperature. It may be noted that the temperature susceptibility of SMA mixtures de-pends on aggregate gradation. With an increase in the size of aggregate gradation the SMA mixture susceptibility to rut reduces.
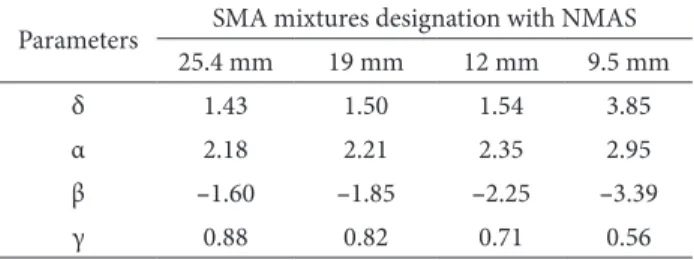
The dynamic master curves have been presented by the sigmoidal functions as described by Mechanistic-Em-pirical Pavement Design Guide 2008 by American Associ-ation of State Highway and TransportAssoci-ation Officials in the following equation:
. (2)
The fitting parameters δ and α depend on aggregate gradation, binder content and air void and also represents the max and min values of the modulus. The sum δ+α also represents the max value of applied stress that damages the Fig. 4. Typical plot for intercept and slope coefficient copmutation
Fig. 5. Summary of slope coefficient for SMA mixtures
Fig. 6. Individual stiffness curves at each temperature before shifting
Fig. 7. Developed dynamic modulus master curves for SMA
mixtures after shifting
specimen. The shape parameters β and γ depend on cha-racteristics of asphalt binder. A brief summary of above function has presented in Table 3.
Sigmoidal functions help to characterize the master curves in terms of shape and locations. Different values of these functions against different set of input data have been reported by researcher in the past. For comparison few results have been reported in Table 4.
Tables 3 and 4 show that values of sigmoidal function depends upon mix properties and testing features that mainly involve type of testing, material types and test condi-tions. Sigmoidal functions are sensitive to asphalt binder and mixtures properties (Hafeez et al. 2013; Zhao et al. 2013). 3. Results and discussions
3.1. Rut Prediction Model
A regression model was developed using the wheel track-ing test data that determines the influence the aggregate gradation in terms of nominal max size D on the result-ant rut depth h. Other parameters like air voids, bitumen content and the voids in mineral aggregate vary in a nar-row range in the mixtures and have no significant effect on the model. The MEPDG power model was followed for determination relationships between the predicted and the measured permanent to recoverable ratio under each test condition. Microsoft Excel Solver tool was applied for least square regression analysis to measure rut depth h. The least values of nonlinear regression coefficients (a1, a2, a3, a4) were determined to define relationship between the predicted and measured depth at any number of load cycle “N”. The following model on the basis of the goodness-of-fit parameters was established:
. (3)
The above equation may be presented as
. (4)
Statistics of the model: R2 = 0.92 (Coefficient of Determination); Sy = 3.05 (Standard Deviation);
(Relative Accuracy); observation points = 3564.
The power coefficient of load cycles and aggregate size in the above model are close that indicates the relative im-portance of both the variables. The temperature coefficient has almost double value than the load cycle and size of aggre-gate that means it has relatively twice the impact over the rut potential of SMA. Taking the logarithm and transforming into a linear form, the above model may be presented as
. (5)
Predicted and measured rut depths data was plotted on a single space to ascertain the relative accuracy of the model. Data within the secondary zone of permanent de-formation are shown in Fig. 9 that depicts minimum bias
in the model. Horizontal axis represents the rut depth data of different SMA mixtures at different temperature levels obtained from wheel tracking machine. Vertical axis re-presents the data of SMA mixtures at different tempera-ture levels obtained from the above regression model for 10 000 load cycles values. Each curve on measured-pre-diction model data scale represents a rut data of a mixtu-re obtained at any of the temperatumixtu-res (25 oC, 40 oC or 60 oC). Straight line at each test condition followed a 45° line trend which shows an excellent degree of agreement between the measured and the predicted data.
Statistics of the model enhances author’s confiden-ce towards the utilization of regression model in further
Table 3. Parameters for dynamic modulus master curve
Parameters SMA mixtures designation with NMAS
25.4 mm 19 mm 12 mm 9.5 mm
δ 1.43 1.50 1.54 3.85
α 2.18 2.21 2.35 2.95
β –1.60 –1.85 –2.25 –3.39
γ 0.88 0.82 0.71 0.56
Table 4. Sigmoidal functions reported in other studies
References of previous
studies Sigmoidal functions
Rowe et al.
(2009)
Witczak parameters computed with RHEA Software:
For mix at 3.8% air voids δ = ‒0.954, α = 4.613, β = –1.64, γ = –0.428.
Richard parameters for dynamic modulus master curve:
For mix at 3.8% air voids δ = 0.301, α = 4.094, β = –1.513, γ = –0.395.
Kim and Partl (2009)
For Mastic asphalt tested under uniaxial compression test:
δ = 1.350, α = 1.860, β = ‒2.820, γ = 0.680.
Flintsch
et al. (2006)
For in place hot mix asphalt cores taken from 18 sites
Average values δ = 4.2837, α = 2.1672, β = –0.6373, γ = 0.5853.
analysis and comparison with the dynamic modulus test data in the laboratory. The model was further analyzed for percentage error to measure the range of percentage diffe-rence between the measured and observed data. Frequen-cies of observations were recorded against each percenta-ge increase in differences. Histogram between percentapercenta-ge difference and the frequency of observation was plotted to measure the significance of model. Results of histogram as shown in Fig. 10 revealed that 90% of percentage differen-ces are within ±1% with a median value of –0.085.
It may be noted from Fig. 10 that variation in the va-lues within the data range is low and the median value is acceptable. The statistical analysis of the model shows that the input parameters are in close agreement and has influ-ential effects on the rut resistance of asphalt mixtures.
3.2. Wheel tracking factor and
Among the six frequency levels (25 Hz, 10 Hz, 5 Hz, 1 Hz, 0.5 Hz and 0.1 Hz) used in dynamic modulus test, results of
lower frequency levels of 1 Hz, 0.5 Hz and 0.1 Hz have been reported in this study. Although these frequency levels are not true representative of slow moving trucks in the field, but still they are considered critical in well performing the asphalt mixtures under cyclic loading. Low frequencies are normally selected for the design of parking areas. Also, the wheel tracking test traveled at a speed of 1.44 km/h (Bahia, Anderson 1995), which is a representative of computing the same effect. An effort was made to compare dynamic modulus test at middle stress levels (200 kPa) as reported in Table 3 with the wheel tracking at lower frequencies. The objective is only to simplify and signify the influence of high temperature and low frequency levels on corre-lation between the results of both the tests. A parameter for SMA mixtures was computed and presented at low frequency levels. Wheel tracking factor, which was the computed rut depth from the regression model, was then plotted against the dynamic modulus test parameter . Data presented in Table 5 between the wheel
tracking factor and at each frequency level are shown in Fig. 11.
Strong relationship exists between the wheel tracking factor and |E*|/sin (δ) as shown in the following equations:
at frequency of 1 Hz, , R2 =0.93, (6) at frequency of 0.5 Hz, , R2 =0.97, (7) at frequency of 0.1 Hz, , R2 =0.98. (8) Whereas x and y in above equations presents the wheel tracking factor and , respectively. It may be noted from Eqs (6)–(8) that both the constants increase with a decrease in frequency level, which clearly indicates the in-fluence of frequency level on the rut prediction factors. High-er rut depths wHigh-ere obsHigh-erved at low frequency level because of asphalt being a visco-elastic (time dependent) material. Fig. 10. Percentage differences between the observed and the
predicted rut depth
Table 5. Comparison of rut depth with values at different frequencies
Rut depth measured from wheel tracking in descending
order
values at
1 Hz 0.5 Hz 0.1 Hz
2.79 12 211.81 11 967.57 11 608.50
3.32 9315.83 9036.36 8674.90
4.38 6119.57 5844.19 5493.54
4.95 5958.30 5600.80 5096.73
5.03 4732.76 4354.14 3744.56
5.89 4562.54 4060.66 3248.53
7.30 1994.89 1675.71 1240.02
7.76 3339.20 2604.58 1692.97
8.69 1257.76 893.01 491.16
8.93 2621.78 1651.72 726.76
11.45 862.08 474.14 156.47
13.17 725.41 319.18 73.41
Fig. 11. Correlations between wheel the tracking factor
4. Conclusions
Based on testing and analysis of results, the following con-clusions have been drawn.
1. Maximum size of aggregate and temperature has significant influence on the rut potential of stone mastic asphalt mixtures. By increasing maximum size of aggre-gate gradation from 9.5 mm to 25.4 mm, around 60% rut value of mixtures reduced at temperature of 60 oC.
2. The proposed model from the wheel tracking test data depicts that the rut depth as a function of number of load cycles, temperature and maximum size of the aggre-gate gradation at a relative accuracy of 0.29 and degree of determination of 0.92.
3. At lower frequency levels relationship between the wheel tracking factor and becomes stronger as R2 enhances from 0.93 to 0.98. Also, the slope and intercept coefficients of these relationships were observed to be in-creased by almost 100%.
References
Apeagyei, A. 2011. Rutting as a Function of Dynamic Modu-lus and Gradation, Journal of Materials in Civil Engineering
23(9): 1302–1310.
http://dx.doi.org/10.1061/(ASCE)MT.1943-5533.0000309 Bahia, H. U.; Anderson, D. A. 1995. The New Proposed
Rheologi-cal Properties of Asphalt Binders: Why are they Required and
How Do they Compare to Conventional Properties. Reports
No. STP 1241. 27 p.
Brown, E. R.; Haddock, J. E.; Mallick, R. B.; Lynn, T. A. 1997.
Development of a Mixture Design Procedure for Stone Matrix
Asphalt (SMA). NCAT Report No. 97–3. 34 p.
Flintsch, G.; Loulizi, A.; Mcghee, K. 2006. Determination of the in-Place Hot-Mix Asphalt Layer Modulus for Rehabilitation
Projects Using a Mechanistic-Empirical Procedure. Report
No. FHWA/VTRC 07-CR1, Virginia Transportation Re-search Council, Charlottesville, Virginia.
Gao, L.; Ni, F.; Charmot, S.; Luo, H. 2014. Influence on Compac-tion of Cold Recycled Mixes with Emulsions Using the Su-perpave Gyratory Compaction, Journal of Materials in Civil
Engineering 26(11): 04014081.
http://dx.doi.org/10.1061/(ASCE)MT.1943-5533.0000987 Goh, S.; You, Z.; Williams, R.; Li, X. 2011. Preliminary Dynamic
Modulus Criteria of HMA for Field Rutting of Asphalt Pave-ments: Michigan’s Experience, Journal of Transportation
En-gineering 137(1): 37–45.
http://dx.doi.org/10.1061/(ASCE)TE.1943-5436.0000191 Greer, G. 2006. Stone Mastic Asphalt – a Review of Its Noise
Reducing and Early Life Reducing Properties, in Proc. of
ACOUSTICS 2006. November 20–22, 2006, Christchurch,
New Zealand. 319–323.
Hafeez, I.; Kamal, M. A.; Mirza, M. W. 2014. An Experimental Study to Select Aggregate Gradation of Stone Mastic Asphalt,
Journal of Chinese Institute of Engineer.
http://dx.doi.org/10.1080/02533839.2014.953242
Hafeez, I.; Hussain, J.; Riaz, K.; Khitab, A.; Hussain, S.; Zaidi, B.; Farooqi, U.; Hayat, A.; Ahmed, I.; Asif, A. 2013. Influence of Time and Temperature on Asphalt Binders Rheological Prop-erties, Life Sciences Journal 10(12s): 894–898.
Hafeez, I.; Kamal, M. A.; Ali, G. 2009. Assessment to Resistance to Rutting of Asphalted Material Using a Wheel Tracker,
Jour-nal of Engineering and Applied Sciences 28(2): 53–60.
Haritonovs, V.; Zaumanis, M.; Brencis, G.; Smirnovs, J. 2013. Performance of Asphalt Concrete with Dolomite Sand Waste and Bof Steel Slag Aggregate, The Baltic Journal of Road and
Bridge Engineering 8(2): 91–97.
http://dx.doi.org/10.3846/bjrbe.2013.12
Harris, B. M.; Stuart, K. D. 1995. Analysis of Mineral Fillers and Mastics Used in Stone Matrix Asphalt, Journal of the
Associa-tion of Asphalt Paving Technologists 64: 54–95.
Kim, H.; Partl, M. N. 2009. Stiffness Comparison of Mastics As-phalt in Different Tests Modes, in 2nd Workshop on Four Point
Bending. University of Minho.
Masad, E. 2004. X-Ray Computed Tomography of Aggregates and Asphalt Mixes, Journal of Materials Evaluations 62(7): 775–783.
Muniandy, R.; Huat, B. K. 2005. Laboratory Diametral Fatigue Performance of Stone Matrix Asphalt with Cellulose Oil Palm Fiber, American Journal of Applied Sciences 3(9): 2005–2010. Prowell, B. D.; Cooley, Jr L. A.; Schreck, R. J. 2002. Virginia’s Ex-perience with 9.5-mm Nominal-Maximum-Aggregate-Size Stone Matrix Asphalt, Transportation Research Record 1813: 133–141. http://dx.doi.org/10.3141/1813-16
Pouget, S.; Sauzéat, C.; Benedetto, H. Di.; Olard, F. 2014. Calcula-tion of Viscous Energy DissipaCalcula-tion in Asphalt Pavements, The
Baltic Journal of Road and Bridge Engineering 9(2): 123–130.
http://dx.doi.org/10.3846/bjrbe.2014.16
Retherford, J.; McDonald, M. 2013. Permanent Deformation Pre-dictive Equations Applicable to Mechanistic-Empirical Flex-ible Pavement Design, Journal of Transportation Engineering
139(12): 1156–1163.
http://dx.doi.org/10.1061/(ASCE)TE.1943-5436.0000588 Rowe, G. M.; Khoee, S. H.; Blankenship, P.; Mahboub, K. C. 2009.
Evaluation of Aspects of E* Test by Using Hot-Mix Asphalt Specimens with Varying Void contents, Transportation
Re-search Record 2127: 164–172.
http://dx.doi.org/10.3141/2127-19
Schwartz, C. W.; Michael, L.; Burke, G. 2003. Performance of Stone Matrix Asphalt Pavements in Maryland, Journal of the
Association of Asphalt Paving Technologists 72: 287–314.
Seo, Y.; El-Haggan, O.; King, M.; Jon Lee, S. J.; Kim, Y. R. P. E. 2007. Air Voids Models for the Dynamic Modulus, Fatigue Cracking, and Rutting of Asphalt Concrete, Journal of
Materi-als in Civil Engineering 19(10): 874–883.
http://dx.doi.org/10.1061/(ASCE)0899-1561(2007)19:10(874) Sivilevičius, H. 2011. Modelling the Interacion of Transport
Sys-tem Elements, Transport 26(1): 20–34.
http://dx.doi.org/10.3846/16484142.2011.560366
Su, K.; Sun, L.-J.; Hachiya, Y. 2008. A New Model for Predict-ing RuttPredict-ing in Asphalt Pavement EmployPredict-ing Static Unaxial Penetration Test, International Journal of Pavement Research
Technology 1(1): 24–33.
Tapkin, S.; Ozcan, S. 2012. Determination of the Optimal Poly-propylene Fiber Addition to the Dense Bituminous Mixtures by the Aid of Mechanical and Optical Means, The Baltic
Jour-nal of Road and Bridge Engineering 7(1): 22–29.
http://dx.doi.org/10.3846/bjrbe.2012.03
Stone-on-Stone Contact of HMA Mixtures, Transportation Research
Record 1891: 182–190. http://dx.doi.org/10.3141/1891-21
Watson, D. E. 2003. Updated Review of Stone Matrix Asphalt and Superpave Projects, Transportation Research Record 1832: 217–223. http://dx.doi.org/10.3141/1832-26
Xie, H.; Watson, D. E. 2004. Determining Air Voids Content of Compacted Stone Matrix Asphalt Mixtures, Transportation
Research Record 1891: 203–211.
http://dx.doi.org/10.3141/1891-24
Zhao, Y.; Liu, H.; Bai, L.; Tan, Y. 2013. Characterization of Lin-ear Viscoelastic Behavior of Asphalt Concrete Using Com-plex Modulus Model, Journal of Materials in Civil Engineers
25(10): 1543–1548.
http://dx.doi.org/10.1061/(ASCE)MT.1943-5533.0000688