doi: 10.15802/stp2015/56998 © O. Y. Yehorov, 2015
АВТОМАТИЗОВАНІ
СИСТЕМИ
УПРАВЛІННЯ
НА
ТРАНСПОРТІ
UDC 629.4.066:656.259.13
O. Y. YEHOROV
1*1*Dep. «Electronic Computing Machines», Dnipropetrovsk National University of Railway Transport named
after Academician V. Lazar\an, Lazaryan St., 2, Dnipropetrovsk, Ukraine, 49010, tel. +38 (056) 373 15 89, e-mail [email protected], ORCID 0000-0002-8260-9463
THE USE OF THE EXPERIMENT PLANNING METHOD
TO EVALUATE THE ACCURACY
OF FLEXIBLE UNITS IDENTIFICATION
Purpose. The identification of rolling stock on the railroads is an integral part of many automation systems as trains in general and cars separately. Various information management systems at sorting yards require the opera-tional information about the object while performing the manufacturing operations. The improvement of the deter-mination accuracy of different parameters characterizing the rolling stock, leads to the immediate quality progress in the traffic volumes management. The aim of the paper is to develop a method to estimate the errors of determination the interaxle distance of the flexible units in the control section using the point path-control transducer for future identification of cars and locomotives. Methodology. To achieve this goal the simulation method and experiment planning were used. The simulation model allowing determining the time intervals between the collisions of wheel-set of movable units in point path-control transducer on the control section with variable characteristics of identifica-tion devices was developed. The values of the time intervals obtained with using the simulaidentifica-tion mode were applied in the method of experiment planning to the final target. Findings. The calculated analytical values of the errors of the interaxle distances do not have the significant differences from values obtained using the simulation model. It makes possible to use the received functional dependence to estimate the possible errors in the identification of roll-ing stock. The results of this work can be used to identify separate flexible units, and trains in general. Originality. The functional dependence of the error of the interaxle distance error from the fixing point of the wheel path-control transducer, the distance between the sensors and the measured distance was derived using a previously conducted research of the factors influencing the error in determining the interaxle distance of the movable units, and devel-oped simulation model to calculate the interaxle distance. Practical value. This functional dependence allows solv-ing the followsolv-ing tasks: to calculate the maximum possible error of determinsolv-ing the interaxle distance of the mov-able units at known parameters of control section and calculation of parameters of the control section, when the pos-sible acceptable error of determining the interaxle distance of the flexible units is known.
Keywords: experiment planning method; rolling stock identification; control section; axle spacing; point track transducer
Introduction
Identification of rolling stock on the railroads, as trains in general and cars separately, is an inte-gral part of many automation systems. Various
quality progress of car traffic volumes management. The increase in the accuracy of the information, automatic acquisition and processing of signals in-crease the capacity of the station due to the time advantage when certain manufacturing operations is amenable to automation. And this in turn the de-crease in cost of transportation, inde-crease of cars use rationality, the liberation of human resources, im-proving the traffic safety on the railways, etc.
To the range of such systems tasks the following definition of the static characteristics of the rolling stock that passed the control section relates: the number of axes, number and number of axes of movable units, movable units type (platform, cov-ered car, etc.), etc. In this case, each of the systems is presented in the form of implemented method to identify the flexible units consisting of reset algo-rithm, processing and analysis of data, and also the constructive possibilities of the control section and their means of railway automatics [1-3, 7, 14].
This paper considers a method of determining axle base of the movable units; more precisely the analysis of possible faults in determination of this parameter identification is carried out. Determina-tion of interaxle distance of the flexible unit is the most often used to determine its type, which in some systems will allow determining a few figures of its item numbers. One of such systems is de-scribed in the paper [7].
Purpose
The aim of this work is to develop a method to estimate the determination errors of the interaxle distances of movable units in the control section using the point path-control transducer for future identification of cars and locomotives.
Methodology
The simulation method and experiment plan-ning were used to achieve this goal.
Simulation model for determination the interaxle distance of the flexible units.
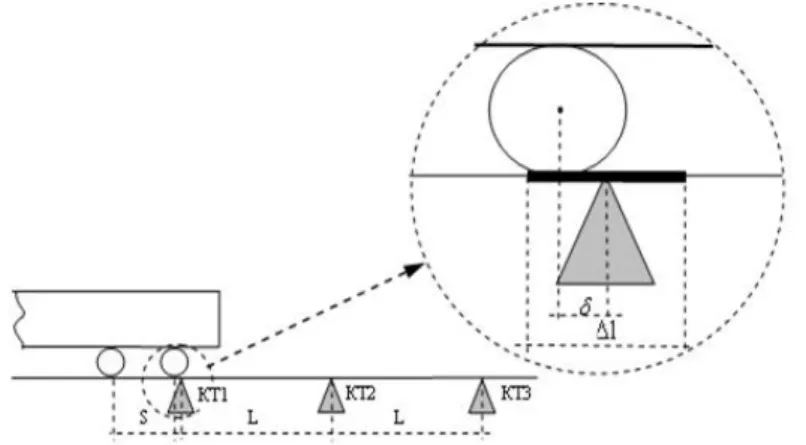
Definition of interaxle distance of the movable units used in various automated control systems at sorting yards and the adjacent railroad tracks. It is the most relevant to the tasks of determination the type of movable units, car base or cut, the axle counting systems, etc. Various methods of identifi-cation are applied, using special control sections, which includes the point path-control transducer, track circuits, photocells and other trackside assets used at the railway transport. In this paper, a meth-od for determining the type of the movable units according to the calculated interaxle distances is considered. This method uses a control section which consists of three control points (point path-control transducer). The error of determining the interaxle distance arising from the use of such methods are associated with the mismatch moment of actuation of the track point detector with the passage of car wheels over the geometric center of the detector. This mismatch in the operation of the detector is taken as a random variable, distributed according to the normal law (Fig. 1).
The values taken in figure 1: δ – error of the detector, ∆L – the operating range of the detector, S – the interaxle distance of the movable unit, L – the distance between the control points CP1, CP2, CP3 which include one or two coupled track point detectors.
doi: 10.15802/stp2015/56998 © O. Y. Yehorov, 2015 To study the effect of various factors affecting
the identification process the simulation was cho-sen. The description of the simulation model is represented in the work [6]. It was suggested that the following factors affected the error of identifi-cation the most significantly:
− the initial speed of the wheel pair run over on the control section
− the acceleration of motion at the control section;
− the distance between the detectors; − the value of the interaxle distance;
− accuracy of the point path-control trans-ducer work (root mean square of the distance of the fixing wheel of movable unit by the normal law of distribution from the detector center, distributed by the normal law of distribution [15]).
The researches have shown that the speed and acceleration of flexible unit movement not have effect on the error of the interaxle distance deter-mination in compared with other factors signifi-cantly.
The application of the experiment planning
method. The obtained results with using the
simu-lation model provide an opportunity to analyze quantitatively and qualitatively the possible errors of movable units identification, as well as their dependence on a number of factors affecting the identification process. However, this research does not allow calculating an expected error of identifi-cation definitely. To complete the task the method of experiment planning was chosen. Using this method, it is necessary to define the formula using of which is possible to determine the expected er-ror for selected control section, means of railway automatics and identifiable rolling stock unambi-guously.
All subsequent calculations in this chapter were carried out according to the method of experiment planning which was presented in the works [5, 13].
The control section on which was the determi-nation of interaxle distance of the movable units was chosen as the object of research. The factors influencing on this process and described above were selected as the effects on the process, namely:
− the initial speed of the wheel pair run over on the control section, namely the first control point CP1 (Vi);
− the acceleration of motion at the control section (a);
− distance between the detectors (L); − the value of the measured interaxle dis-tance (S);
− precision of point path-control transducer work (σt).
In this case the response is taken as the value of the average quadratic deviation the error of deter-mining the interaxle distance σ∆S.
In result the chosen research object is described with five influences and one response, the study of which is our task. The resulting model of the ex-periment corresponds to a multifactorial experi-ment with one response.
In the initial experiment was consisted of five factors. The plan FFE 25 (five-factor two-level full factorial experiment) was used. The following val-ues of the factors were taken as levels:
− initial speed Vi – 3 and 15 m/s; − acceleration a – 0.1 and 0.5 m/s2;
− distance between the detectors L – 3 and 6 m;
− the value of the measured interaxle dis-tance S – 2 and 14 m;
− the accuracy of point path-control trans-ducers σt – 0.002 and 0.01 m.
The following results were obtained at process-ing the conducted experiments:
− the above mentioned factor levels of the simulation model did not meet the requirements of uniformity and adequacy;
− to achieve uniformity and adequacy of the model is possible only if reduce the intervals of variation of factor levels, which in turn is unac-ceptable for the description of the identification process;
− the values of speed and acceleration were not significant in compared with other factors as it was in the analysis of simulation results, and at processing the results of applying the method of experiment planning.
It was decided to conduct a multi-level three-factor experiment after analyzing the results of the previous experiment. The following independent variables were selected as factors:
− distance between the detectors L;
− the value of the measured interaxle dis-tance S;
The variation of the factors was made as fol-lows: the distance between the detectors was var-ied at two levels (range 3-6 m), the levels values – 3 and 6; the accuracy of the detector work on three levels (range 0,001–0,008 m), the levels values 0,002, 0,004 and 0.006; interaxle distance at four levels (range 1.5–15 m), the levels values 2, 5, 8 and 11. The levels values of interaxle distance factor were adopted according to the conducted analysis of cars and locomotives of 1 520 mm gauge [4, 12].
As it was noted above, the aim of the study is the analytical dependences obtaining the average quadratic deviation of the determination errors of the interaxle distance σ∆S as a function of three variables – L, S and σi. Preliminary analysis showed that this dependence cannot be described neither linear nor quadratic dependence. To deter-mine the required dependence the device of or-thogonal polynomials and planning of multi-level experiments was adopted.
Control points used to construct the system of orthogonal polynomials, will be varied with a con-stant step, therefore, the polynomials can be ob-tained using the recurrence formula [5]:
1( ) 1( ) ( )
r r
P+ X =P X P X⋅ −
(
2 2 2)
1
( 1) 4 (4 1) r ( )
r N r P− X
− ⋅ − ⋅ ⋅ − ⋅ , (1)
where X – some of the physical independent vari-able or factor; N – number of experimental points; r – degree of the corresponding polyno-mial, r= −1,0,1,...,N−1.
In our case, the maximum degree of used poly-nomials is equal to 3. Therefore, the polypoly-nomials will be calculated by the following formulas:
0( ) 1
P X = , (2)
1( ) 1
P X = λ ⋅ −X X d, (3)
2 2
2 2
1 ( )
12
X X N
P X
d
⎡⎛ − ⎞ − ⎤
⎢ ⎥
= λ ⋅ ⎜ ⎟ −
⎢⎝ ⎠ ⎥
⎣ ⎦
, (4)
3( ) 3
P X = λ ×
3 2
3 7
20
X X X X N
d d ⎡⎛ − ⎞ ⎛ − ⎞ ⎛ ⋅ − ⎞⎤ ⎢ ⎥ × ⎜ ⎟ −⎜ ⎟ ⎜⋅ ⎟ ⎢⎝ ⎠ ⎝ ⎠ ⎝ ⎠⎥ ⎣ ⎦
, (5)
where λr – the multipliers, which depend on the number of variation levels N and the degree of polynomial r; X – average value of factor; d – the step of varying.
It is necessary to make the transition from the physical to the coded variables by the formulas for the more compact forms of the orthogonal poly-nomials:
u u
x =X −X d (6)
when N – odd number,
/ 2
u u
x =X −X d (7)
when N – even number.
In result the values of the polynomials for each of the variables will be as follows:
− variable L ranges at two levels, it will fit to a single polynomial of the first degree:
1 1
1 1 1
1
( ) X X
P X
d
− = λ ⋅ =
1 1 1 2 L 4.5 3 x P x( )
= ⋅ − = = {-1, 1}; (8)
− variable σt, ranges at three levels, it will correspond to the polynomials of the first and sec-ond degree:
2 2
1 2 2 2 1 2
2 0.004 ( ) ( ) 0.002 t X X
P X x P x
d
σ − −
= λ ⋅ = = = ,
2
2( 2) 3 2 2 2( )2
P X = ⋅x − =P x {-1,0,1}; (9)
− variable S ranges at four levels, it will cor-respond to the polynomials of the first, second and third degree:
3 3
1 3 3 3 1 3
3
6.5
( ) 2 ( )
3
X X S
P X x P x
d
− −
= λ ⋅ = ⋅ = = ,
2
2 3 3 2 3
1 5
( ) ( )
4 4
P X = ⋅x − =P x ,
3
3 3 3 3 3 3
5 41
( ) ( )
12 12
P X = ⋅x − ⋅x =P x {-3,-1,1,3}. (10)
doi: 10.15802/stp2015/56998 © O. Y. Yehorov, 2015 includes 24 control points, and therefore the same
number of coefficients. Numbers of experimental points u, plan and results of the received response are presented in the table. The 5 parallel experi-ments were conducted for each selection.
The row mean values and dispersion were computed using the formulas:
1
n
ui u
i
y y n
=
=
∑
, (11)2
2 2
1
1 n
u ui u
i
S y n y n
=
=
∑
− ⋅ − , (12)where n – the number of parallel experiments; yui – the value of i-th response for u-th selection
The Cochran criterion was chosen for the checking of row dispersions uniformity. According to this criterion, the coefficient Gcf =0,192 (for n=5 and N=24) was obtained from the Cochran distribution for the significance level of α=0,05. The Cochran criterion for conducted experiments was obtained by the formula
2 2
max 1
N
p u u
u
G S S
=
=
∑
. (13)The value of the Gp is equal to 0,165 that is less than the value Gcf, and then the uniformity of the row dispersions estimates is evident.
The values of b-coefficients were calculated according to the formula
2
1 1
( ) ( )
N N
i i u u i u
u u
b P x y P x
= =
=
∑
⋅∑
. (14)The obtained values of b-coefficients were in-cluded in the resulting table of calculations. In the resulting table the columns of only those model members were taken into account, b-coefficients of which were statistically significant. The statistical significance of the b-coefficients was tested by the formula
i cr bi table
b ≤b =S ⋅t =
2 2 1 1 1 ( 1) N n uj u u j table
y n y
N n t N n − = ⎛ ⎞ − ⋅ ⎜ ⎟ ⎜ ⎟ ⋅ − ⎝ ⎠ = ⋅ ⋅
∑ ∑
. (15)The coefficient ttable = 2.06 was taken from the tables of the Student distribution on significance level α = 0,05 the number of freedom degrees is equal to 24. The next step is to test the adequacy of the model, which was performed by F-criteria. According to this criterion the critical value
cr
F =1,94, taken from tables of F distribution for significance level α=0,05 and number of degrees of freedom fad=8 and fy=96, must be less than the calculated Fcalc calculated by formulasе
(
)
2 2 1 N u u u calc yn y y
F S N l = ⋅ − = −
∑
, (16)where yu – the value of the response at the point; l – the number of significant b-coefficients.
The value of Fcalc appeared to be equal to 0.49, which is less than Fcr, and it shows the adequacy of the model.
As a result of the experiments and processing the data, it became possible to write the adequate equation models
0,00966 0,00425 11 0,00496 12 u
y= = − ⋅P + ⋅P +
0,00227+ ⋅P13 0,00265+ ⋅P23 0,00024+ ⋅P33−
0,00228 11 12 0,00227P P P11 13P
− ⋅ ⋅ − ⋅ ⋅ −
0,00293 11P P23 0,00016 11 33P P
− ⋅ ⋅ − ⋅ ⋅ +
0,00123 12 13 0,00152 12+ ⋅P ⋅P + ⋅P ⋅P23+
0,00018 12P P33 0,00124 11 12 13P P P
+ ⋅ ⋅ − ⋅ ⋅ ⋅ −
0,0016 11 12P P P23
− ⋅ ⋅ ⋅ −
0,00013 11 12 13.P P P
− ⋅ ⋅ ⋅ (17)
It is necessary to move from coded variables to their physical variables to obtain the required ana-lytical dependences. Finally the required equation will be as follows:
2
( , , ) 0,0593 0,0054
S S L t L S t
∆
σ σ = − ⋅ ⋅ ⋅ σ − −
3 0,0000132 L S
− ⋅ ⋅ +
2
0,000277 L S 0,6181 L t
+ ⋅ ⋅ − ⋅ ⋅ σ +
3 2
0,00004 S 0,1344 S t 1,5811 t S
3
0,0111 S t 0,4659 t
+ ⋅ ⋅ σ + ⋅ σ ×
0,0015
L S L S
× ⋅ − ⋅ ⋅ +
0,00548 S 0,00151
+ ⋅ + ×
2
0,001 3,4956 t.
L S
× − ⋅ + ⋅ σ (18)
Findings
In the result of research and calculations the analytically valid values computation of the errors of the inteaxle distances of the movable units de-pending on the parameters of the control section, means of railway automatics and object identifica-tion became possible.
Originality and practical value
In the work the estimation mechanism of the possible errors of determination the center distance of the movable units was improved. That can im-prove the accuracy of identifying methods work, using the control section with defined point path-control transducer. Using the previously conducted studies of factors influencing on the errors of de-termining the interaxle distances of the movable units and developed simulation model to calculate the interaxle distance, the functional dependence of the error of the inteaxle distances from the error of the fixing point with the wheel point path-control transducer, the distances between the detectors and the measured distance was derived.
This functional dependence allows solving the following tasks: to calculate the maximum possible errors of determining the interaxle distance of the movable units at known parameters of control sec-tion and the parameters computasec-tions of the con-trol section, at the possible acceptable errors of determining the inteaxle distance of movable units.
Conclusions
Results processing of the simulation process of determining the interaxle distance of the movable units on the control section allow drawing the fol-lowing conclusions:
− values of speed and acceleration motion of the movable units are not essential for the identifi-cation process in comparison with other factors;
− the errors increase of the detector work leads to the error increasing in determining the in-teraxle distance;
− the increase of the measured interaxle dis-tance increases the value of the identification error;
− increasing of the control section length leads to a reduction of the identification error.
Applying the method of experiment planning the analytical dependence of the interaxle distance error determination was obtained as a function of the following quantities:
− distance between the detectors L;
− the value of the measured interaxle dis-tances S;
− precision of the point path-control trans-ducer σt.
These recommendations are relevant for build-ing the various information systems which are used as the input data of the movable units characteris-tics, received using the measuring on the control sections with applying the point path-control trans-duce.
LIST OF REFERENCE LINKS
1. А. с. № 1799774, МКИ5 B 61 L 1/16. Устройст
-водлявычисленияданныхдляидентификации поездоввдвижении / В. А. Захаров, С. П. Кол
-чук – № 4937555/11 ; заявл. 06.02.91 ; опубл. 07.03.93, Бюл. № 9. – 6 с.
2. А. с. № 1168458 СССР, МКИ4 B 61 L 1/16.
Устройство для определения длины вагонов /
Ю. Г. Боровков, А. М. Дудниченко, А. Н. Пе
-ров, И. Н. Перов (СССР). – № 3678439/27–11 ;
заявл. 26.12.83 ; опубл. 23.07.85, Бюл. № 27. – 4 с.
3. А. с. № 1682228, МКИ5 B 61 L 1/16. Устройст
-водляопределениядлиныотцеповнасортиро
-вочнойгорке / О. С. Попов, А. М. Долаберидзе,
В. П. Унтилов, В. А. Воронько, В. Н. Котеле
-вец, В. И. Яценко. – № 4428794/11 ; заявл. 05.04.88 ; опубл. 07.10.91, Бюл. № 37. – 5 с. 4. Грузовыевагоны колеи 1520 ммжелезныхдо
-рог СССР : альбом. – Москва : Транспорт, 1989. – 173 с.
5. Егоров, А. Е. Исследованиеустройствисистем автоматикиметодомпланированияэкспериме
-нта / А. Е. Егоров, Г. Н. Азаров, А. В. Коваль. –
Харків : Вищашк., 1986. – 240 с.
6. Егоров, О. И. Исследованиепогрешностиопре
-деления типа подвижных единиц на железно
-дорожномтранспорте / О. И. Егоров // Зб. наук.
пр. / Київ. ун-текономікиітехнологійтрансп. – Київ, 2003. – Вип. 4. – С. 36–41.
7. Жуковицкий, И. В. Автоматизированнаяиден
-тификация подвижных единиц и поезда в це
-doi: 10.15802/stp2015/56998 © O. Y. Yehorov, 2015 форм.-керуючі системи на залізн. трансп. –
2012. – № 6. – С. 77–82.
8. Информационно-коммуникационные техноло
-гиивуправлении : монография / А. А. Косола
-пов, А. В. Кувшинов, А. П. Нырков [и др.]. –
Одесса : КуприенкоСВ, 2015. – 245 c.
9. Ключеваяроль транспортавсовременном ми
-ре : монография / А. А. Косолапов, А. Л. Бло
-хин, К. Ф. Боряк [идр.]. – Одесса : Куприенко СВ, 2013. – 163 с.
10. Марценюк, Л. В. Совершенствованиепроцесса грузовых перевозок и механизма управления ими / Л. В. Марценюк, А. В. Вишнякова // Нау
-ка та прогрес трансп. Вісн. Дніпропетр. нац.
ун-ту залізн. трансп. – 2014. – № 2 (50). –
С. 41–48. doi: 10.15802/stp2014/23743.
11. Музыкин, М. И. Влияние «окон» на пропуск
-нуюспособность железнодорожногонаправле
-ния / М. И. Музыкин, Г. И. Нестеренко // Наука тапрогрестрансп. Вісн. Дніпропетр. нац. ун-ту залізн. трансп. – 2014. – № 3 (51). – С. 24–33. doi: 10.15802/stp2014/25797.
12. Раков, В. А. Локомотивы и моторвагонный подвижнойсоставжелезныхдорог Советского Союза (1976-1985) / В. А. Раков. – Москва :
Транспорт, 1990. – 238 с.
13. Харнтман, К. Планирование эксперимента
в исследовании технологических процессов /
К. Хартман, Э. Лецкий, В. Шефер. – Москва :
Мир, 1977. – 552 с.
14. Шамашов, М. А. Программно-аппаратный из
-меритель скорости и межосевых расстояний,
счетчиквагоновиосей / М. А. Шамашов // Ав
-томатика, телемеханикаисвязь. – 1994. – № 8. – С. 9–10.
15. Штанке, А. Э. Исследованиеи выборпутевых датчиков всистемедиспетчерского контроля /
А. Э. Штанке, И. Г. Красовская // Совершенст
-вование устройств ж.-д. автоматики и телеме
-ханики : межвуз. сб. науч. ст. – Свердловск, 1973. – Вып. 34. – С. 59–66.
16. Research on automatic adjustment of the
phase plan in railway marshalling / L. Ma, J. Guo,
G. W. Chen5*XR // J. of Transportation
Engineering and Information. – 2013. – Vol. 11,
№ 3. – P. 18–28.
17. Wagon-flow allocation optimization of stage plan at marshaling station in consideration of different size limitations of departure trains / H.-D. Li, S.-W. He, Y. Jing, S. Wang // J. of the China
Railway Society. – 2012. – Vol. 34, № 7. –
P. 10–17.
О
.
Й
.
ЄГОРОВ
1*1*Каф. «Електронніобчислювальнімашини», Дніпропетровськийнаціональнийуніверситетзалізничного
транспортуіменіакадемікаВ. Лазаряна, вул. Лазаряна, 2, Дніпропетровськ, Україна, 49010, тел. +38 (056) 373 15 89, ел. пошта [email protected], ORCID 0000-0002-8260-9463
ВИКОРИСТАННЯ
МЕТОДУ
ПЛАНУВАННЯ
ЕКСПЕРИМЕНТУ
ДЛЯ
ОЦІНКИ
ТОЧНОСТІ
ІДЕНТИФІКАЦІЇ
РУХОМИХ
ОДИНИЦЬ
Мета. Ідентифікаціярухомогоскладуназалізницях, якпоїздівуцілому, таківагонівокремо, займаєне
-від’ємнучастинубагатьохсистемавтоматизації. Різніінформаційно-керуючісистеминасортувальнихстан
-ціях, виконуючитехнологічні операції, потребують оперативноїінформації прооб'єктиуправління. Підви
-щенняточностівизначеннярізнихпараметрів, щохарактеризуютьрухомийсклад, призводитьдобезпосере
-дньогополіпшенняякостіуправління вагонопотоками. Метароботиполягаєврозробціспособуоцінкипо
-милки визначення міжосьових відстаней рухомих одиниць на контрольній ділянці з використанням точковихколійнихдатчиківдляпроведенняподальшоїідентифікаціївагонівталокомотивів. Методика. Для досягненняпоставленоїметибуливикористаніімітаційнемоделюваннятаметодплануванняексперименту.
Буларозроблена імітаційна модель, щодозволяє визначати тимчасовіінтервали міжнаїздом колісних пар рухомиходиницьнаточковіколійнідатчики, розташованінаконтрольній ділянцізварійованимихаракте
-ристикамипристроївідентифікації. Отриманізвикористаннямімітаційноїмоделізначеннячасовихінтерва
-лівбулизастосованівметодіплануванняекспериментудлядосягненнякінцевоїмети. Результати. Обчис
-лені аналітичнозначення похибоквизначенняміжосьових відстаней не маютьзначущих відмінностей від значень, отриманих ізвикористаннямімітаційноїмоделі. Цевповніймірідозволяє використовуватиотри
-мануфункціональнузалежність для оцінки можливих похибок ідентифікації рухомогоскладу. Результати даноїроботиможутьбутивикористаніякдляідентифікаціїокремихрухомиходиниць, такідлявсьогопоїз
-дав цілому. Науковановизна. Використовуючи попередньо проведенідослідженняфакторів, щовплива
-вихвідстанейвідпомилкифіксаціїколесаточковимколійнимдатчиком, відстаніміждатчикамитавимірю
-ваної відстані. Практична значимість. Дана функціональна залежність дозволяє вирішити наступні за
-вдання: обчислення гранично можливих помилок визначення міжосьовихвідстаней рухомих одиниць при відомихпараметрахконтрольної ділянкита обчисленняпараметрів контрольноїділянки привідомих мож
-ливодопустимихпомилкахвизначенняміжосьовихвідстанейрухомиходиниць.
Ключові слова: метод планування експерименту; ідентифікація рухомого складу; контрольна ділянка;
міжосьовівідстані; точковийколійнийдатчик
О
.
И
.
ЕГОРОВ
1*1*Каф. «Электронныевычислительныемашины», Днепропетровскийнациональныйуниверситет
железнодорожноготранспортаимениакадемикаВ. Лазаряна, ул. Лазаряна, 2, Днепропетровск, Украина, 49010, тел. +38 (056) 373 15 89, эл. почта [email protected], ORCID 0000-0002-8260-9463
ИСПОЛЬЗОВАНИЕ
МЕТОДА
ПЛАНИРОВАНИЯ
ЭКСПЕРИМЕНТА
ДЛЯ
ОЦЕНКИ
ТОЧНОСТИ
ИДЕНТИФИКАЦИИ
ПОДВИЖНЫХ
ЕДИНИЦ
Цель. Идентификация подвижного состава на железных дорогах, как поездов в целом, таки вагонов
в отдельности, занимает неотъемлемую часть многих систем автоматизации. Различные информационно
-управляющиесистемынасортировочныхстанциях, выполняятехнологическиеоперации, нуждаютсявопе
-ративнойинформацииоб объектахуправления. Повышениеточности определения различныхпараметров,
характеризующихподвижнойсостав, приводиткнепосредственномуулучшениюкачествауправленияваго
-нопотоками. Цельработы заключаетсяв разработкеспособаоценки ошибки определения межосевыхрас
-стоянийподвижныхединицнаконтрольномучасткесиспользованиемточечныхпутевыхдатчиковдляпро
-ведения последующей идентификации вагонов и локомотивов. Методика. Для достижения поставленной целибылииспользованыимитационноемоделированиеиметодпланированияэксперимента. Быларазрабо
-танаимитационная модель, позволяющая определять временные интервалы междунаездом колесных пар подвижныхединицнаточечныепутевыедатчики, расположенныенаконтрольномучасткесварьируемыми характеристикамиустройств идентификации. Полученные сиспользованием имитационноймоделизначе
-ниявременных интерваловбыли применены в методепланирования экспериментадля достиженияконеч
-ной цели. Результаты. Вычисленные аналитически значения погрешностей определения межосевых рас
-стояний неимеют значимых отличий от значений, полученных с использованием имитационной модели.
Это в полной мере позволяет использовать полученную функциональную зависимость для оценки
возможных погрешностей идентификации подвижного состава. Результаты данной работы могут быть
использованы как для идентификации отдельных подвижных единиц, так и для всего поезда в целом.
Научнаяновизна. Используяпредварительнопроведенныеисследованияфакторов, влияющихнапогреш
-ностьопределениямежосевыхрасстоянийподвижныхединиц, иразработаннуюимитационнуюмодельдля вычислениямежосевыхрасстояний, былавыведенафункциональнаязависимостьпогрешностиопределения межосевыхрасстоянийотошибкификсацииколесаточечнымпутевымдатчиком, расстояниямеждудатчи
-камииизмеряемогорасстояния. Практическаязначимость. Даннаяфункциональнаязависимостьпозволя
-етрешитьследующиезадачи: вычислениепредельновозможныхошибок определениямежосевыхрасстоя
-ний подвижных единиц при известных параметрах контрольного участка и вычисление параметров кон
-трольногоучастка, приизвестныхвозможнодопустимыхошибкахопределениямежосевыхрасстоянийпод
-вижныхединиц.
Ключевыеслова: методпланированияэксперимента; идентификацияподвижногосостава; контрольный
участок; межосевыерасстояния; точечныйпутевойдатчик
REFERENCES
1. Zakharov V.A., Kolchuk S.P. Ustroystvo dlya vychisleniya dannykh dlya identifikatsii poyezdov v dvizhenii
[The device for calculation the data for the identification of trains in motion], no. 4937555/11. 1993.
doi: 10.15802/stp2015/56998 © O. Y. Yehorov, 2015
3. Popov O.S., Dolaberidze A.M., Untilov V.P., Voronko V.A., Kotelevets V.N., Yatsenko V.I. Ustroystvo dlya opredeleniya dliny ottsepov na sortirovochnoy gorke [A device for determining the length of cuts on the sorting yard], no.4428794/11.1991.
4. Gruzovyye vagony kolei 1520 mm zheleznykh dorog SSSR: albom [Freight cars of 1520 mm gauge of the USSR railways: the album]. Moscow, Transport Publ., 1989. 173 p.
5. Yegorov A.Ye., Azarov G.N., Koval A.V. Issledovaniye ustroystv i sistem avtomatiki metodom planirovaniya eksperimenta [Study of devices and systems of automation by means of experiment planning]. Kharkiv, Vyshcha shkola Publ., 1986. 240 p.
6. Yegorov O.I. Issledovaniye pogreshnosti opredeleniya tipa podvizhnykh edinits na zheleznodorozhnom
transporte [Research of the error to determine the type of flexible units for railway transport]. Zbirnyk naukovykh prats Kyivskoho universytetu ekonomiky i tekhnolohii transport [Proc. of Kyiv University of Economy and Transport Technologies]. Kyiv, 2003, vol. 4, pp. 36-41.
7. Zhukovitskiy I.V., Yegorov O.I. Avtomatizirovannaya identifikatsiya podvizhnykh edinits i poyezda v tselom [Automated identification of flexible units and trains in general]. Informatsiino-keruiuchi systemy na zaliznychnomu transporti – Information Management Systems in Railway Transport, 2012, no. 6, pp. 77-82. 8. Kosolapov A.A., Kuvshinov A.V., Nyrkov A.P. Informatsionno-kommunikatsionnyye tekhnologii v upravlenii
[Information and communication technology in management]. Odessa, Kupriyenko SV Publ., 2015. 245 p. 9. Kosolapov A.A., Blokhin A.L., Boryak K.F. Klyuchevaya rol transporta v sovremennom mire [The key role of
transport in the modern world]. Odessa, Kuprienko SV Publ., 2013. 163 p.
10. Martsenyuk L.V., Vishnyakova A.V. Sovershenstvovaniye protsessa gruzovykh perevozok i mekhanizma
upravleniya imi [Improvement of freight transportation process and their management mechanism]. Nauka ta prohres transportu. Visnyk Dnipropetrovskoho natsionalnoho universytetu zaliznychnoho transportu – Science and Transport Progress. Bulletin of Dnipropetrovsk National University of Railway Transport, 2014, no. 2 (50), pp. 41-48. doi: 10.15802/stp2014/23743.
11. Muzykin M.I., Nesterenko G.I. Vliyaniye «okon» na propusknuyu sposobnost zheleznodorozhnogo
napravleniya [Influence of maintenance windows on the working capacity of railway route]. Nauka ta prohres transportu. Visnyk Dnipropetrovskoho natsionalnoho universytetu zaliznychnoho transportu – Science and Transport Progress. Bulletin of Dnipropetrovsk National University of Railway Transport, 2014, no. 3 (51), pp. 24-33. doi: 10.15802/stp2014/25797.
12. Rakov V.A. Lokomotivy i motorvagonnyy podvizhnoy sostav zheleznykh dorog Sovetskogo Soyuza
(1976-1985) [The locomotive and railcar rolling stock of the Soviet Union railways (1976-1985)]. Moscow, Transport Publ., 1990. 238 p.
13. Khartman K., Letskiy E., Shefer V. Planirovaniye eksperimenta v issledovanii tekhnologicheskikh protsessov
[Planning of experiment in investigation of technological processes]. Moscow, Mir Publ., 1977. 552 p.
14. Shamashov M.A. Programmno-apparatnyy izmeritel skorosti i mezhosevykh rasstoyaniy, schetchik vagonov i osey [Hardware-software measuring device of the velocity and interaxle distances, the count of cars and axles]. Avtomatika, telemekhanika i svyaz – Automation, Telemechanics and Communications, 1994, no. 8, pp. 9-10.
15. Shtanke A.E., Krasovskaya I.G. Issledovaniye i vybor putevykh datchikov v sisteme dispetcherskogo
kontrolya [Research and selection of the travel sensors in the system of dispatcher control].
Sovershenstvovaniye ustroystv zheleznodorozhnoy avtomatiki i telemekhaniki [The improvement of devices of railway automatics and telemechanics]. Sverdlovsk, 1973, vol. 34, pp. 59-66.
16. Ma L., Guo J., Chen G.W.*XR5 Research on automatic adjustment of the phase plan in railway marshaling. Journal of Transportation Engineering and Information, 2013, vol. 11, no. 3, pp. 18-28.
17. Li H.-D., He S.-W., Jing Y., Wang S. Wagon-flow allocation optimization of stage plan at marshaling station in consideration of different size limitations of departure trains. Journal of the China Railway Society, 2012, vol. 34, no. 7, pp. 10-17.
Prof. I. V. Zhukovitskiy, D. Sc. (Tech.) (Ukraine); Prof. V. V. Tkachev, D. Sc. (Tech.) (Ukraine) recommended this article to be published