Stephan Kaleske
SAP
®PART I Introduction to SAP Query ... 23
1 Introduction to SAP ERP Reporting ... 25
2 Overview of SAP Tables and Table Links ... 53
3 QuickViewer ... 77
4 Overview of SAP Query ... 93
5 Query Utilities ... 115
PART II SAP Query Functions ... 137
6 InfoSet in Detail ... 139
7 SAP Query in Detail ... 165
8 Selection and Layout Variants ... 191
9 Traffic Light Icons, Drilldown, Graphics, and ABC Analyses ... 205
PART III Designing User-Friendly Reports ... 223
10 Summarized Data Output with Statistics and Ranked Lists ... 225
11 ABAP Fundamentals in the InfoSet ... 249
12 Integration with Microsoft Excel ... 279
PART IV Query Management ... 291
13 Transport System ... 293
14 Data Retrieval and Function Modules ... 303
15 Authorizations and Transaction Creation ... 331
PART V Real-Life Examples ... 345
16 Real-Life Examples ... 347 Appendices
Contents
Preface ... 13
Introduction ... 17
PART I Introduction to SAP Query 1 Introduction to SAP ERP Reporting ... 25
1.1 ABAP Report Generators ... 26
1.2 Query Reporting Tools ... 28
1.3 Comparing Analysis Tools: SAP Query and SAP NetWeaver BW ... 33
1.4 Cumulated Analyses with Multilevel Hierarchies ... 34
1.4.1 Summarization Hierarchies ... 35
1.4.2 Report Painter ... 36
1.4.3 Drilldown Reporting ... 40
1.5 Using Standard Reports ... 44
1.5.1 SAP Area Menus ... 44
1.5.2 Finding a Report in the SAP Menu ... 47
1.5.3 Searching the Menu for Standard Reports ... 49
1.5.4 Important Standard Transactions ... 50
1.6 Summary ... 52
2 Overview of SAP Tables and Table Links ... 53
2.1 Data Browser ... 53
2.2 Table Determination Options ... 58
2.2.1 F1 Help ... 58 2.2.2 Table Trace ... 64 2.2.3 Archiving Object ... 66 2.2.4 Where-Used List ... 68 2.3 Table Links ... 72 2.3.1 Customer Master ... 72 2.3.2 Sales Document ... 73 2.4 Summary ... 76
3 QuickViewer ... 77
3.1 QuickViewer Overview ... 77
3.2 Sample Data for Table TSTCT ... 78
3.3 QuickViewer Initial Screen ... 80
3.4 Steps for Creating a QuickViewer Report ... 82
3.4.1 Defining a QuickView Name and Description ... 82
3.4.2 Selecting a Data Source ... 84
3.4.3 Selecting Selection Fields and Layout Fields ... 85
3.5 Layout Mode ... 89
3.6 Summary ... 91
4 Overview of SAP Query ... 93
4.1 Fundamentals ... 94 4.2 Query Areas ... 96 4.3 User Group ... 99 4.4 InfoSet ... 103 4.5 SAP Query ... 109 4.6 Summary ... 114 5 Query Utilities ... 115
5.1 Overview of Query Utilities ... 116
5.2 Overview of Query Objects ... 119
5.3 Query Objects ... 121
5.3.1 Overview of User Groups ... 121
5.3.2 Query Overview ... 123
5.3.3 Directory Lists ... 123
5.4 Calling Query Object Descriptions ... 124
5.4.1 User Group Description ... 124
5.4.2 InfoSet Description ... 125
5.4.3 Query Description ... 128
5.5 Editing Functions for Query Objects ... 130
5.5.1 Copy Function ... 131
5.5.2 Trash Folder ... 133
5.5.3 Query Transport ... 134
Contents
PART II SAP Query Functions
6 InfoSet in Detail ... 139
6.1 Data Sources ... 141
6.2 Automatic Text Recognition ... 143
6.3 Table Join ... 145
6.4 Field Groups ... 149
6.5 Individual Additional Fields ... 153
6.6 Selection ... 160
6.7 Summary ... 163
7 SAP Query in Detail ... 165
7.1 Fundamentals ... 165
7.2 Initial Screen ... 168
7.2.1 Changing User Group ... 168
7.2.2 Converting QuickView into a Query ... 169
7.2.3 Additional Functions on the Initial Screen ... 171
7.2.4 Additional Editing Options ... 174
7.3 Query Creation Screen ... 176
7.3.1 Query Title and Formatting ... 177
7.3.2 Output Format ... 179
7.4 Field Name ... 179
7.4.1 Changing the Column Header of Query Fields ... 181
7.4.2 Local Fields ... 182
7.4.3 Selection Fields ... 186
7.5 Basic List ... 187
7.6 Additional Functions ... 188
7.7 Summary ... 189
8 Selection and Layout Variants ... 191
8.1 Selection Screen ... 192
8.2 Selection Variants ... 198
8.3 Layout Variant ... 202
9 Traffic Light Icons, Drilldown, Graphics, and
ABC Analyses ... 205
9.1 Symbols ... 206
9.2 Icons ... 211
9.3 Drilldown Options ... 215
9.4 Using Graphics and the ABC Analysis ... 219
9.5 Summary ... 222
PART III Designing User-Friendly Reports 10 Summarized Data Output with Statistics and Ranked Lists ... 225
10.1 Example: Open Item List ... 226
10.2 Basic List Without a Graphical Query Painter ... 230
10.3 Statistics ... 239
10.4 Ranked List ... 246
10.5 Summary ... 248
11 ABAP Fundamentals in the InfoSet ... 249
11.1 ABAP Dictionary ... 249
11.2 Individual Data Objects in the InfoSet ... 254
11.2.1 Data Fields ... 255
11.2.2 System Fields ... 260
11.3 Helpful ABAP Code ... 262
11.3.1 Sample Code on the Editor Screen ... 262
11.3.2 IF Statement ... 265
11.3.3 SELECT Loop ... 268
11.3.4 SELECT SINGLE Statement ... 272
11.3.5 Other Helpful ABAP Commands ... 275
11.4 Using Your Own Code in the InfoSet ... 276
Contents
12 Integration with Microsoft Excel ... 279
12.1 Data Browser ... 279
12.2 Excel Inplace in SAP List Viewer ... 282
12.3 Microsoft Excel Integration for Other Query Output Formats ... 287
12.4 Summary ... 289
PART IV Query Management 13 Transport System ... 293
13.1 Transport Dataset ... 294
13.2 Transport Tool ... 295
13.2.1 Transport Tool in the Standard Area ... 295
13.2.2 Transport Tool in the Global Query Area ... 296
13.3 Transport Options ... 297
13.4 Additional SAP Notes ... 299
13.5 Summary ... 300
14 Data Retrieval and Function Modules ... 303
14.1 Secondary Index ... 304
14.2 Table View ... 307
14.3 Function Module ... 314
14.3.1 Function Module for Converting the Time Dimension in the InfoSet ... 314
14.3.2 Function Module for Displaying Texts ... 320
14.4 Summary ... 329
15 Authorizations and Transaction Creation ... 331
15.1 Transactions in the Query Environment ... 331
15.2 User Groups ... 333
15.3 Authorization Objects ... 333
15.3.1 Authorization Groups ... 335
15.4 Integrating Query Transactions into a User Role ... 337
15.5 Notes on Authorization Assignment ... 341
15.5.1 SAP Notes ... 342
15.5.2 Authorization Objects for Administrators and Developers ... 342
15.6 Summary ... 343
PART V Real-Life Examples 16 Real-Life Examples ... 347
16.1 Procedure When Creating Reports ... 347
16.1.1 Brainstorming Workshop ... 347
16.1.2 Specifying Reports ... 349
16.2 Sales Evaluation ... 351
16.3 Financial Accounting Analysis — Open Items ... 359
16.4 Production Planning — Measuring Productivity ... 366
16.5 Summary ... 376
Appendices ... 377
A Important SAP Tables ... 377
A.1 General ... 377
A.2 Sales and Distribution ... 378
A.3 Production ... 380
A.4 Materials Management ... 381
A.5 Financial Accounting and Controlling ... 384
B The Author ... 391
SAP Query is used to create analyses in real time without any great effort. Such analyses are used to optimize processes and master data, and to support corporate management. In your SAP ERP system, you can use the SAP Query functions without the need for any additional installations or license fees.
Introduction to SAP ERP Reporting
1
For enterprises, quickly and accurately accessing business information is vital. To this end, SAP provides an extensive portfolio of tools for report creation. The most important tools are as follows:
Query reporting tools E E Report Painter E E /Report Writer Drilldown Reporting E E
SAP NetWeaver Business Warehouse E
E (SAP NetWeaver BW)/SAP
Business Objects
The term query reporting tools comprises the following tools: SAP Query E E QuickViewer E E InfoSet Query E E
This chapter introduces you to SAP Query, Report Painter, and Drilldown Reporting, and distinguishes among these three tools and SAP NetWeaver BW. In addition, you will learn about frequently used standard SAP reports. After obtaining an overview of the basic requirements for report creation in Section 1.1, ABAP Report Generators, we will compare the three aforementioned query tools in Section 1.2, Query Reporting Tools. Here, you will learn when it is advisable to use the query reporting tools to query information directly in the SAP ERP system. In Section 1.3,
Comparing Analysis Tools: SAP Query and SAP NetWeaver BW, we will highlight the advantages of SAP Query over SAP NetWeaver BW. If you need reports with summarized figures (totals), which is often the case in Financial Accounting (FI), we recommend that you use the fol-lowing tools: Report Painter/Report Writer and Drilldown Reporting. In Section 1.4, Cumulated Analyses with Multilevel Hierarchies, you will see how SAP ERP is used in different enterprises with different business requirements. For the most important reporting requirements, which are often the same for many customers, a standard report is frequently available in SAP ERP. Before you create a new report, you should always check whether an existing report already covers your requirements (see Section 1.5, Using Standard Reports).
ABAP Report Generators
1.1
At the start of every report, there is a specific requirements specification. After the data basis has been clarified, the user decides how to format the data and answers the following questions:
What does the selection screen E
E look like?
Which field contents do you want to output? E
E
Which report jumps (drilldown) are useful? E
E
How do you want the data to be formatted? E
E
Output length, decimal places, unit E
E
Color display E
E
How do you want to summarize or display the data? E E Summation levels E E Excel display E E
For example, a developer can use an ABAP report to format the data. However, a good ABAP developer requires time to output structured data. He needs not only technical expertise but also business knowledge, in particular.
Because the business requirements of an enterprise are often challeng-ing, both detailed technical knowledge and industry knowledge are Analyzing
requirements
Business and technical expertise
ABAP Report Generators 1.1
essential. In addition to technical knowledge, a good consultant, key user, user, or developer must have some business knowledge to create the best analyses.
If you have a good level of technical knowledge, you must acquire the relevant business expertise. Because the analysis requirement is based on many years of real-life experiences, the question of simplified tech-nical analysis options arises. Is it always necessary to create an analysis program from scratch? Are there easy ways to create ABAP code? The goal is to generate a good report and to access a simple report generator, either to accelerate the implementation speed or simply due to a lack of programming knowledge. Table 1.1 provides an overview of the most important report generators for you.
Report Generator
Transaction Focus in Real Life
SAP Query SQ01 All SAP components
SAP NetWeaver BW
All SAP components
Report Painter FGRP EEFI: General ledger, special ledger CO: Overhead costs, product costs, E
E
Profit Center Accounting Drilldown
Reporting
FI: General ledger, customers, vendors, E
E
special ledger
CO: Product costs, Profitability Analy-E
E
sis, Profit Center Accounting TR: Cash Management, Treasury E
E
IM: Investment Management E
E
PS: Project System E
E
LIS EESD: Sales and Distribution, shipping,
billing
MM: Purchasing, inventory manage-E
E
ment, invoice verification QM: Quality Management E E PM: Plant Maintenance E E
PP: Production Planning and Control E
E
Overview of the Most Important Report Generators for You
Table 1.1
Simplified report creation via the report generator
SAP provides different utilities for creating ABAP code for an analysis. We already mentioned the most important reporting tools in the intro-duction, namely Report Painter/Report Writer, Drilldown Reporting, and SAP NetWeaver BW. The Logistics Information System (LIS) is another tool. The term query reporting tools is often used in different contexts, both in literature and in real life. Frequently, the term SAP query report-ing is also used to describe the SAP NetWeaver BW reportreport-ing tools. However, this book concerns only those query reporting tools within the SAP ERP system.
In the next section, we will explain which query reporting tools are avail-able to you.
Query Reporting Tools
1.2
This section provides a first impression of the functional scope of query reporting tools. We will compare the various options and application areas of SAP Query, InfoSet Query, and QuickViewer against each other and explain them in detail.
When we speak of query reporting tools, we mean the following three tools: SAP Query E E InfoSet Query E E QuickViewer E E
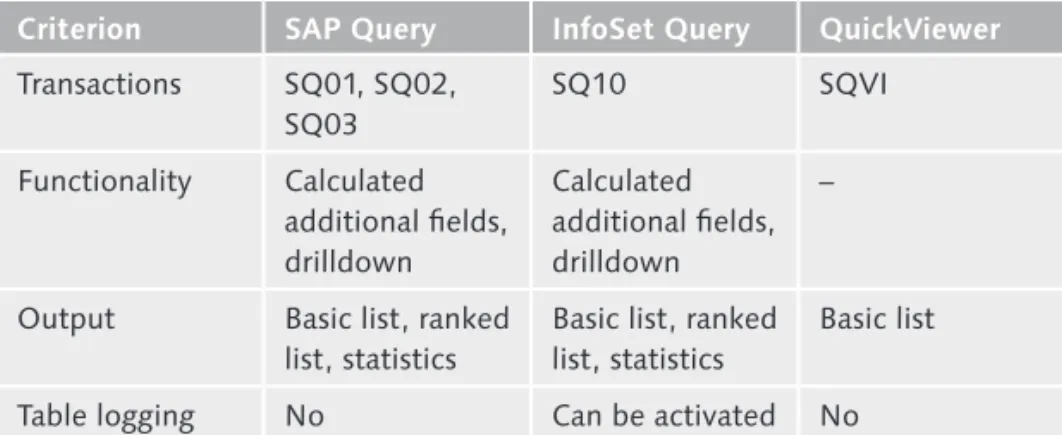
The order in which these tools are listed reflects their decreasing func-tional scope. QuickViewer is the easiest tool to use, but it provides the lowest functionality of all three query tools. An overview of the most important functions is provided in Table 1.2.
In Release 4.6, SAP renamed one of its query reporting tools to SAP Query. Prior to Release 4.6C, it was known as the ABAPQueryTool. In the SAP solution portfolio, this tool is still listed under the ABAP devel-opment tools because it was originally intended for developers who wanted an easier way to generate ABAP code.
The term “query reporting tools” Functions of query reporting tools Development of query reporting tools
Query Reporting Tools 1.2
Criterion SAP Query InfoSet Query QuickViewer Transactions SQ01, SQ02, SQ03 SQ10 SQVI Functionality Calculated additional fields, drilldown Calculated additional fields, drilldown –
Output Basic list, ranked list, statistics
Basic list, ranked list, statistics
Basic list
Table logging No Can be activated No
Differences Among the Query Reporting Tools
Table 1.2
To enable end users to create their own individual reports, InfoSet Query (initially intended for the Human Resources area) and QuickViewer (a particularly easy-to-use tool for occasional users) were developed in Release 4.6C. At the same time, the query tools were completely revised in terms of their performance and the way in which they create ABAP code. The user interface was also simplified.
In the course of this further development, SAP changed many terms. Table 1.3 provides an overview of these terminology changes.
Area Term Before Release 4.6 Term as of Release 4.6
Tool name ABAP Query SAP Query
Data pool Functional areas InfoSet
Structuring of data Functional groups Field groups
Output format ABAP List Viewer (ALV) SAP List Viewer (ALV) ABAP/SAP Query Terms According to Release
Table 1.3
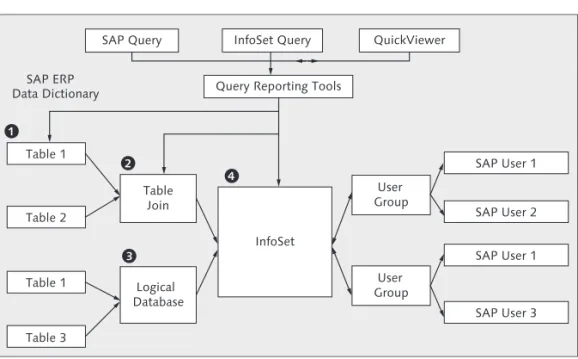
However, all three query reporting tools have the same purpose, namely to create ABAP code easily and thus generate individual analyses. You can use the following data sources as a data basis for these analyses (see Figure 1.1):
Individual database table E E Table join E E SAP release changes Terminology changes Data sources
Logical database E E InfoSet E E SAP ERP Data Dictionary Table 1 Table 2 Table 3 Table 1 Table Join Logical Database InfoSet User Group User Group SAP User 1 SAP User 2 SAP User 3 SAP User 1 SAP Query InfoSet Query QuickViewer
Query Reporting Tools
Relationships Between SAP Query Functions
Figure 1.1
In some cases, it is sufficient to query an individual database table (1). If
you have the necessary authorization, you can also use the Data Browser to query the database directly. However, if you want to easily limit access and have a user-friendly query, it may make sense to create a query. It may also be productive to query only one database table (if this table already contains most of the information you require) and to read addi-tional information in separate addiaddi-tional fields.
Due to its simplicity and high implementation speed, QuickViewer has proven successful for one-time ad hoc analyses. In comparison to query-ing the table directly in the database, you can use QuickViewer to query several tables that are linked via fields. If two or more tables are linked with each other, this is known as a table join (2).
Logical databases (3) contain information that has already been compiled
for the creator of the report. Logical databases are the basis for linking SAP tables with each other. Even though a query is easily possible, the Data source:
database table
Data source: table join
Query Reporting Tools 1.2
predefined data basis carries the risk of unnecessary data content being queried. Consequently, the simplified query is synonymous with lower performance.
An InfoSet (4) is, for the most part, comparable with a table join. In
QuickViewer, a transaction is the basis for defining the table join (data basis) and selecting the selection and layout fields. For SAP Query and InfoSet Query, a separate transaction is used to create the data basis as an InfoSet. An InfoSet can have a table, table join, or logical database as its data basis.
QuickViewer is frequently used in real life. A report can be created in just a few minutes, simply by using one transaction (SQVI) and knowing the database table(s). The newly created QuickViewer report is available locally but only to the creator of the report. If another user requires this report, it cannot be simply forwarded to the user. With SAP Query, however, it is possible to convert the new QuickViewer report into an SAP query. For detailed information about QuickViewer, see Chapter 3, QuickViewer.
Creating an SAP query is not much more difficult than generating a QuickViewer report. Even though three transactions are used to create a report, report creation is also easy here if you are familiar with the logic. The use of SAP Query is usually preferred over the use of QuickViewer or InfoSet Query because it not only provides more options but also demands a more structured working method.
SAP Query enables you to specifically format data for individual infor-mation objects. In real life, master data is frequently queried using SAP Query. Consequently, numerous analyses exist for the following master data objects, in particular:
Customers E E Vendors E E Materials E E Conditions E E Credit limit E E Work centers E E InfoSet Using QuickViewer
Using SAP Query
Master data reports
General ledger accounts E E Fixed assets E E
These analyses enable the user to analyze his data individually. In real life, data displayed in an ALV layout or in Microsoft Excel is often received very positively. Because reports are individual, you can easily recognize duplicates or incorrect field content. You can then double-click the report to correct or adjust the data content directly.
With SAP Query, you can also select transaction data according to spe-cific criteria. The status or document flow for orders is queried in this way, and you can specifically optimize the business process on this basis. For example, you can analyze the associated delivery or billing status for a sales order. If the actual status differs from the target status, the rel-evant departments, customers, or vendors can be informed in good time and specific measures can be taken. In particular, icons (e.g., a red traffic light) are used to highlight critical statuses. The following data objects, in particular, are analyzed in real life:
Sales orders E E Deliveries E E Billing documents E E Purchase orders E E Production orders E E Open items E E
Many enterprises also use SAP Query for corporate management. Many customers require analyses for incoming orders or sales, for example. In addition, many enterprises create stock analyses or target production quantity analyses to display fact-based enterprise results.
If you have large datasets and complex cross-module analyses, you soon reach the limitations of SAP Query. However, the use of SAP NetWeaver BW is undisputed in such cases. Be that as it may, not all (small and medium-sized) enterprises use a SAP NetWeaver BW system, or they only use some aspects of SAP NetWeaver BW. In the next section, we will discuss the criteria for and against SAP Query (when compared with SAP NetWeaver BW). Displaying data in an ALV layout or in Excel Transaction data reports Corporate management Distinguishing between SAP Query and SAP NetWeaver BW
Comparing Analysis Tools: SAP Query and SAP NetWeaver BW 1.3
Comparing Analysis Tools:
1.3
SAP Query and SAP NetWeaver BW
If your enterprise has sufficient resources (time, money, and technical expertise), we recommend using SAP NetWeaver BW or SAP Business-Objects alongside SAP Query. Examples of SAP Business Business-Objects products include Crystal Reports (formatted reporting), Xcelsius Enterprise (dash-boarding), and Web Intelligence (ad hoc analysis).
Table 1.4 compares and contrasts the most important distinguishing characteristics between SAP Query and SAP NetWeaver BW, especially in terms of the resources used.
Criterion SAP Query SAP NetWeaver BW
License fees, interfaces, maintenance, and hardware
Part of the SAP ERP license
Additional license fees frequently necessary (especially if you also want to use SAP Business Objects)
Installation Can be used
immediately
Additional installation and hardware frequently necessary System configuration Query transactions
immediately available
Must be configured independently Individual real-time
analysis
Access to live data with drilldown in real time
Data usually updated in an overnight job Comparing Analysis Tools: SAP Query and SAP NetWeaver BW
Table 1.4
In terms of resource usage, there are many advantages to using the SAP Query reporting tools:
In contrast to SAP NetWeaver BW/SAP Business Objects, you can use E
E
SAP Query without needing to procure additional licenses.
Because report creation via SAP Query occurs directly in the SAP ERP E
E
system, no additional maintenance is necessary.
Required resources
Advantages of query reporting tools
The need for a separate system installation or configuration is elimi-E
E
nated as a result of using the query tools directly in the SAP ERP system.
You do not have to configure any interfaces or restore them after you E
E
perform a system copy.
You can already create reports even if you have very little system E
E
knowledge. In particular, you require little or no knowledge of ABAP. Even after just a short time, you can create your own queries or ana-lyze existing analyses.
The time needed to create reports is comparably low because reports E
E
can be created from a single source (business knowledge can be applied directly).
Individual information can be queried promptly, and the data already E
E
stored in the database is available immediately (in real time). In trans-actions, you can use a drilldown to navigate directly to the display screen or change screen for data.
Query reporting tools enable SAP users to analyze specific master data objects and process information without the need for a lengthy train-ing phase. As the report recipient/key user, you can create a new report from scratch (on the basis of the data analysis) and only include absolutely necessary information in your reporting environment. You decide which fields you want to output in a list, which selection crite-ria you will provide, or how you want the data to be formatted. We recommend using SAP NetWeaver BW to query mass data. If you want to query extensive datasets at a highly aggregated level, it is more productive to use SAP NetWeaver BW because of its runtime. For finan-cial analyses, you can use Report Painter to create aggregated analyses.
Cumulated Analyses with Multilevel Hierarchies
1.4
The purpose of corporate management reports is to analyze data at a summarized level. If you want to obtain an overview of your enterprise’s key performance indicators (KPIs), a top-down analysis will accomplish this goal for you. For example, a top hierarchy node is displayed in Cost Center Accounting. This hierarchy node is then gradually expanded in Analyzing
Cumulated Analyses with Multilevel Hierarchies 1.4
accordance with the hierarchy levels. If variances arise, the values are initially called for each account and then for each line item. This means that the report user initially obtains the data information at a highly sum-marized level and can display this data in greater detail, if necessary. In the system, you can maintain hierarchies for many objects. In Financial Accounting (FI), in particular, a good hierarchy structure (summarization of characteristics) can cover many reporting requirements.
Summarization Hierarchies 1.4.1
In the SAP system, separate transactions are used to maintain summari-zation levels. Depending on the purpose of the report, the information characteristics (e.g., cost centers) must be summarized in accordance with different criteria. For example, an enterprise summarizes its cost center information in accordance with its responsibilities on one hand and in accordance with functional viewpoints on the other. Different time-based groupings are also required. For the current fiscal year, actual values must be queried in accordance with the first grouping while, for the subsequent year, planned values must be queried in accordance with the second grouping.
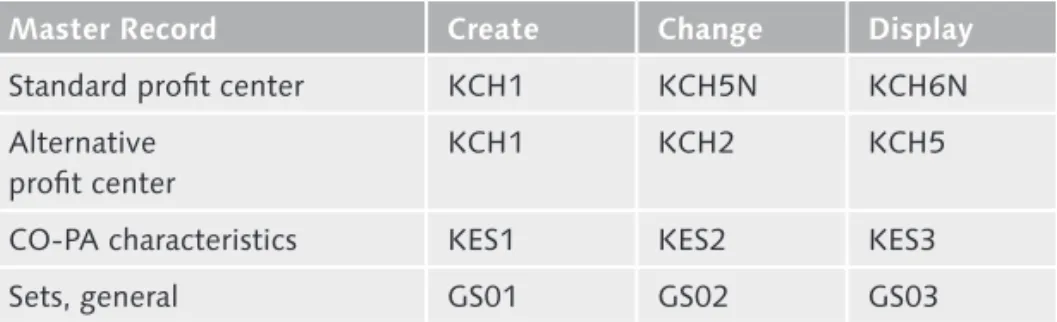
To fulfill your analysis requirements, the SAP software enables you to group master data objects at multiple levels and in accordance with dif-ferent criteria. In the SAP system, a hierarchy (also technically known as a set) is used to group master data. Table 1.5 lists the most important transactions for summarizing master data.
Master Record Create Change Display
Financial statement version OB58 FSE2 FSE3
Cost elements KA01 KA02 KA03
Standard cost centers – OKEON OKENN
Alternative cost centers KS02 KS02 KS03
Statistical key figures KK01 KK02 KK03
Activity types KL01 KL02 KL03
Internal orders KO01 KO02 KO03
Transactions for Master Data Hierarchies
Table 1.5
Summarization criteria
Master data hierarchies
Master Record Create Change Display
Standard profit center KCH1 KCH5N KCH6N
Alternative profit center
KCH1 KCH2 KCH5
CO-PA characteristics KES1 KES2 KES3
Sets, general GS01 GS02 GS03
Table 1.5 Transactions for Master Data Hierarchies (Cont.)
In the context of queries, you can also query the information in master data hierarchies. For example, when analyzing work centers, you can dis-play the assigned cost center. In the query, you can then determine the associated cost center node on the basis of the cost center. You can query a summarization level in SAP Query. If you want to display the infor-mation characteristics at multiple levels, Report Painter and Drilldown Reporting report tools will usually accomplish this goal for you.
Report Painter 1.4.2
Report Painter accesses database tables in the same way SAP Query does. Because Report Painter is usually used in real life, we will not discuss Report Writer. Report Writer — considered by most users to be too tech-nical — can be regarded as a precursor to Report Painter. Almost all of the Report Writer functions have been incorporated into Report Painter. Because there are still some minor functional differences between the two tools, and some of the Report Writer reports delivered by SAP still exist, both tools continue to coexist in the system.
The most important related database tables are grouped together to form reporting tables. Reporting tables are predefined and comprise a certain number of characteristics and key figures. The relationships between the database tables, the reporting tables, and the characteristics and key figures are shown in Figure 1.2.
Querying hierarchy nodes in the query
Database tables
Cumulated Analyses with Multilevel Hierarchies 1.4 Database Tables COSP COSS SAP Customer Reporting Tables CCSS Library
Basic Key Figures Controlling Totals Records Primary Postings Controlling Totals Records Secondary Postings Cost Centers
Cost Element QuantitiesCosts
Key Figures Characteristics
Actual/Plan Costs Actual/Plan Quantities Relationships Among Database Tables, Reporting Tables, and Report
Figure 1.2
Painter Libraries
SAP has defined database tables and reporting tables. Approximately 60 reporting tables are delivered in the standard SAP ERP system. You can structure the contents of the reporting tables in libraries. A library represents a selection of characteristics and key figures associated with a particular reporting table. Therefore, please check whether the report-ing tables delivered by SAP contain the analysis characteristics and key figures you require.
Report Painter is particularly suitable for the following areas: Cost Center Accounting
E E
Internal orders E
E
Analyses in accordance with cost of sales accounting E
E
Profit Center Accounting E
E
Reconciliation ledgers (if the new general ledger is not used) E E Special ledgers E E Libraries Areas in which Report Painter can be used
General ledger E E Project System (PS) E E
Product Cost Planning E
E
You should examine the use of Report Painter in these areas. The fol-lowing two examples demonstrate the advantages associated with using Report Painter in this context.
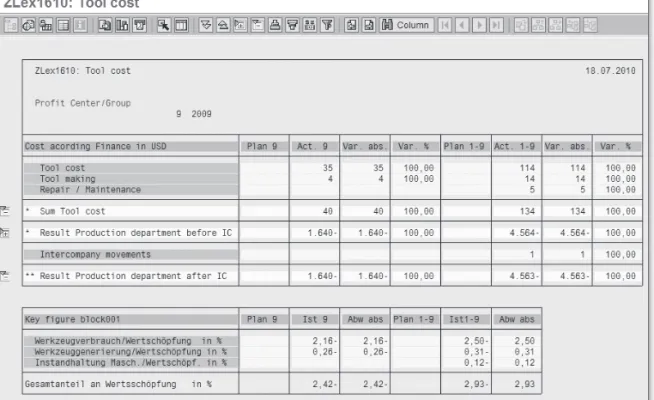
Figure 1.3 shows the fi rst example, namely a controlling report. The controlling report analyzes account groups in individual rows. In a mas-ter data hierarchy, individual accounts are grouped together. Planned, actual, and variance costs are displayed in the columns. In addition, key fi gures are calculated in the lower section of the report. As in Excel, spe-cifi c column and row positions are used as a basis. Report Painter is an excellent reporting instrument in Overhead Cost Controlling and Profi t Center Accounting, in particular.
Example of a Controlling Report in Report Painter
Figure 1.3
Example 1: Controlling report
Cumulated Analyses with Multilevel Hierarchies 1.4
You can also create very good analyses in FI. In real life, Report Painter is very often used to create a provisions report . Figure 1.4 shows you the creation screen for a Report Painter report.
Example of a Provisions Report in Report Painter
Figure 1.4
The different applications are displayed on the left-hand side of the screen as libraries. You now obtain a report generator as an Excel dis-play. By double-clicking the rows and columns, you can use the contents you require. The two axes are displayed in the original report display accordingly. This display is also known as WYSIWYG (What You See Is What You Get).
The Report Painter interface is comparable with an Excel spreadsheet. Consequently, planned or actual values for each period or fi scal year are usually displayed in the columns. In the rows, the data is displayed in accordance with an expandable summarization group (e.g., a cost element); in other words, the report structure is fi xed in terms of the columns and rows displayed. If you now want to analyze other
char-Example 2: Provisions report
Characteristics and key fi gures
acteristics or key figures in the rows or columns, you must adjust the report accordingly.
The Drilldown Reporting tool affords you the flexibility to change the characteristics in the report display. This tool has many interactive func-tions, which we will describe in the next section.
Drilldown Reporting 1.4.3
Drilldown Reporting provides you with an interactive analysis of your cumulated data. The Drilldown Reporting function is used in FI, in particular. Table 1.6 shows the most important transactions for report creation. Master Record Report Overview Create Form Change Form Display Form Create Report Change Report Display Report GL accounts New GL
FGI0 FGI4 FGI5 FGI6 FGI1 FGI2 FGI3
GL accounts Classic GL
FSI0 FSI4 FSI5 FSI6 FSI1 FSI2 FSI3
Customers FDI0 FDI4 FDI5 FDI6 FDI1 FDI2 FDI3
Vendors FKI0 FKI4 FKI5 FKI6 FKI1 FKI2 FKI3
Profit centers KE80 KE81 KE82 KE83 KE84 KE85 KE86
Projects CJE0 CJE1 CJE2 CJE3 CJE4 CJE5 CJE6
CO-PA totals records
KE30 KE34 KE35 KE36 KE31 KE32 KE33
CO-PA line items
KE30 KE94 KE95 KE96 KE91 KE32 KE33
Transactions for Creating Reports in Drilldown Reporting
Table 1.6
You can use the Drilldown Reporting tool to create key figure reports, in particular. For example, you can create valuable key figure reports in Profitability Analysis (CO-PA) and Financial Accounting (FI). An example of a key figure report is shown in Figure 1.5.
Distinguishing between Report Painter and
Drill-down Reporting
Example: Key figure reports
Cumulated Analyses with Multilevel Hierarchies 1.4
Drilldown Reporting — Key Figure Report
Figure 1.5
When creating a Drilldown Reporting report, you must fi rst defi ne a form that will contain fi eld contents at fi eld level. As in Excel, a fi eld can represent row 3, column 4, for example. In real life, key fi gures such as EBIT (Earnings Before Interest and Tax) are determined (1).
The most important part of a Drilldown Reporting report is the creation of the report form . You can also use Report Painter technology to create the form. You therefore require very little additional knowledge to create your own Drilldown Reporting report.
SAP delivers numerous reports in the standard system. For each applica-tion area, there is one central transacapplica-tion with which you can execute Drilldown Reporting reports:
FGI0 — New General Ledger E
E (New GL)
FSI0 — Classic General Ledger E
E
FDI0 — Accounts Receivable Accounting E E Form in Drilldown Reporting report Drilldown Reporting reports in the standard system
FKI0 — Accounts Payable Accounting E
E
KE80 — Profi t Center E
E
KE30 — CO-PA E
E (Totals Item and Line Item Reports)
CJEO — Project Reports E
E
Using Report Templates
Before you create a new report, take a look at the previously mentioned transactions to see if the report you require already exists. Frequently, it is useful to use an existing report as a template for a new report.
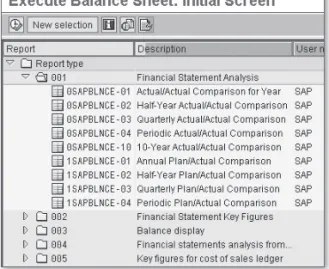
Figure 1.6 shows various balance sheet reports with different time peri-ods for the classic general ledger.
Extract of a Standard SAP Report in the Classic General Ledger
Figure 1.6
Predefi ned key fi gure reports are delivered in addition to the various reports for fi nancial statement analysis . Four sample reports for dis-playing the cash fl ow are available, for example. One advantage of the Drilldown Reporting tool is the fl exible selection of analysis characteris-tics. Open customer items were analyzed in Figure 1.7.
Here, you will see the four areas of the Drilldown Reporting tool: Cash fl ow reports
Cumulated Analyses with Multilevel Hierarchies 1.4
The navigation bar (1) contains various characteristics for a specific data
selection. In our example, open items were selected for Austria. The
Period/year characteristic was then selected.
In the lower-left screen area (2), you can define predefined key figures.
In our example, the debit/credit amount is shown.
The selected data is also displayed in the breakdown (3). In our example,
you see when the open items for Austria fall due. You could now use drag and drop to further analyze these values (e.g., in accordance with the Customer criterion).
Area (4) is a graphical representation of the data that you have
selected.
Example of a Drilldown Reporting Report for the Analysis of Open
Figure 1.7 Customer Items Navigation bar Key figures Breakdown Graphic
In summary, Report Painter and Drilldown Reporting are excellent tools for creating reports in FI. These tools are also considerably faster than using SAP Query or standard SAP transactions for a summarized display of single records, especially when you want to display cumulated data and use multilevel hierarchies.
In addition to the summary reports shown in this section, SAP ERP has numerous excellent standard reports. In the next section, we will intro-duce you to a selection of these reports.
Using Standard Reports
1.5
Not every analysis is customer-specific, and it is not always necessary to create a new (query) report. In the standard system, there are many good predefined analyses that provide the information you require. This section shows how you can find standard analyses in the system. Before you create a new report, you should check whether the report you need already exists in the standard system. The most important reports for real-life scenarios are also listed.
SAP Area Menus 1.5.1
One way to identify standard reports is to use area menus. Area menus are menu trees that are predefined by SAP and contain the most impor-tant transactions for certain areas of application. There are approximately 1,500 area menus. You can call the area menus by entering a transaction code in the command field.
In the command field, enter Transaction SD01 for the Sales and Distribu-tion area menu (see Figure 1.8).
Instead of the entire SAP menu, your initial screen displays the most important transactions in the Sales and Distribution menu. Under the
Sales • Quotations menu path, you find six different transactions for analyzing quotations.
Sales and Distribution area menu (Transaction SD01)
Using Standard Reports 1.5
Input
Calling the Sales and Distribution Area Menu
Figure 1.8
You can use Transaction SE43 (Area Menu) to fi nd the SAP area menu. Enter Transaction SE43 in the command fi eld to display the Area Menu Maintenance screen (Figure 1.9).
Displaying Area Menus in Transaction SE43
Figure 1.9
Area menu maintenance (Transaction SE43)
Here, you can use the matchcode (F4) to select the relevant menu for you. You either search through all 1,500 area menus (approximately), or you use the explanatory text to restrict the number of menus. For example, you could use the text “Sales” to find an area menu. Because many important area menus have the ending MN or 00, you could per-form a *MN or *00 search in the area menu. By entering an asterisk before the two zeros, you get all area menus that end with MN or 00. Call the matchcode [F4] in Transaction SE41, and enter your restriction (see Figure 1.10).
Looking for an Area Menu
Figure 1.10
You obtain approximately 125 different area menus in your search result. The actual transactions are listed on the left-hand side of the result. For example, your search result contains Transaction VA00 for the Sales area menu (see Figure 1.11).
If you now enter Transaction VA00 in the command field, a menu branch containing the relevant transactions from the Sales area is displayed. Expand the Information System • Quotations path in the menu branch, and the system displays six transactions for analyzing quotations. Matchcode
(Transaction SE41)
Sales area menu (Transaction VA00)
Using Standard Reports 1.5
Displaying Area Menus Ending with 00
Figure 1.11
Finding a Report in the SAP Menu 1.5.2
You can also fi nd standard reports by searching the entire SAP menu for a term. To do this, enter Transaction SEARCH_SAP_MENU in the com-mand fi eld (as shown in Figure 1.12).
Entering “search_sap_menu” in the Command Field
Figure 1.12
After you have entered the command “search_sap_menu” or pressed the key combination [Ctrl] + [F], the system displays the Search in menu
Transaction SEARCH_SAP_ MENU
Finding transactions
tree dialog box. You can enter any term here. You can also use an * as a wildcard. For example, if you search for “Customer master*”, the trans-action for calling the customer master record is displayed. Alternatively, enter the term “Quotations” in the Find fi eld (see Figure 1.13).
Entering the Search Term “Quotations” in Transaction
Figure 1.13
“search_sap_menu”
After you have chosen the button with the green checkmark to confi rm the search term “Quotations”, the system displays the relevant menu paths on the next screen. You now have an accurate overview of the menu item that contains the transactions for analyzing quotations (see Figure 1.14).
Search Result for the Term “Quotations” in the SAP Menu
Using Standard Reports 1.5
In this way, you fi nd the same transactions as the ones you found when searching the area menu. However, because menu branches are dis-played when you search the SAP menu, we generally recommend that you search the SAP menu directly.
Searching the Menu for Standard Reports 1.5.3
You can perform a search directly in the actual application for which you require an analysis. In the standard SAP menu, select the following menu branch, for example: Logistics • Sales and Distribution • Sales •
Information System • Quotations. After you have expanded the
Quo-tations menu item, you fi nd six transactions for analyzing quotations (see Figure 1.15).
Searching the SAP Menu for Transactions for Analyzing Quotations
Figure 1.15
In addition to searching the information system for the relevant applica-tion, you can also search the Information Systems menu item. As well as the application components from the Logistics, Accounting, and
Human Resources areas, a cross-application menu branch with analyses is also available (see Figure 1.16).
Searching an SAP component
“Information Systems” menu item
Standard SAP Menu: Information Systems
Figure 1.16
In addition to the reports available under Information Systems, SAP has created additional transactions that are not yet available in the standard menu. We will introduce you to these transactions in the next section.
Important Standard Transactions 1.5.4
On feedback from its customers, SAP has revised many transactions and equipped them with improved functions. However, existing transactions have not been changed. Instead, they coexist with the newly revised transactions, which have the suffi x N.
For example, Transaction VA25N is now available in addition to the for-mer Transaction VA25 for querying quotations (List of Quotations). Transaction VA25 has six selection fi elds (see Figure 1.17). However, the new transaction (VA25N) is considerably more fl exible because its new selection screen contains the new and improved functions for analyzing quotations (see Figure 1.18). Additional display functions are available for the report, which now has a modernized layout. Furthermore, you can display and change quotations directly.
List of Quotations (Transaction VA25 and VA25N)
Using Standard Reports 1.5
Transaction VA25 — List of Quotations
Figure 1.17
Transaction VA25N — List of Quotations
Figure 1.18
Table 1.7 contains a selection of transactions that are not available in the SAP menu.
Application Transaction Description Sales and Distribution VA05N List of Sales Orders Sales and Distribution VA15N List of Inquiries Sales and Distribution VA25N List of Quotations
Sales and Distribution VA35N List of Scheduling Agreements Sales and Distribution VA45N List of Contracts
Sales and Distribution VF05N List of Billing Documents Purchasing ME80AN General Analyses (Inquiry) Purchasing ME80FN General Analyses (Purchase Order) Purchasing ME80RN General Analyses (Contract,
Scheduling Agreement)
Purchasing ME81N Analysis of Purchase Order Values Transactions with Extensive Options
Table 1.7
The new transactions provide highly flexible options. In the Purchasing transactions, for example, you can navigate directly to the purchasing documents (e.g., purchase order) or the material master. In the pur-chasing analyses, you can also display the purchase schedule lines and purchase order history.
Summary
1.6
In SAP ERP, SAP provides the following three query reporting tools for data queries: SAP Query, InfoSet Query, and QuickViewer. You can use these tools immediately in the SAP ERP system without any extensive training or additional costs for online data queries.
When analyzing mass data and highly summarized financial key figures, we recommend that you use SAP NetWeaver BW or Report Painter. The Report Painter technology is also used in the Drilldown Reporting tool. In addition, the standard system already contains numerous analyses. In real life, there are numerous application scenarios in which SAP Query has advantages over SAP NetWeaver BW and Report Painter. In query reporting, it is important to find the correct table with the relevant data content. We will therefore explain how to find the relevant tables in the next chapter, Overview of SAP Tables and Table Links.
Index
A
ABAP, 26, 249, 347
ABAP/4 Dictionary information system, 332
ABAP code, 29, 331, 332
ABAP Dictionary, 70, 249, 250, 254 ABAP Dictionary maintenance, 332 ABAP list, 192, 232, 237, 279 ABAP List Viewer (ALV), 29 ABAP program flow check, 334 ABAP Query, 28
ABAP report generator, 26 ABAP Workbench, 334 ABC analysis, 221 Account group, 38
Accounts payable accounting, 42 Accounts receivable accounting, 42 Activity type, 35
Additional field, 139, 143, 153, 154, 166, 258
Add ABAP code, 156 Create, 155 Define, 155 Additional information, 257 Additional object, 257 Additional table, 258 Ad hoc analysis, 30 Ad hoc query, 77 Administrator authorization, 64, 331 ALV layout, 32, 88
ALV -> see SAP List Viewer, 88 Analysis of purchase order values, 52 Archive administration, 332 Archiving, 58 Archiving object, 66, 67 Area Global, 294 Area menu, 44 Arithmetic operation, 275, 357 Assign report, 217 Attributes Special, 192 Authorization, 30, 331 Authorization assignment, 333 Authorization check, 335 Authorization concept, 334, 341 Authorization group, 335 Authorization object, 333, 334, 335 _DEVELOP, 335 S_DEVELOP, 334, 335 S_GUI, 334 S_PROGRAM, 334, 335 S_QUERY, 334, 336 S_TABU_DIS, 334, 335 S_TCODE, 334
Automatic text recognition, 140, 143 Average value, 241
B
Basic list, 187, 209, 225 Basis mode, 77, 89 Billing document, 32, 352, 353 Brainstorming workshop, 347 Business Warehouse -> see SAP NetWeaver BW, 25C
Calculation Complex, 184, 213 Calculation formula, 210, 213 CALL FUNCTION, 263 Cancellation, 370 CAUFV, 381 Change authorization, 333 Change lock, 178 Characteristic value, 195 Check table, 252 Classic general ledger, 42 ClipboardUpload, 195
CLUSTER -> see Cluster table, 54 Cluster table, 54
CO account assignment, 356 Code for extra, 257 Column header, 237 Column name, 229 Command field, 46 Comparison operand, 267 Complex calculation, 184, 213 CONCATENATE, 275 Condition subtotal, 357 Confirmation key figure, 370 Consistency check, 299 Consultant, 348 Control break, 203 Control level, 232 Controlling report, 38 Control Panel, 281 Convert QuickView, 167, 169 CO-PA, 42, 351 CO-PA characteristic, 36 CO-PA line item, 40 CO-PA totals record, 40 Corporate management, 32, 347 Cost element, 35
Country analysis, 355 Create transaction code, 339 Currency field, 254
Customer, 40
Customer characteristic, 363 Customer document, 365 Customer Line Items, 360 Customer master, 72, 355 Customer name, 360 Customizing client, 96
D
D010TAB, 104 Data Filter, 191 Global, 294 Sort, 191 Total, 191 Database, 249 Logical, 30, 58, 61, 62, 63, 84, 85, 141Database table -> see Table, 53 Database utility, 305 Data basis, 26, 29, 78, 348 Data Browser, 53, 55, 73, 79, 279 Data declaration, 255 Data Dictionary, 54, 249 Data display, 54 Data element, 249, 252, 254 Data export, 289, 335 Data field, 106, 255 Data formatting, 26 Data Modeler, 332 Data object, 254 Data record Number, 241 Data retrieval, 303 Data selection, 192, 196, 201 Data sensitivity, 332 Dataset, 294 Data source, 29, 78, 83, 86, 104, 141 Data type -> see Table link, 146 Date, 238 Date field, 199 Date variable, 199 Dynamic, 199 Day in arrears, 365 DD02L, 55
DDIC -> see ABAP Dictionary, 249 Debit/credit indicator, 362 Decimal place, 252 Delivery, 32 Developer authorization, 331 Development package, 340 Display fields, 77 Document status, 226 Domain, 250, 253 Drilldown, 34, 215, 351 Drilldown Reporting, 25, 40 Due date for net payment, 364 Duet, 279
Index
E
Editor screen, 262 ELSEIF statement, 267 Employee Responsible, 360 End-of-Selection, 277 Enterprise area, 347 Event, 276Excel -> see Microsoft Excel, 191 Export function, 296 Extras button, 256
F
F1 help, 58, 60 Feasibility of implementation, 348 FI document, 226 Field Hide, 199 Local, 182, 209, 210, 373 Protect, 199Short name in the query, 183 Field assignment, 356
Field documentation, 146 Field formatting, 91
Field group, 29, 106, 139, 149, 180, 209, 213
Add additional field, 159 Add field, 152
Create, 153, 158 Default, 149 Function, 151 Field group view, 256 Field help, 58 Field query, 265 Field without values
save, 199 File
Local, 289 File storage, 288 Financial Accounting, 41 Financial statement analysis, 42 Financial statement version, 35 Footer, 232 Footers, 89 Form, 41 Format Line color, 235 Formatting, 90 Functional area, 29 Text, 294
Functional area catalog, 294 Functional group, 29 Function module, 263, 303 UNIT_CONVERSION_SIMPLE, 372
G
General ledger, 42 Classic, 42 New, 42 General selection, 193 General table display, 55 GL account, 40Global property, 335
Global query area, 93, 96, 294 Graphic, 232
Graphical join editor, 146 Graphic type, 220 Grouping, 35 Group of users, 347 GUI activity, 334
H
Header, 232Header data and item data, 60, 74 Hierarchy, 34 Hierarchy node, 36 HTML data format, 288
I
Icon, 185, 211 Filter criterion, 214 ICON_GREEN_LIGHT, 210 ICON_LED_GREEN, 373ICON_RED_LIGHT, 186 STATUSCODE, 209 IF statement, 265, 356 Import from a text file, 195 Import from text file, 197 Import option, 299 Industry template, 348 Information Technical, 59 Information system, 49 InfoSet, 25, 28, 30, 84, 93, 94, 99, 104, 108, 109, 111, 139, 181, 254, 276 ABAP code, 139 Documentation (key), 294 Insert table, 145
Role assignment of call, 294 Transport, 297
Inquiry, 52 Installation, 33 Internal order, 35
INTTAB -> see Structure, 54 Items -> see Open items, 32
J
Join editor Graphical, 146 Jump, 217K
Key field, 145, 249, 251, 304 Key figure, 239 Statistical, 35L
Language, 78 Layout design, 112 Layout mode, 89, 230 Layout variant, 188, 191, 202, 203 Left inner join -> see Table join, 148 Left outer join -> see Table join, 148Legacy System Migration Workbench, 222 Library, 37 License, 33 LIKE statement, 266 Line structure, 232 Link suggestion, 106
LIS -> see Logistics Information System, 351
List field, 78, 86, 90, 188, 209 List line color, 234
List of billing documents, 52 List of contracts, 52 Literal, 256 Local field, 182, 209, 210 Create, 183 Define, 184 Select, 209 Local file, 289
Logical Database Builder, 332 Logical database -> see Database, 58 Logistics Information System (LIS), 28, 351
Loop selection, 268
LSMW -> see Legacy System Migration Workbench, 222
M
Maintenance, 33 Management, 348 Master data hierarchy, 35 Master data quality, 347 Master data report, 31 Material number, 370 Measuring productivity, 366 Merge, 298 Message area, 264 MESSAGE command, 264 Message output, 264 Microsoft Excel, 32, 279, 287 Functions, 280 Graphic, 284 Inplace, 202, 280 Interface, 202, 279, 280, 289
Index
Template, 286, 290 Microsoft Office, 287 Microsoft Word, 286 Multiple data records, 154
Multiple selection, 193, 194, 196, 197
N
New general ledger -> see General ledger, 42
Null value, 90, 235
O
Object Navigator, 70 Office Integration, 287 Open item list, 226 Open items, 32, 361 Order reason, 355 Output format, 179, 192, 219, 230, 232, 287 Output length, 90 Output option Field, 232 Line, 232 Output position, 90 Output sequence, 244, 246
P
Page footer, 236 Page header, 232, 236 Parameter, 198 Parameter ID, 169 AQW, 98Parameters -> see Selection, 160 Percentage, 241, 243
Performance, 195, 303 Performance analysis, 332 PFCG role, 332, 337 Pivot table, 287
POOL -> see Pool table, 54 Pool table, 54 Primary index, 304 Print preview, 203 Process, 348 Production client, 96 Production order, 32 Profitability Analysis, 41 Profit center, 40, 42 Alternative, 36 Pro forma invoice, 354 Project status, 349 Property Global, 335 Provisions report, 39 Purchase order, 32
Q
Quantity field, 254 Query, 25, 28, 31, 93, 94 ABAP report, 173 Authorization, 334 Change lock, 178 Column header, 181 Copy, 175 Delete, 175 Documentation (key), 294 Editing option, 174 Formatting option, 167 Initial screen, 168 Long text, 167 Name, 177 Navigation, 177 Output format, 167 Rename, 175 Report name, 172 Screen template, 179 Standard variant, 178 Test, 188 Text, 294 Transport, 297 User group, 165 Query area, 93, 94, 96, 99, 293 Change, 168 Global, 93, 96 Query catalog, 294, 299Query report Convert, 77
Query reporting tool, 25, 28, 77 QuickViewer, 25, 28, 30, 31, 77, 95, 331 Editing function, 81 Layout mode, 89 Online help, 82 Operating instructions, 82 Report overview, 81
QuickViewer initial screen, 77, 80 Quotation, 50
R
Ranked list, 225, 246 Reconstruct catalog, 299 Relational operand, 201 Replace, 298 Report, 27 Report creation Procedure, 347 Report definition, 348, 350 Report generator, 27 Report house, 349 Reporting table, 36 Report Painter, 25, 34, 36 Report Painter library, 37 Report recipient, 348 Report/report interface, 188, 215, 216 Report RSAQR3TR, 295 Report specification, 349, 350 Report template, 42, 348 Report type, 216 Report Writer, 25, 36 Required field, 199 Returns item, 354 Role administration, 332 Role maintenance, 332 Role -> see User role, 333RRI -> see Report/report interface, 216
S
Sales, 46Sales and Distribution characteristic, 360 Sales document, 74
Sales document category, 353 Sales evaluation, 351 Sample code, 262 SAP business graphic, 284 SAP BusinessObjects, 33 SAP GUI, 280, 281
SAP List Viewer, 29, 192, 193, 202, 225, 230, 232, 248, 335 SAP NetWeaver BW, 25, 33 SAP Note 119665, 300 SAP Note 127182, 300 SAP Note 127717, 300 SAP Note 130316, 300 SAP Note 202839, 300 SAP Note 352617, 300 SAP Note 393044, 300 SAP Note 393160, 300 SAP Note 412054, 300 SAP Note 431192, 300 SAP Note 643330, 300 SAP Query report
Convert, 77
SAP Query -> see Query, 25, 28, 31, 93 SAP table -> see Table, 53
Scaling, 235, 241
S_DEVELOP -> see Authorization object, 334
SEARCH_SAP_MENU, 47 Search screen, 196 Secondary index, 304 Select field, 229 Select field group, 229 Selection, 140, 160, 256 Define, 160 General, 193 Parameter, 140 Parameters, 160 Selection criterion, 55, 140, 160, 191, 193, 198 Single value, 191 Value interval, 191
Index
Selection characteristic, 193
Selection criterion -> see Selection, 140, 160 Selection field, 78, 186, 230 Selection option, 194, 195 Selection screen, 26, 77, 85, 187, 191, 192 Selection text, 229 Selection variable, 199 Selection variant, 178, 191, 192, 198 SELECT loop, 268
SELECT SINGLE statement, 257, 272, 355
Set, 35
Set/get parameter, 174
S_GUI -> see Authorization object, 334 SHOWICON, 211 SHOWSYMB, 210 Signature Design, 280 Single value, 193 Sort field, 89 Sorting, 241 Sort order, 204 Special attributes, 192 Spool output, 289 Spreadsheet, 287
S_PROGRAM -> see Authorization object, 334
SQL trace, 66
S_QUERY -> see Authorization object, 334
S_TABU_DIS -> see Authorization object, 334
Standard, 35
Standard area, 169, 293, 296 Client-specific, 98 Standard profit center, 36 Standard query area, 93, 96, 100 Standard report, 44
Start-of-Selection, 276 Statistic, 239
Title, 239
Statistical key figures, 35 Statistics, 225
S_TCODE -> see Authorization object, 334 Structure, 54, 70, 250, 256 Subtotal, 202, 203, 241, 244 Summarization hierarchy, 35 Summation function, 225 Summation level, 238, 283 Switch off GPA, 199 System configuration, 33 System field, 260, 261 SY-DATE, 261 SY-DBCNT, 261 SY-INDEX, 261 SY-LANGU, 261 SY-SUBRC, 260, 261, 323 SY-TABIX, 261 SY-TIME, 261 SY-UNAME, 261
SYST -> see System field, 261
T
Table, 29, 53, 56, 84, 106, 141 Controlling, 384 Direct read, 368 Financial Accounting, 384 General, 377 Global, 294 Insert, 105 Materials Management, 381 Overview, 377 Production, 380Sales and Distribution, 378 Transparent, 54, 57 Table A017, 383 Table A305, 379 Table A306, 379 Table access, 335 Table ADRC, 378 Table AFKO, 381 Table AFPO, 370, 381 Table AFRU, 366 Table AFVC, 381 Table AFVV, 366, 381 Table ANEK, 387 Table ANEP, 387 Table ANLA, 387
Table ANLB, 387 Table ANLP, 387 Table ANLZ, 387 Table AQGDB, 294 Table AQGIDOC, 294 Table AQGQDOC, 294 Table AQLDB, 294 Table AQLIDOC, 294 Table AQLQCAT, 294 Table AQLQDOC, 294 Table AQLQSTRUC, 378 Table AQLSCAT, 294 Table AQLTQ, 294, 378 Table AQLTS, 294 Table AQRLASS, 294 Table AQSLDB, 294 Table AQTDB, 294 Table AUFK, 381 Table BKPF, 387 Table BNKA, 386 Table BSAD, 387 Table BSAK, 387 Table BSAS, 387 Table BSEC, 387 Table BSEG, 387 Table BSET, 387 Table BSID, 226, 273, 362, 387 Table BSIK, 387 Table BSIP, 388 Table BSIS, 387 Table BVOR, 387 Table category, 54, 57 Table CDHDR, 377 Table CDPOS, 377 Table COBK, 389 Table COEJ, 389 Table content, 55, 296 Table COSP, 389 Table COSS, 389 Table CRHD, 368 Table CSKA, 388 Table CSKB, 388 Table CSKS, 389 Table CSKT, 389 Table CSKU, 388 Table D010TAB, 95, 166, 377 Table DD02L, 55, 377 Table DD03L, 377 Table description, 249 Table determination, 58 Table EINA, 383 Table EINE, 383 Table EKKN, 383 Table EKKO, 383 Table EKPO, 383 Table entry Language-dependent, 78 Table FAGLFLEXA, 388 Table FAGLFLEXP, 388 Table FAGLFLEXT, 388 Table field, 249 Table GLPCA, 389 Table GLPCC, 389 Table GLPCO, 389 Table GLPCT, 389 Table JEST, 377 Table join, 29, 30, 84, 104, 105, 139, 141, 144, 148, 166, 270
Left inner join, 139, 148 Left outer join, 139, 148
Table KNA1, 274, 351, 378, 385, 386 Table KNAS, 385 Table KNB1, 385, 386 Table KNB4, 385, 386 Table KNB5, 385 Table KNBK, 385 Table KNC1, 388 Table KNEX, 378 Table KNKA, 379 Table KNKK, 379 Table KNMT, 378 Table KNVA, 378 Table KNVD, 378 Table KNVH, 378 Table KNVK, 378 Table KNVL, 378 Table KNVP, 378 Table KNVS, 378 Table KNVT, 378 Table KNVU, 378 Table KNVV, 363, 378 Table KONM, 383 Table KONP, 379, 383 Table LFA1, 382, 385
Index Table LFB1, 385 Table LFB5, 385 Table LFBK, 385 Table LFC1, 388 Table LFEI, 382 Table LFM1, 382 Table LFM2, 382 Table LIKP, 379 Table link, 142, 252, 254, 255 Data type, 146 Table LIPS, 379 Table logging, 29 Table LTDX, 378 Table maintenance, 334 Table MAKT, 270, 382 Table MARA, 270, 382 Table MARC, 270, 382 Table MARD, 270, 384 Table MARDH, 384 Table MAST, 380 Table MBEW, 270, 382 Table MBEWH, 382 Table MKOL, 384 Table MKPF, 384 Table MODACT, 377 Table MSEG, 384 Table MSKU, 384 Table MSLB, 384 Table MVER, 382 Table MVKE, 270, 382 Table name, 294 Table PAYR, 388 Table PLKO, 380 Table PLPO, 380 Table REGUH, 388 Table REPOSRC, 173, 377 TABLES command, 258 Table SKA1, 386 Table SKAT, 386 Table SKB1, 386 Table STAS, 380 Table STKO, 380 Table STPO, 380 Table SYST, 378 Table T001, 273, 384 Table T001L, 381 Table T001W, 381 Table T030, 386 Table T052, 388 Table T052U, 388 Table T100, 378 Table TADIR, 377 Table TFDIR, 377 Table TJ02, 377 Table TPARA, 377 Table trace, 58, 64 Table TSTC, 95, 166, 258 Table TSTCT, 77, 78, 95, 250 Table TVDIR, 377 Table VBAK, 59, 62, 75, 379 Table VBAP, 66, 75, 379 Table VBEP, 75 Table VBFA, 75 Table VBKD, 75, 379 Table VBPA, 75, 351 Table VBRP, 351 Table VBUK, 75, 379 Table VBUP, 76, 379 Table VBUV, 75 Table view, 54, 366 Table VTTK, 379 Table VTTP, 379 Target productivity, 367 Target time Order confirmation, 376 Technical information, 59 Term of payment, 364 Test client, 98 Test mode, 242 Text field, 140, 143 Text identification, 143 Text recognition Automatic, 140, 143 Time conversion, 372 Time unit, 371
Time unit conversion -> see Time unit, 371
Top-down analysis, 34 Top key figure value, 225 Top-of-Page, 277
Traffic light icon, 211, 374 Traffic light status, 373 Transaction
Ingo Hilgefort
Inside SAP BusinessObjects
Advanced Analysis
Offers a comprehensive review of the product features/functionalities, as
well as targeted guidance on installation, delployment, data connectivity,
and usage scenarios. It also provides a side-by-side comparison of SAP
Advanced Analysis Office with SAP BEx Analyzer, and a product road that
outlines the main topics in the SAP BI roadmap for the Advanced
Analysis Office version and the Web version as well touch on the
migration topic.
343 pp., 2010, 69,95 Euro / US$ 69.95 ISBN 978-1-59229-371-1
>> www.sap-press.com
Explains what Advanced Analysis
Office is and how it can benefit users
Details how to deploy the tool and
connect it with SAP and non-SAP data
Uses real-world scenarios to show how
the tool can work in financials,
HR, CRM, and retail
Transaction code text, 143Transaction data report, 32 Transaction FBL5N, 359 Transaction FGRP, 27 Transaction ME80AN, 52 Transaction ME80FN, 52 Transaction ME80RN, 52 Transaction ME81N, 52 Transaction N, 279 Transaction PFCG, 332, 337 Transaction SARA, 58, 67, 332 Transaction SD01, 44 Transaction SD11, 332 Transaction SE11, 332 Transaction SE16, 55 Transaction SE16N, 55, 79, 279, 332 Transaction SE36, 58, 61, 332 Transaction SE38, 174 Transaction SE43, 45 Transaction SE54, 335 Transaction SE80, 58 Transaction SE85, 70, 332 Transaction SQ01, 27, 29, 81, 93, 97, 109, 165, 167, 192, 193, 228, 331 Transaction SQ02, 29, 93, 97, 141, 227, 295, 332, 335 Transaction SQ03, 29, 93, 97, 99, 295, 331, 332, 336 Transaction SQ07, 332 Transaction SQ10, 29, 332 Transaction SQVI, 29, 31, 80, 331 Transaction ST05, 58, 64, 332 Transaction VA00, 46 Transaction VA0*, 79 Transaction VA05N, 52 Transaction VA15N, 52 Transaction VA25, 50 Transaction VA25N, 50, 52 Transaction VA35N, 52 Transaction VA45N, 52 Transaction VF05N, 52
Transparent table -> see Table, 57 Transport dataset, 294
Transport dataset (local), 294 Transport option, 297 Transport request, 296
Transport route, 293
Transport system, 96, 293, 294 Transport tool, 295, 299 TRANSP -> see Table, 54 TYPE statement, 255
U
Unassign, 299
Upload from clipboard, 197 User department, 348 User group, 93, 94, 99, 101, 102, 165, 331, 333 Change, 168 Copy, 99 Delete, 99 Rename, 99 SYSTQV, 173 Transport, 297 User profile, 169 User role, 333
V
Value credit memo, 354 Value debit memo, 354 Variable, 236 Variant, 191 Preassignment, 192 Variant attribute, 198, 199 Vendor, 40 View field, 368
VIEW -> see Table view, 54 View structure, 54