707
© 2018 by the Serbian Biological Society How to cite this article: Stajković-Srbinović O, Buntić A, Rasulić N, Kuzmanović Đ, Dinić Z, Delić D, Mrvić V. Microorganisms in soils with elevated heavy metal concentrations in southern Serbia. Arch Biol Sci. 2018;70(4):707-16.
Microorganisms in soils with elevated heavy metal concentrations in southern Serbia
Olivera Stajković-Srbinović*, Aneta Buntić, Nataša Rasulić, Đorđe Kuzmanović, Zoran Dinić, Dušica Delić and Vesna Mrvić
Institute of Soil Science, Teodora Drajzera 7, 11000 Belgrade, Serbia
*Corresponding author: [email protected]
Received: May 4, 2018; Revised: June 21, 2018; Accepted: July 6, 2018; Published online: August 2, 2018
Abstract: Soil chemical properties and total heavy metal concentrations (As, Cd, Cr, Cu, Ni, Pb, Zn, Fe and Mn) and their
relationships with some soil microbiological characteristics (such as soil respiration and numbers of specific groups of microorganisms) were evaluated in agricultural soils in southern Serbia. In 42% of samples, slightly elevated concentrations of As, Ni and/or Pb were detected, with the highest values of 43.4, 64.4 and 184.1 mg/kg, respectively. No significant dif-ferences were observed in soil microbiological characteristics between soil samples with elevated heavy metals and heavy metals below the maximum allowed concentrations (MAC). There was no negative correlation between any of the heavy metals and any microbiological characteristics, except the total number of fungi and the concentration of Ni (r=-394). Positive correlations between most of the heavy metals and the number of Azotobacter were obtained. Correlation analysis and stepwise multiple regression analyses indicated that the chemical properties of the soil are the factors that affected the number of microorganisms the most. The content of CaCO3 significantly contributed to variations in soil respiration (39%), the total number of microorganisms was affected the most by humus (53%), oligonitrophiles by the total N content (49%), while the numbers of actinomycetes and fungi were affected by the pH (48% and 58% of the variation).
Key words: soil quality; heavy metals; microbial community; soil respiration; agroecosystems
INTRODUCTION
Soil, as a non-renewable resource and the basis of our agroecosystems, is essential to sustain human life. The presence of increased heavy metal concentrations in agricultural soils poses some risks for plant produc-tion, but also to ecosystems and human health. Cer-tain heavy metals are naturally present in the soil due to geological weathering, but anthropogenic activities can considerably increase their concentrations in soil. Some of the sources of heavy metals in agricultural soils are fertilizers, sewage for irrigation and the depo-sition of fossil fuel by-products [1].
Increased levels of heavy metals have become one of the major concerns due to their toxicity in biologi-cal systems. Soil microorganisms are vital in nutrient cycling, soil organic-matter decomposition, transfor-mation of metals [2]. Elevated levels of heavy metals in soils influence the size of microbial populations and their activities, which may affect soil nutrients and their absorption from the soil by plants [3].
Changes in microbial numbers and activities are proposed as an easy and sensitive indicator of changes in soil physicochemical properties and soil degrada-tion [4-6]. Microorganisms respond quickly to heavy metal effects in the soil and can be good indicators of soil quality [7-9]. Numerous studies have shown the negative effects of metal contamination on soil respiration, enzyme activity, microorganism diversity and microbial community size [5,10-12]. However, toxicity thresholds varied widely in different studies, indicating that the determination of critical metal con-centrations in soils for specific groups of microorgan-isms and processes is very challenging [3,9,13]. On the other hand, there were no differences in micro-bial biomass, activity of enzymes or presence of some groups of microorganisms between contaminated and uncontaminated soils [9,14].
soil microorganisms. The bioavailability of heavy met-als depends on different soil properties (pH, cation-exchange capacity (CEC), organic matter, etc.). Mi-crobial communities can also develop resistance to chronic exposure to high heavy metal concentrations [14]. Therefore, due to complex physical and chemical interactions in the soil, the effects of heavy metals on
soil microorganisms must be examined together with other soil characteristics.
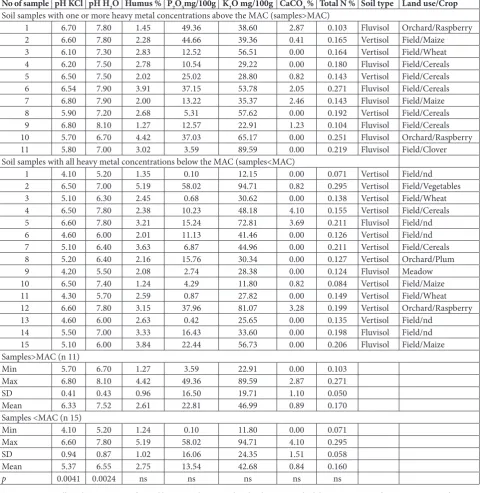
Increased levels of heavy metals, mainly Ni and Cr, have been found in some parts of Serbia (western Serbia), while elevated concentrations of other metals have been sporadically detected in agricultural soils in Table 1. Soil chemical properties.
No of sample pH KCl pH H2O Humus % P2O5mg/100g K2O mg/100g CaCO3 % Total N % Soil type Land use/Crop
Soil samples with one or more heavy metal concentrations above the MAC (samples>MAC)
1 6.70 7.80 1.45 49.36 38.60 2.87 0.103 Fluvisol Orchard/Raspberry
2 6.60 7.80 2.28 44.66 39.36 0.41 0.165 Vertisol Field/Maize
3 6.10 7.30 2.83 12.52 56.51 0.00 0.164 Vertisol Field/Wheat
4 6.20 7.50 2.78 10.54 29.22 0.00 0.180 Fluvisol Field/Cereals
5 6.50 7.50 2.02 25.02 28.80 0.82 0.143 Vertisol Field/Cereals
6 6.54 7.90 3.91 37.15 53.78 2.05 0.271 Fluvisol Field/Cereals
7 6.80 7.90 2.00 13.22 35.37 2.46 0.143 Fluvisol Field/Maize
8 5.90 7.20 2.68 5.31 57.62 0.00 0.192 Vertisol Field/Cereals
9 6.80 8.10 1.27 12.57 22.91 1.23 0.104 Fluvisol Field/Cereals
10 5.70 6.70 4.42 37.03 65.17 0.00 0.251 Fluvisol Orchard/Raspberry
11 5.80 7.00 3.02 3.59 89.59 0.00 0.219 Fluvisol Field/Clover
Soil samples with all heavy metal concentrations below the MAC (samples<MAC)
1 4.10 5.20 1.35 0.10 12.15 0.00 0.071 Vertisol Field/nd
2 6.50 7.00 5.19 58.02 94.71 0.82 0.295 Vertisol Field/Vegetables
3 5.10 6.30 2.45 0.68 30.62 0.00 0.138 Vertisol Field/Wheat
4 6.50 7.80 2.38 10.23 48.18 4.10 0.155 Vertisol Field/Cereals
5 6.60 7.80 3.21 15.24 72.81 3.69 0.211 Fluvisol Field/nd
6 4.60 6.00 2.01 11.13 41.46 0.00 0.126 Vertisol Field/nd
7 5.10 6.40 3.63 6.87 44.96 0.00 0.211 Vertisol Field/Cereals
8 5.20 6.40 2.16 15.76 30.34 0.00 0.127 Vertisol Orchard/Plum
9 4.20 5.50 2.08 2.74 28.38 0.00 0.124 Fluvisol Meadow
10 6.50 7.40 1.24 4.29 11.80 0.82 0.084 Vertisol Field/Maize
11 4.30 5.70 2.59 0.87 27.82 0.00 0.149 Vertisol Field/Wheat
12 6.60 7.80 3.15 37.96 81.07 3.28 0.199 Vertisol Orchard/Raspberry
13 4.60 6.00 2.63 0.42 25.65 0.00 0.135 Vertisol Field/nd
14 5.50 7.00 3.33 16.43 33.60 0.00 0.198 Fluvisol Field/nd
15 5.10 6.00 3.84 22.44 56.73 0.00 0.206 Fluvisol Field/Maize
Samples>MAC (n 11)
Min 5.70 6.70 1.27 3.59 22.91 0.00 0.103
Max 6.80 8.10 4.42 49.36 89.59 2.87 0.271
SD 0.41 0.43 0.96 16.50 19.71 1.10 0.050
Mean 6.33 7.52 2.61 22.81 46.99 0.89 0.170
Samples <MAC (n 15)
Min 4.10 5.20 1.24 0.10 11.80 0.00 0.071
Max 6.60 7.80 5.19 58.02 94.71 4.10 0.295
SD 0.94 0.87 1.02 16.06 24.35 1.51 0.058
Mean 5.37 6.55 2.75 13.54 42.68 0.84 0.160
p 0.0041 0.0024 ns ns ns ns ns
different parts of the country [15]. These high metal concentrations were probably influenced by the ba-sic substrate, but anthropogenic influence cannot be excluded [15].
In this study we evaluated soil chemical charac-teristics, heavy metal concentrations and soil micro-biological characteristics, such as basal soil respiration and the numbers of specific groups of microorganisms and their relationships in soils under intensive agri-cultural production, in the southern part of Serbia.
MATeRIALS AND MeTHODS Location description
Soil was sampled from the southeastern part of Serbia, in the area of Pčinja district. In this area, agricultural soils belong to the two types, vertisol and fluvisol [16]. The soils were mainly under cereals (Table 1). Samples were taken in the autumn of 2017, from a depth of 20 cm, and used to analyze the chemical and micro-biological properties. Single (composite) soil samples were comprised of 5 subsamples taken from the center and corners of 10x10 m square plots [17]. A total of 26 soil samples was analyzed.
Chemical analysis
Soil pH was established with a glass electrode pH me-ter in H2O and 1N KCl (at a ratio of soil:KCl or H2O of 1:2.5). The AL-method of Egner-Riehm was used to determine the available P and K in the soil. Total soil N (Ntot) and total soil C (Ctot) were determined by dry combustion with a CNS analyzer (Vario model EL III, Hanau, Germany) and applying ISO standards 13878:1998 and ISO 10694:1995, respectively [18,19]. The humus content was calculated from Ctot, deter-mined by a CNS analyzer and CaCO3, and by multi-plying with 1.724 (conversion factor). The granulo-metric composition of the soils was determined by a combined method of sieving and pipetting [20]. The CaCO3 was determined volumetrically with a Schei-bler calcimeter. Total heavy metal concentrations (As (arsenic, metalloid), Cd (cadmium), Cr (chromium), Cu (cooper), Ni (nickel), Pb (lead), Zn (zinc), Fe (iron) and Mn (manganese)) were determined by acid digestion (HNO3) and plasma emission spectrometry
(iCAP 6300 ICP, Cambridge, UK) according to ISO 22036:2008 [21]. Quality control, accuracy and pre-cision of the measurement and concentration values were performed using a certified reference material, ERM-CC141 – Loam Soil. The limit of detection (LOD) for each observed metal was as follows in mg/ kg: As 0.4, Cd 0.10, Cr 0.3, Cu 0.3, Ni 0.4, Pb 0.6, Zn 0.5, Fe 25.0 and Mn 0.5.
Microbiological analysis
Soil respiration was determined by laboratory incuba-tion with constant temperature and moisture. The re-spired carbon dioxide was trapped in the NaOH, and the remaining amount of OH- ions was back-titrated with an HCl solution. Finally, the amount of released CO2 during the incubation period was calculated [22]. The total number of microorganisms was determined by the plate count method on the agarized soil extract, the number of fungi on the Chapek medium as de-scribed previously [2], actinomycetes on the medium according to Krasiljnikov, and oligonitrophiles on the Fyodorov medium [23]. Ammonifiers and
Azo-tobacter spp. were determined by the most probable
number (MPN) method in the liquid medium with asparagines or mannitol, respectively [24].
Statistics
Statistical differences in chemical and microbial pa-rameters between different groups of soil samples, with and without elevated heavy metal concentrations, were evaluated using one-way ANOVA. In order to determine the relationship between the microbiologi-cal properties of soil and other investigated character-istics of soil samples (SPSS 16.0), Pearson’s correlation and stepwise multiple linear regression were used.
ReSULTS
Soil chemical characteristics and heavy metal concentrations
or more heavy metals above the maximum allowed concentrations (MAC), and soils with all evaluated metals below the MAC for agricultural soils, according to the national legislation [17].
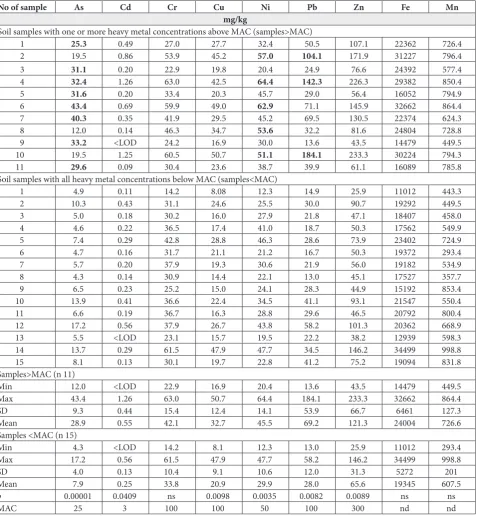
In 15 out of 26 soil samples the total concentra-tions of all investigated metals (As, Cd, Cr, Cu, Ni, Pb, Zn, Fe and Mn) were below the MAC (Table 2). A total of 11 samples had elevated concentrations Table 2. Heavy metal concentrations in soil.
No of sample As Cd Cr Cu Ni Pb Zn Fe Mn
mg/kg
Soil samples with one or more heavy metal concentrations above MAC (samples>MAC)
1 25.3 0.49 27.0 27.7 32.4 50.5 107.1 22362 726.4
2 19.5 0.86 53.9 45.2 57.0 104.1 171.9 31227 796.4
3 31.1 0.20 22.9 19.8 20.4 24.9 76.6 24392 577.4
4 32.4 1.26 63.0 42.5 64.4 142.3 226.3 29382 850.4
5 31.6 0.20 33.4 20.3 45.7 29.0 56.4 16052 794.9
6 43.4 0.69 59.9 49.0 62.9 71.1 145.9 32662 864.4
7 40.3 0.35 41.9 29.5 45.2 69.5 130.5 22374 624.3
8 12.0 0.14 46.3 34.7 53.6 32.2 81.6 24804 728.8
9 33.2 <LOD 24.2 16.9 30.0 13.6 43.5 14479 449.5
10 19.5 1.25 60.5 50.7 51.1 184.1 233.3 30224 794.3
11 29.6 0.09 30.4 23.6 38.7 39.9 61.1 16089 785.8
Soil samples with all heavy metal concentrations below MAC (samples<MAC)
1 4.9 0.11 14.2 8.08 12.3 14.9 25.9 11012 443.3
2 10.3 0.43 31.1 24.6 25.5 30.0 90.7 19292 449.5
3 5.0 0.18 30.2 16.0 27.9 21.8 47.1 18407 458.0
4 4.6 0.22 36.5 17.4 41.0 18.7 50.3 17562 549.9
5 7.4 0.29 42.8 28.8 46.3 28.6 73.9 23402 724.9
6 4.7 0.16 31.7 21.1 21.2 16.7 50.3 19372 293.4
7 5.7 0.20 37.9 19.3 30.6 21.9 56.0 19182 534.9
8 4.3 0.14 30.9 14.4 22.1 13.0 45.1 17527 357.7
9 6.5 0.23 25.2 15.0 24.1 28.3 44.9 15192 853.4
10 13.9 0.41 36.6 22.4 34.5 41.1 93.1 21547 550.4
11 6.6 0.19 36.7 16.3 28.8 29.6 46.5 20792 800.4
12 17.2 0.56 37.9 26.7 43.8 58.2 101.3 20362 668.9
13 5.5 <LOD 23.1 15.7 19.5 22.2 38.2 12939 598.3
14 13.7 0.29 61.5 47.9 47.7 34.5 146.2 34499 998.8
15 8.1 0.13 30.1 19.7 22.8 41.2 75.2 19094 831.8
Samples>MAC (n 11)
Min 12.0 <LOD 22.9 16.9 20.4 13.6 43.5 14479 449.5
Max 43.4 1.26 63.0 50.7 64.4 184.1 233.3 32662 864.4
SD 9.3 0.44 15.4 12.4 14.1 53.9 66.7 6461 127.3
Mean 28.9 0.55 42.1 32.7 45.5 69.2 121.3 24004 726.6
Samples <MAC (n 15)
Min 4.3 <LOD 14.2 8.1 12.3 13.0 25.9 11012 293.4
Max 17.2 0.56 61.5 47.9 47.7 58.2 146.2 34499 998.8
SD 4.0 0.13 10.4 9.1 10.6 12.0 31.3 5272 201
Mean 7.9 0.25 33.8 20.9 29.9 28.0 65.6 19345 607.5
p 0.00001 0.0409 ns 0.0098 0.0035 0.0082 0.0089 ns ns
MAC 25 3 100 100 50 100 300 nd nd
above the MAC for As, Ni and Pb, out of which 8, 5 and 3 samples had elevated contents of As, Ni and Pb, respectively (Table 2). The concentrations of As in all samples ranged from 4.3 to 43.4 mg/kg (mean 16.8±12.5), with elevated concentrations in 8 samples.
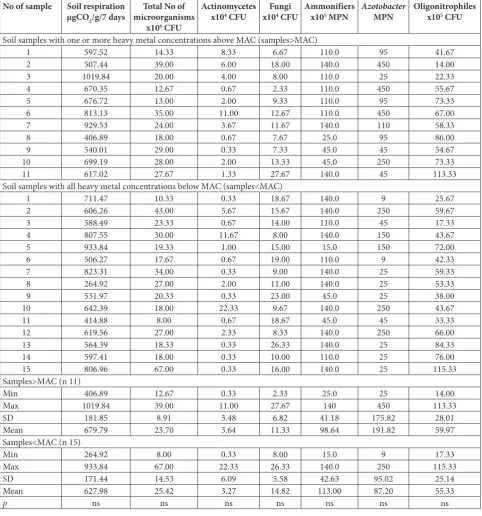
The concentrations of Ni ranged from 12.3 to 64.4 mg/ kg (mean 36.5±14.3), with elevated concentrations in 5 samples, while Pb was in the range from 13.0 to 184.1 mg/kg (mean 45.5±40.9), with 3 samples with heavy metal values above the MAC. Although below Table 3. Microbiological properties of soils.
No of sample Soil respiration µgCO2/g/7 days
Total No of microorganisms
x106 CFU
Actinomycetes
x104 CFU x10Fungi4 CFU Ammonifiersx105 MPN AzotobacterMPN Oligonitrophilesx105 CFU
Soil samples with one or more heavy metal concentrations above MAC (samples>MAC)
1 597.52 14.33 8.33 6.67 110.0 95 41.67
2 507.44 39.00 6.00 18.00 140.0 450 14.00
3 1019.84 20.00 4.00 8.00 110.0 25 22.33
4 670.35 12.67 0.67 2.33 110.0 450 55.67
5 676.72 13.00 2.00 9.33 110.0 95 73.33
6 813.13 35.00 11.00 12.67 110.0 450 67.00
7 929.53 24.00 3.67 11.67 140.0 110 58.33
8 406.89 18.00 0.67 7.67 25.0 95 86.00
9 540.01 29.00 0.33 7.33 45.0 45 54.67
10 699.19 28.00 2.00 13.33 45.0 250 73.33
11 617.02 27.67 1.33 27.67 140.0 45 113.33
Soil samples with all heavy metal concentrations below MAC (samples<MAC)
1 711.47 10.33 0.33 18.67 140.0 9 25.67
2 606.26 43.00 5.67 15.67 140.0 250 59.67
3 588.49 23.33 0.67 14.00 110.0 45 17.33
4 807.55 30.00 11.67 8.00 140.0 150 43.67
5 933.84 19.33 1.00 15.00 15.0 150 72.00
6 506.27 17.67 0.67 19.00 110.0 9 42.33
7 823.31 34.00 0.33 9.00 140.0 25 59.33
8 264.92 27.00 2.00 11.00 140.0 25 53.33
9 531.97 20.33 0.33 23.00 45.0 25 38.00
10 642.39 18.00 22.33 9.67 140.0 250 43.67
11 414.88 8.00 0.67 18.67 45.0 45 33.33
12 619.56 27.00 2.33 8.33 140.0 250 66.00
13 564.39 18.33 0.33 26.33 140.0 25 84.33
14 597.41 18.00 0.33 10.00 110.0 25 76.00
15 806.96 67.00 0.33 16.00 140.0 25 115.33
Samples>MAC (n 11)
Min 406.89 12.67 0.33 2.33 25.0 25 14.00
Max 1019.84 39.00 11.00 27.67 140 450 113.33
SD 181.85 8.91 3.48 6.82 41.18 175.82 28.01
Mean 679.79 23.70 3.64 11.33 98.64 191.82 59.97
Samples<MAC (n 15)
Min 264.92 8.00 0.33 8.00 15.0 9 17.33
Max 933.84 67.00 22.33 26.33 140.0 250 115.33
SD 171.44 14.53 6.09 5.58 42.63 95.02 25.14
Mean 627.98 25.42 3.27 14.82 113.00 87.20 55.33
p ns ns ns ns ns ns ns
the allowed limits, the concentrations of Cd, Cu and Zn were significantly higher in soil samples, with As, Ni and Pb concentrations above the MAC.
The soil samples were characterized by a slightly acidic or neutral reaction, with a medium level of hu-mus and total N content (Table 1). The available P content varied widely from very poor to high, while the available K content was high to harmful. All soils were of the vertisol or fluvisol soil type, with a clay-loamy texture (data not presented). Considering all the chemical characteristics, only the pH of the soil differed significantly between the soil samples with and without elevated heavy metal concentrations, and it was higher in soils with elevated heavy metal concentrations (Table 1). Positive correlations were detected among most of the evaluated metals (Table 4), as well as with other soil chemical characteristics, such as the pH, Ntot and P2O5.
Soil microbiological properties
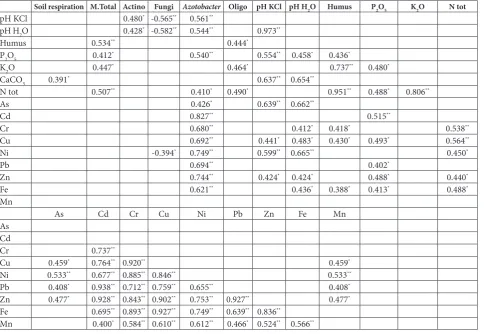
Soil respiration, as well as the number of all investi-gated microbial groups, did not significantly differ between the samples with heavy metal concentra-tions above and below the MAC (Table 3). The to-tal microbial number ranged from 8.00-67.00x10⁶ to 12.67-39.00x10⁶ CFU/g of dry soils in samples with heavy metal concentrations below and above the MAC, respectively. In addition, there were no nega-tive correlations between any of the microbial groups and heavy metals. The only exception was a negative correlation between the total number of fungi and the total Ni concentration (r=-394) (Table 4). Positive cor-relations between Azotobacter and most of the metals were noted. Soil respiration correlated positively with CaCO3, the total number of microorganisms with hu-mus, P, K, and the total N. Actinomycetes correlated Table 4. Significant Pearson’s correlation coefficients between soil microbiological properties, soil chemical characteristics and heavy metal concentrations.
Soil respiration M.Total Actino Fungi Azotobacter Oligo pH KCl pH H2O Humus P2O5 K2O N tot
pH KCl 0.480* -0.565** 0.561**
pH H2O 0.428* -0.582** 0.544** 0.973**
Humus 0.534** 0.444*
P2O5 0.412* 0.540** 0.554** 0.458* 0.436*
K2O 0.447* 0.464* 0.737** 0.480*
CaCO3 0.391* 0.637** 0.654**
N tot 0.507** 0.410* 0.490* 0.951** 0.488* 0.806**
As 0.426* 0.639** 0.662**
Cd 0.827** 0.515**
Cr 0.680** 0.412* 0.418* 0.538**
Cu 0.692** 0.441* 0.483* 0.430* 0.493* 0.564**
Ni -0.394* 0.749** 0.599** 0.665** 0.450*
Pb 0.694** 0.402*
Zn 0.744** 0.424* 0.424* 0.488* 0.440*
Fe 0.621** 0.436* 0.388* 0.413* 0.488*
Mn
As Cd Cr Cu Ni Pb Zn Fe Mn
As Cd
Cr 0.737**
Cu 0.459* 0.764** 0.920** 0.459*
Ni 0.533** 0.677** 0.885** 0.846** 0.533**
Pb 0.408* 0.938** 0.712** 0.759** 0.655** 0.408*
Zn 0.477* 0.928** 0.843** 0.902** 0.753** 0.927** 0.477*
Fe 0.695** 0.893** 0.927** 0.749** 0.639** 0.836**
Mn 0.400* 0.584** 0.610** 0.612** 0.466* 0.524** 0.566**
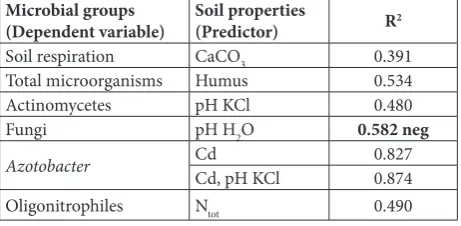
positively with soil pH, while fungi correlated nega-tively with soil pH. Oligonitrophiles correlated posi-tively with humus, K and total N (Table 4). Stepwise multiple regression analysis was used to investigate and model the relationships between the chemical and microbiological properties of soil samples, with the aim of identifying soil factors with the highest influence. Regression analyses of microbial groups and soil properties confirmed that the numbers of ac-tinomycetes and fungi were mostly influenced by the pH, soil respiration by the CaCO3, the total number of microorganisms by humus, while oligonitrophiles by the total N (Table 5). The number of Azotobacter
was under positive influence of Cd, and to a lesser extent the pH value.
DISCUSSION
In this study, elevated concentrations of one or more heavy metals were detected in 42% of the investigated parcels under intensive agricultural production. In most samples (30%), total As concentrations were el-evated above the MAC, Pb concentrations above the MAC were found in only 8% of samples, while Ni was slightly increased in 20% of the samples. Natural concentrations of As in soils are usually from 1 to 40 mg/kg, but can be much higher due to pesticide ap-plication or waste disposal [25]. In our research, the maximum detected As value was 43.4 mg/kg. Most solid foods contain low levels of As because plants (with some exceptions) hardly take up As from the soil, which indicates a low probability of food con-tamination due to soils exhibiting a small increase in
As concentration, as observed in this research [26]. Pb concentrations in soil are usually in the range from 1 to 30 mg/kg, while the MAC is 300 mg/kg for soils with pH>5.5 [27]. Plants grown in soil with elevated Pb usually accumulate Pb in roots, while lower con-centrations are expected in shoots [28]. The maximum total Ni concentration of 64 mg/kg detected here can be considered slightly increased, since the MAC of to-tal Ni for agricultural soils is 50 mg/kg [17]; elsewhere in the world, the MAC can range from 20-60 mg/kg to 100 or 200 mg/kg [29]. Taking this into account, the soils with elevated heavy metal concentrations inves-tigated here can be considered slightly contaminated. In the group of samples with increased total con-centrations of As, Ni, and Pb, the total concon-centrations of Cd, Cu, and Zn were also significantly higher. In addition, significant positive correlations were de-tected between almost all examined heavy metals. Elevated concentrations of metals were usually present in fluvisol soils; out of 11 fluvisol soils, elevated con-centrations of heavy metals were present in 7. This can indicate the geological origin of heavy metals in some soils [15] and the low probability of inclusion of these metals in the food chain. However, further investigation of available heavy metal concentrations in soil and their concentrations in plants should be conducted.
In our research, there were no differences in soil respiration, nor in the number of investigated groups of microorganisms between soil samples with and without elevated concentrations of heavy metals. Soil respiration is generally considered an important in-dicator of soil health because it indicates the level of microbial activity, soil organic matter content and its decomposition [30]. In previous research, As contami-nation had little influence on soil respiration and no significant toxicity effect at 1200 mg/kg [31]. In the same study, no toxic response was observed for 500 mg/kg and more of Pb in soils. On the other hand, a negative correlation of soil respiration and different enzyme activities in agricultural soils with increased heavy metal concentrations (Pb, Ni, Cu, Cr, Cd, Co) was detected [11]. However, in this study, the con-centrations of As, Pb and Ni were much higher than in our study. Ramsey et al. [32] reported that in situ
soil respiration correlated negatively and linearly to Table 5. Stepwise multiple regression of soil respiration and
mi-crobial groups and soil chemical properties (p < 0.05).
Microbial groups
(Dependent variable) Soil properties(Predictor) R2
Soil respiration CaCO3 0.391
Total microorganisms Humus 0.534
Actinomycetes pH KCl 0.480
Fungi pH H2O 0.582 neg
Azotobacter Cd 0.827
Cd, pH KCl 0.874
Oligonitrophiles Ntot 0.490
R2 – square of the coefficient of multiple correlation which indicates the
the concentrations of As, Cd, Cu, Pb and Zn, but only when they were much higher than the background levels that influenced changes in the structures of the microbial communities. Previously, significant de-creases in the total number of bacteria, fungi, actino-mycetes and asymbiotic nitrogen fixers was detected in the contaminated site where the concentrations of As and Pb were much higher when compared to our research, and high levels of Hg and Zn were also de-termined (As 1558, Pb 270, Hg 109, Zn 165 mg/kg of dry soil) [33]. In our study, the only weak negative correlation was observed between the number of fungi and total Ni concentrations. Similar to our research, Lenart-Boroń and Wolny-Koładka [34] did not detect any effects of elevated concentrations of some heavy metals, mainly Zn and Pb, on the numbers of some microbial groups (mesophilic bacteria, Azotobacter, actinomycetes, fungi) in soils. Niemeyer et al. [10] observed a negative correlation between soil respira-tion and total concentrarespira-tions of Pb, but not with Ni; in addition, ammonifiers correlated negatively with Cu, Fe, Mn, Zn, Cd, Cr, Pb, Ni.
Besides heavy metals, microbial communities are also influenced by other environmental factors [11]. One of the most important factors is soil pH [35, 36]. With pH decrease, the solubility of metals and their bioavailability increase. In our study, in samples with elevated metal concentrations, the pH was significant-ly higher as compared to the other samples; therefore, a lower availability of metals was expected and conse-quently a lower influence on microorganisms. Previ-ously, soils with higher pH values were less sensitive to the toxicity of some metals in terms of soil-respiration response [31]. In our research, there was a positive correlation between soil respiration and CaCO3 con-centration. In addition, regression analyses indicated CaCO3 as the most important factor that significantly accounts for variation in respiration (39%). A lower reduction in basal respiration in soils contaminated with Pb, Zn and Cu was detected in carbonate- com-pared to non-carbonate-containing soils [31], which indicates that respiration depends on soil type and present pollutants.
Positive correlations of Azotobacter numbers and all heavy metals (except Mn) were observed, includ-ing those with concentrations above the MAC (As, Ni, Pb) (Table 4). In addition, regression analysis of
all soil parameters showed that Azotobacter was posi-tively affected by increased Cd concentrations (82% variation explained). In previous studies, some heavy metals, such as As, Cd or Hg, positively influenced the number of bacteria, oligonitrophiles or fungi, but their concentrations were far below the MAC [37]. It was shown that the activity of certain soil enzymes increases in the presence of low concentrations of certain heavy metals, but that high metal concentra-tions inhibit their activity [38]. In our research, the investigated soils were either uncontaminated or only slightly contaminated, which could explain the estab-lished positive correlation between heavy metals and
Azotobacter.
The total number of microorganisms and oligo-nitrophiles correlated with soil chemical properties, mainly with the available nutrients (humus, P, K, total N). The humus content significantly contributed to the variation in the total number of microorganisms (53%) and the total N to oligonitrophiles (49%). There was a significant positive correlation between the pH and the number of actinomycetes and Azotobacter, while a negative correlation was observed between the soil pH and the number of fungi. Additionally, the numbers of actinomycetes and fungi were affected most by the pH (48% and 58%, respectively). Simi-larly, the number of fungi correlated negatively with soil pH (r=-0.707), while the number of actinomyc-etes correlated positively with soil pH (r=0.520) [39]. Previous studies suggested that the changes in soil microbiological properties were related to soil proper-ties (organic matter, P content) rather than to heavy metal concentrations [40].In addition, some findings suggested that native soil bacterial populations might have adapted to altered soil conditions, which can also be the case in our study [41]. It is noted that long-term exposure of microbial communities to heavy metals can influence their tolerance and adaptation to soil contamination. Soil organic matter is considered the main factor for high microbial enzyme activities in such soils and mitigation of heavy metal toxicity [42].
in soil, microorganisms may have developed toler-ance to their increased concentrations. The results of the study point out that heavy metal effects should be considered in the context of different soil properties, but further research should assess their contribution.
Acknowledgments: This research was supported by the Min-istry of Education, Science and Technological Development of the Republic of Serbia, Project TR37006, and the town of Vranje.
Author contributions: OSS and VM designed the study, per-formed statistical analyses, interpreted the results and wrote the manuscript. AB, NR, DjK, ZD and DD performed the experi-mental work.
Conflict of interest disclosure: None to declare.
ReFeReNCeS
1. Zhou L, Yang B, Xue N, Li F, Seip HM, Cong X, Yan Y, Liu B, Han B, Li H. Ecological risks and potential sources of heavy metals in agricultural soils from Huanghuai Plain, China. Environ Sci Pollut Res Int. 2014;21(2):1360-9.
2. Sarić Z. Praktikum iz mikrobiologije. Belgrade, Serbia: Naučna knjiga; 1989. 199 p. Serbian.
3. Giller KE, Witter E, McGrath SP. Toxicity of heavy metals to microorganism and microbial processes in agricultural soils: A review. Soil Biol Bichem. 1998;30(10-11):1389-414. 4. García-Orenes F, Morugán-Coronado A, Zornoza R, Scow
K. Changes in soil microbial community structure influ-enced by agricultural management practices in a Mediter-ranean agro-ecosystem. PLoS One. 2013;8(11):e80522. 5. Das SK, Varma A. Role of Enzymes in Maintaining Soil
Health. In: Shukla G, Varma A, editors. Soil Enzymology. Berlin, Heidelberg: Springer-Verlag; 2011. p. 25-42. (Soil Biology; 22)
6. Pankhurst CE, Hawke BG, McDonald HJ, Kirkby CA, Buck-erfield JC, Michelsen P, O’Brien KA, Gupta VVSR, Doube BM. Evaluation of soil biological properties as potential bio-indicators of soil health. Aust J Exp Agric. 1995;35(7):1015-28.
7. Masto RE, Pramod K, Singh CD, Patra AK. Changes in soil quality indicators under long-term sewage irrigation in a sub-tropical environment. Environ Geol. 2009;56:1237- 43. 8. Nielsen MN, Winding A. Microorganisms as Indicators of
Soil Health. Roskilde, Denmark: National Environmental Research Institute; 2002. 84 p. (Technical Report; no. 388). 9. Lenart A, Wolny-Koładka K. The effect of heavy metal
concentration and soil pH on the abundance of selected microbial groups within Arcelor Mittal Poland steelworks in Cracow. Bull Environ Contam Toxicol. 2013;90(1):85-90. 10. Niemeyer JC, Lolata GB, De Carvalho GM, Da Silva EM,
Sousa JP, Nogueira MA. Microbial indicators of soil health as tools for ecological risk assessment of a metal contaminated site in Brazil. Appl Soil Ecol. 2012;59:96-105.
11. Kizilkaya R, Aşkin T, Bayrakli B, Sağlam M. Microbiologi-cal characteristics of soils contaminated with heavy metals. Eurasian J Soil Sci. 2004;40:95-102.
12. Deng L, Zeng G, Fan C, Lu L, Chen X, Chen M, Wu H, He X, He Y. Response of rhizosphere microbial community struc-ture and diversity to heavy metal copollution in arable soil. Appl Microbiol Biotechnol. 2015;99(19):8259-69.
13. Oorts K, Ghesquiere U, Swinnen K, Smolders E. Soil proper-ties affecting the toxicity of CuCl2 and NiCl2 for soil micro-bial processes in freshly spiked soils. Environ Toxicol Chem. 2006;25(3):836-44.
14. Niklinska M, Chodak M, Laskowski R. Pollution-induced community tolerance of microorganisms from forest soil organic layers polluted with Zn or Cu. Appl Soil Ecol. 2006;32:265-72.
15. Mrvić V, Zdravković M, Sikirić B, Čakmak D, Kostić-Kravljanac Lj. Opasne i štetne materije u zemljištu. In: Mrvić V, Antonović G, Martinović Lj, editors. Plodnost i sadržaj opasnih i štetnih materija u zemljištima centralne Srbije. Monografija,Belgrade, Serbia: Institute of Soil Science; 2009. p. 75-144. Serbian.
16. Antonović G, Mrvić V, Perović V. Pedološka karta Srbije. Belgrade, Serbia: Institute of Soil Science; 2013. Serbian. 17. Pravilnik o dozvoljenim količinama opasnih i štetnih
materija u zemljištu i vodi za navodnjavanje i metodama njihovog ispitivanja. Official Gazette Rep Serb. 1994;23. („Službeni Glasnik RS”, broj 23/1994). Serbian.
18. ISO 13878:1998. Soil quality - Determination of total nitro-gen content by dry combustion (elemental analysis). 19. ISO 10694:1995. Soil quality - Determination of organic and
total carbon after dry combustion (elementary analysis). 20. Gee GW, Bauder JW. Particle size analyses. In: Klute A.
edi-tor. Method of soil analysis, Part 1 Physical and Mineralogi-cal Methods. 2nd ed. Madison, Wisconsin, USA: ASA and SSSA; 1986. p. 383-411.
21. ISO 22036:2008 Soil quality - Determination of trace ele-ments in extracts of soil by inductively coupled plasma - atomic emission spectrometry (ICP - AES).
22. Horwath WR, Paul EA, Harris D, Norton J, Jagger L, Hor-tont KA. Defining a realistic control for the chloroform fumigation-incubation method using microscopic 10 count-ing and l4C’substrates. Can J Soil Sci. 1996;76:459-67. 23. Govedarica M, Jarak M. Praktikum iz mikrobiologije. 2nd
ed. Novi Sad, Serbia: Faculty of Agriculture; 1996. Serbian. 24. Vojinovic Z, Prsa M, Petrovic V, Saric Z, Todorovic M.
Određivanje fizioloških grupa mikroorganizama i biološke sposobnosti zemljišta. In: Tesic Z, Todorovic M, editors, Priručnik za ispitivanje zemljišta. Knjiga II, Mikrobiološke metode ispitivanja zemljišta i voda. Belgrade, Yugoslavia: Yugoslav Society of Soil Science;1966. p. 32-41. Serbian. 25. Tchounwou PB, Centeno JA, Patlolla AK. Arsenic toxicity,
mutagenesis and carcinogenesis - a health risk assessment and management approach. Mol Cell Biochem. 2004;255(1-2):47-55.
27. Commission of the European Communities (CEC). Council directive on the protection of the environment, and in par-ticular of the soil, when sewage sludge is used in agriculture. Official J Eur Comm. 1986;L181/6.
28. Fahr M, Laplaze L, Bendaou N, Hocher V, El Mzibri M, Bogusz D, Smouni A. Effect of lead on root growth. Front Plant Sci. 2013;4:175.
29. Kabata-Pendias A, Pendias H. Trace Elements in Soils and Plants. 4th ed. Boca Raton: CRC Press; 2010. 548 p. 30. Soil Respiration - Soil Quality Kit: Guide for Educators.
2012. National Resources Conservation Service; [cited 2018 Jul 18]. Available from: https://www.nrcs.usda.gov/ Internet/ FSE_DOCUMENTS/nrcs142p2_053267.pdf.
31. Romero-Freire A, Sierra Aragón M, Martínez Garzón FJ, Martín Peinado FJ. Is soil basal respiration a good indicator of soil pollution? Geoderma. 2016;263:132-9.
32. Ramsey PW, Rilling MC, Feris KP, Gordon NS, Moore JN, Holben WE, Gannon JE. Relationship between communities and processes; new insights from a field study of a contami-nated ecosystem. Ecol Lett. 2005;8(11):1201-10.
33. Oliveira A. Pampulha ME. Effects of Long-Term Heavy Metal Contamination on Soil Microbial Characteristics. J Biosci Bioeng, 2006;102(3):157-61.
34. Lenart-Boroń A, Wolny-Koładka K. Heavy metal concen-tration and the occurrence of selected microorganisms in soils of a steelworks area in Poland. Plant Soil Environ.
2015;61(6):273-8.
35. Guo H, Nasir M, Lv J, Dai Y, Gao J. Understanding the varia-tion of microbial community in heavy metals contaminated soil using high throughput sequencing. Ecotox Environ Safe. 2017;144:300-6.
36. Zhalnina K, Dias R, De Quadros PD, Davisrichardson A, Camargo FA, Clark IM, Mcgrath SP, Hirsch PR, Triplett EW. Soil pH determines microbial diversity and composition in the park grass experiment. Microb Ecol. 2015;69(2):395-406 37. Stajković-Srbinović O, Delić D, Rasulić N, Kuzmanović Dj, Houšková B, Sikirić B, Mrvić V. Microorganisms in soils with high nickel and chromium concentrations in Western Serbia. Pol J Environ Stud. 2017;26(4):1663-71.
38. Florea AM, Busselberg D. Occurrence, use and potential toxic effects of metals and metal compounds. Bio Metals. 2006;19(4):419-27.
39. Pečiulytė D, Dirginčiutė-Volodkienė V. Effect of long-term industrial pollution on soil microorganisms in deciduous forest situated along pollution gradient next to a fertilizer factory. 1. Abundance and diversity of soil fungi. Ekologija. 2009;55(2):131-9.
40. Pessoa-Filho M, Barreto CC, Dos Reis Junior FB, Fragoso RR, Costa FS, De Carvalho Mendes I, de Andrade LRM. Microbiological functioning, diversity, and structure of bacterial communities in ultramafic soils from a tropical savanna. Antonie Van Leeuwenhoek. 2015;107(4):935-49. 41. Azarbad H, Van Gestel CAM, Niklińska M, Laskowski R,
Röling WFM, Van Straalen NM. Resilience of Soil Micro-bial Communities to Metals and Additional Stressors: DNA-Based Approaches for Assessing “Stress-on-Stress” Responses. Int J Mol Sci. 2016;17(6):933.