GREEN SYNTHESIS OF SILVER NANOPARTICLES BY THE
ACTION OF BLACK OR GREEN TEA INFUSIONS ON SILVER
IONS
Franco Cataldo
[a]*Key Words: Green synthesis; Black tea infusion; Green tea infusion; Tea polyphenols; Silver nanoparticles; Colloidal silver; Particle size distribution; Z-potential; antibacterial properties.
Silver nanoparticles were obtained by the reduction of Ag+ ions through the action of black tea or green tea infusions. Also decaffeinated
tea infusion is able to produce silver nanoparticles. The tea polyphenols present in the black and green tea are able not only to reduce silver ions but also to stabilize the resulting nanoparticles acting as “capping agents”. The surface plasmon resonance characteristic absorption band of silver nanoparticles was used to monitor the reduction kinetics of silver in black and green tea infusions respectively. It was found a faster reduction kinetics in green tea infusion. Dynamic light scattering (DLS) was used for the determination of the average diameter of the silver nanoparticles which were found of 20.8 nm in green tea infusion and 78.7 nm in black tea infusion. For comparison the average diameter of silver nanoparticles obtained in tannin was found at 55.7 nm. DLS was also used for the determination of the Z-potential of the silver colloidal dispersions in black and in green tea infusions. The results show that stable suspension are obtained since the tea polyphenols act also as capping and stabilizing agents of the nanoparticles. The bactericidal properties of silver nanoparticles in both black and green tea infusions were confirmed on the Gram(-) bacterium P. Aeruginosa. Instead, the silver nanoparticles in both black and green tea infusions are not effective against the spores of B. Subtilis.
* Corresponding Authors
E-Mail: [email protected]
[a] Actininium Chemical Research srl, Via Casilina, 1626A, 00133 Rome, Italy
Introduction
The synthesis of metal nanoparticles in general and silver nanoparticles in particular represents a promise with potential applications in dermatology, cosmetics, pharmacology but also in catalysis and nanotechnology in general.1-3 The interest on silver nanoparticles has its roots on the antibacterial and antiviral properties of colloidal silver which is also effective against fungi and protozoa.1-3 A number of papers were dedicated to different synthetic approaches and to the characterization of different types of silver nanoparticles and numerous reviews are available summarizing the most relevant progresses and potential applications .4-11
Particularly innovative and under great expansion is the topic of green synthesis of silver nanoparticles using readily available reducing agents and capping agents taken from plants and hence from renewable sources. In view of the potential and safe application of silver nanoparticles it is necessary to have a green approach in their synthesis which means that it is fundamental to use solvents, reducing and capping agents which are completely safe for the mammalians and for the environment. Other aspects of a green synthesis require that the selected reagents are easily accessible (possibly from renewable sources), widely distributed, safe to handle and able to minimize the waste and energy costs. More in detail, the green synthesis of silver nanoparticles involves the utilization of biological systems such as yeast, fungi, bacteria and plant extracts 4-11
instead of the conventional chemical reducing agents1-4 and other approaches like photon irradiation, electrosputtering, electrochemical reduction, sonication, laser ablation .1-4,12
The successful use of plant extracts as reducing and capping agents of silver colloidal solutions is covered by recent reviews4-11 and by several recent papers.12-25
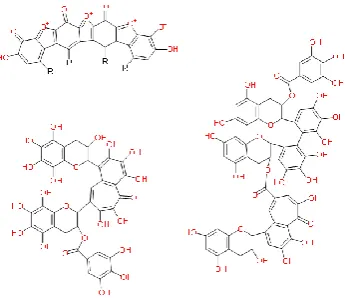
Chart 1. Examples of tannin structures. Gallic acid ester (left) and proantocyanidin (right)
reducing and capping agent.12 After the work on tannic acid ,12 it was a logical consequence for us to study both the black and green tea tannins as reducing and stabilizing agents of silver nanoparticles and the present work represent a full account of such work. Black tea polyphenols were already reported in literature as effective reducing agents for the synthesis of silver nanoparticles28-43 but in the current work we will present a very simple and effective synthetic approach using a simple black tea beverage as reducing agent. Furthermore, we will show that decaffeinated black tea is still an effective reducing and capping agent for the production of colloidal silver solutions. Finally, we will show also the effectiveness in silver nanoparticles production of the green tea beverage. In all cases the resulting colloidal silver solutions can be prepared at high concentration and are stable.
Experimental
Materials and equipment
The black tea used in the present work was a commercially available black tea from Ati a subsidiary of Unilever Italia (Rome, Italy). Similarly, the green tea used in the present work was from Lipton another subsidiary of Unilever Italia (Rome, Italy). The decaffeinated tea adopted in this work was instead from Star spa (Milan, Italy). The electronic absorption spectra were studied using a Shimadzu UV 2450 spectrophotometer using thermostatically controlled quartz cuvettes kept at 20 °C. The reference cuvette was always filled with distilled water. The colloidal silver particle size diameter and the relative Z-potential were measured on a dynamic light scattering: Zetasizer-7 from Malvern. The bactericidal properties of the colloidal solutions of silver nanoparticles in black and in green tea were tested following UNI EN 1040 test method on P. Aeruginosa. The sporicidal properties of of the colloidal solutions of silver nanoparticles in black and in green tea were tested following UNI EN 13704 test method on spores of B. Subtilis.
Reduction of Ag+ with black tea infusion (50 mg L-1 Ag)
A black tea bag of 1.5 g was left for 20 min in 250 ml of distilled boiling water. After cooling to room temperature, 60 ml of the infusion were taken with a pipette and diluted to 500 ml in a volumetric flask and hand-shaken to homogenize the dilution. The pH of the resulting solution was neutral and was make alkaline by adding a very small portion of potassium carbonate (K2CO3) until a pH = 10 was reached. Separately a stock solution of 54 mg of AgNO3 in 200 ml of distilled water was prepared.
Two experiments were performed. The first experiment was designed to illustrate the reduction of Ag+ with black tea tannins. From the alkalinized 500 ml stock solution at pH = 10 were taken 80 ml which were transferred in a magnetically stirred flask. Stirring was set at the minimum possible speed. The stock solution of AgNO3 was added in portions of 5 ml per time. After each addition the solution was stirred and then the resulting electronic absorption
spectrum was recorded. The progress of silver nanoparticles production was followed with the progressive addition of the AgNO3 solution.
The other experiment was aimed at measuring the reduction kinetics according to the following approach. From the alkalinized 500 ml stock solution at pH = 10 were taken 50 ml which were transferred in a magnetically stirred flask. Then 20 ml of the AgNO3 stock solution were added in a single shot. The growth of the surface plasmon resonance band of the separated silver nanoparticles was monitored spectrophotometrically as function of time.
Reduction of Ag+ with black tea infusion (85 mg L-1 Ag)
A black tea bag of 1.5 g was left for 20 min in 500 ml of distilled boiling water. After cooling to room temperature the pH was adjusted to 10 by adding a small amount (≈ 500 mg) of K2CO3. Then AgNO3 (67 mg) were added directly into the tea infusion, dissolved completely and left in the dark overnight. The solution was very dark and for the spectrophotometric measurements a samples taken from the solution were diluted 1:100, 1:10, 1:5 and 1:2.5 with distilled water and the resulting spectra were measured with the purpose of the determination of the molar extinction coefficient.
Reduction of Ag+ with black tea infusion (234 mg L-1 Ag)
The same procedure described in the preceding paragraph was followed. The unique difference is the amount of AgNO3 added directly into the black tea infusion: 184 mg corresponding to 234 mg L-1 of Ag.
Reduction of Ag+ with decaffeinated black tea infusion (286 mg
L-1 Ag)
The same procedure described in the preceding paragraph was followed. The unique differences are the use of a 1.5 g of decaffeinated tea bag instead of black tea bag and the amount of AgNO3 added directly into the decaffeinated black tea infusion: 225 mg corresponding to 286 mg L-1 of Ag. The absence of caffeine and other xanthines in the infusion does not impair reducing power of the tea infusion.
Reduction of Ag+ with green tea infusion
A green tea bag of 1.3 g was left for 20 min in 200 ml of distilled boiling water. After cooling to room temperature, 60 ml of the infusion were taken with a pipette and diluted to 500 ml in a volumetric flask and hand-shaken to homogenize the dilution. The pH of the resulting solution was 6 and was make alkaline by adding a very small portion of potassium carbonate (K2CO3) until a pH=10 was reached. Separately a stock solution of 54 mg of AgNO3 in 200 ml of distilled water was prepared.
Reduction of Ag+ with green tea infusion (186 mg L-1 Ag)
A green tea bag of 1.3 g was left for 20 min in 500 ml of distilled boiling water. After cooling to room temperature the pH was adjusted to 10 by adding a small amount (≈ 500 mg) of K2CO3. Then AgNO3 (147 mg) were added directly into the tea infusion, dissolved completely. The solution turned from yellow-amber color into dark-brown and was left in the dark overnight. The solution was very dark and for the spectrophotometric measurements a samples taken from the solution were diluted 1:100, 1:40, 1:25, 1:10 and 1:6.6 with distilled water and the resulting spectra were measured with the purpose of the determination of the molar extinction coefficient.
Reduction of Ag+ with green tea infusion (286 mg L-1 Ag)
The same procedure described in the preceding paragraph was followed. The unique difference are the amount of green tea (2.6 g instead of 1.3) and the amount of AgNO3 added directly into the black tea infusion: 225 mg corresponding to 286 mg L-1 of Ag.
Results and Discussion
Colloidal silver production with black tea infusion
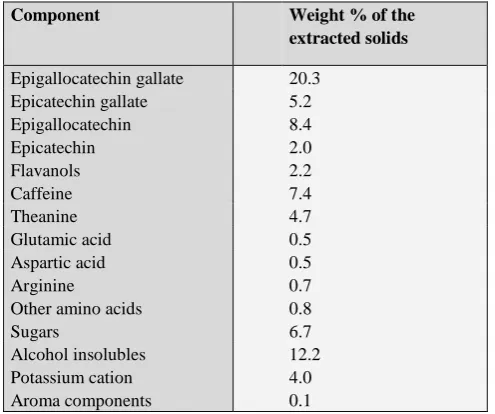
The components of black tea beverage are reported in Table 144,45 and consist of a mixture of different type of molecules.
Table 1. Composition of black tea beverage
The main component (about 36%) is represented by thearubigins (see Chart 2) whose chemical structure is polyphenolic in nature, very complex and not yet fully understood.45-47
Chart 2. Proposed structures for thearubigins present in black tea45-48
Chart 3. Epicatechins and Teaflavins present in black and green tea44
Initially it was thought that thearubigins were characterized by a high molecular weight, instead recent investigations45-47 have clarified that thearubigins consist of a rich mixture of oligomers with molecular weight around 2x10³ Da derived from the oxidation of tea catechins and theaflavins (see Chart 3). The other important component of black tea beverage (see Table 1) are the catechins like for example catechin, gallocatechin, epicatechin and epigallocatechin (the last two also esterified with gallic acid) and the flavanols (see Chart 3).
All these substances are reducing agents but also the minor components of black tea beverage like gallic acid and chlorogenic acid, the sugars and polysaccharides, the lipids, the peptides and amino acids may act as reducing agents for the silver ion into silver lyosol and especially as capping agents which means that these substances are able to coordinate and coat the silver nanoparticles stabilizing them in the colloidal state. Indeed the standard electrochemical potential (vs Standard Hydrogen Electrode) for epigallocatechin is +430 mV while epicatechin exhibits a potential of +560 mV and theaflavin +510 mV.48 Such electrochemical potentials should be compared with that of silver EAg+/Ag = +799.6 mV and it is immediately evident that the catechins and the flavins present in tea are effective reducing agent of silver ions.
Components Extracted solids
(weight %)
Thearubigins 35.8 Theaflavins 2.6 Catechins 11.2 Gallic acid 1.1 Chlorogenic acid 0.2 Caffeine 7.5 Theobromine 0.7 Oxalic acid 1.5 Mixture of aliphatic acids 1.2 Lipids and waxes 4.8
Sugars 6.9
Polysaccharides 4.2
Pectin 0.2
Furthermore the antioxidant properties of green and black tea leaf and extracts were studied by electron spin resonance (EPR) technique putting in evidence an higher content of semiquinone radicals in black tea in agreement with its preparation through an oxidative enzymatic process.49 Another EPR study has evidenced that the antioxidant power (thus, its reducing power) of green tea is higher than that of black tea as expected.50 The antioxidant activity of black and green tea was also studied with a fluorescence assay and has confirmed the greatest antioxidant activity for green tea.51 Among the black teas a distinction was made between Orthodox black tea which is hand-processed and the CTC black tea which is the common machinery processed tea used in tea bags. At the fluorescence assay the Orthodox black tea gives the same antioxidant response as the green tea while the CTC black tea gives about 50% lower antioxidant activity.51 Another interesting aspect studied by Carloni and colleagues51 regard the tea chelating activity for ferrous ions. It was found that the highest chelating activity is offered by Orthodox black tea followed by the CTC black tea while the lowest chelating activity was found in the case of green tea. The chelating activity is related to the ability of a given tea to stabilize the silver nanoparticles: higher chelating activity means better colloid stabilization.
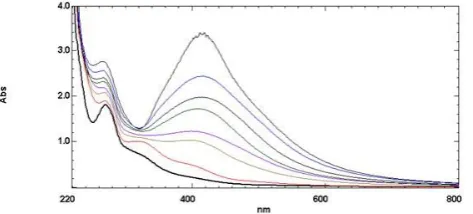
Figure 1. Electronic absorption spectra (curves from bottom to top): diluted black tea infusion as detailed in the experimental section (black thick line); after K2CO3 addition to pH=10 (red
line); after addition of 5, 7, 10, 15, 20 and 25 ml of AgNO3
respectively, there is the growth of the silver nanoparticle absorption band at about 414 nm.
With all the above premises it was not a surprise to observe the reduction of silver nitrate by black tea infusion as shown in Fig. 1. It was performed as detailed in the experimental section by adding AgNO3 solution to an alkalinized tea infusion. It is important to note that it was necessary to bring the pH of the tea infusion to 10 by the addition of small amounts of K2CO3 to observe the Ag+ reduction. In neutral conditions the addition of AgNO3 does not lead to any separation of Ag nanoparticles. The evidence of the synthesis of silver nanoparticles is offered by the development of the absorption band at 393.7 nm which grows in intensity as function of the AgNO3 added and which is shifted toward 408.6 nm and then to 414.4 nm. The band at 394-414 nm is due exclusively to the formation of silver nanoparticles in the solution and is attributed to collective excitation of the electron gas in each particle due to the periodic change of the electron density at the surface modulated by the electromagnetic field of the incident radiation. Such absorption band is known as surface plasmon resonance absorption band.1,3,4,6,12 Fig 2 shows the linear growth of the surface plasmon resonance of silver nanoparticles as function of the amount of silver ions added
to the black tea infusion. To each silver ions addition corresponds an increment in the intensity of the absorption band due to silver nanoparticles. This implies a reduction of silver ions according to the reaction Ag+ + e- Ag° such reaction is promoted by the polyphenols, the catechins and the flavonols present in the black tea infusion.
Figure 2. Linear growth of the surface plasmon resonance band at about 410 nm due to the formation and accumulation of colloidal Ag nanoparticles reduced by black tea infusion. In the abscissa the silver concentration added to the stock tea solution. The absorbance values are those of Fig. 1 corrected for the absorption of the starting solution without silver.
To measure the reduction kinetics of silver ions to silver nanoparticles the experiment reported in the experimental section (second part) was designed. It consisted in the addition of a known amount of silver nitrate into the alkalinized black tea infusion measuring the time needed for the growth of the band at about 414 nm associated to the formation of silver nanoparticles. The data of this experiment are shown in Fig. 3 in a graph where the ln of the absorbance ratio at about 410 nm measured at any time
At and at the beginning of the experiment A0 are plotted against the reaction time t (in s). All the experimental data are fitted by the logarithm equation
(1)
where
A0= initial absorbance
At= absorbanec at the t moment
Suggesting a more complex kinetic law than the pseudofirst order. However, it is possible to consider only the first tract of the curve where the data are reasonably linear as shown by the red line in Fig. 3. For these early stages of reaction the pseudofirst reaction kinetics principle can be applied so that:
(2)
where A0 and At are the same as in Eqn.1.
Consequently the rate constant of this tract is kblack=9.44 x10⁻⁴ s-1.
0
lnAt 0.4646 lnt 2.3546
A
4
0
lnAt 9.44.10 t
A
Figure 3. Kinetics of the reduction of Ag+ by alkalinized black tea
infusion. The entire process does not conform to the pseudofirst reaction kinetics law unless one considers only the first stages of the reaction as shown in the figure.
Colloidal silver production with green tea infusion
As already discussed in the experimental section the reducing power of green tea is higher than that of the common CTC black tea and only the Orthodox black tea may be comparable in reducing power to the green tea.49-51 The reason of the higher reducing power of the green tea is very simple: its catechins and flavanols components (see Chart 3) have not undergone the enzymatic oxidation process which is instead subjected the black tea components.44 In Table 2 are summarized the main green tea components present in a green tea infusion44, 52 and it is evident the absence of the polyphenolic fraction known as thearubigins which are instead present in the black tea infusion. Consequently it is plain to expect that green tea is able to reduce Ag+ ions, but again, it is recommended to alkalinize also green tea infusion to pH=10 prior to add a silver salt for the reduction. It has been found that the green tea infusions are slightly more acidic than the black tea infusions since the typical pH of the former is about 6 against 7 found in the black tea infusion.
Table 2. Composition of green tea beverage
Component Weight % of the
extracted solids
Epigallocatechin gallate 20.3 Epicatechin gallate 5.2 Epigallocatechin 8.4 Epicatechin 2.0 Flavanols 2.2 Caffeine 7.4 Theanine 4.7 Glutamic acid 0.5 Aspartic acid 0.5 Arginine 0.7 Other amino acids 0.8 Sugars 6.7 Alcohol insolubles 12.2 Potassium cation 4.0 Aroma components 0.1
Fig. 4 shows the electronic absorption spectra of green tea infusion at the dilution reported in a previous. In these conditions the green tea infusion shows only a shoulder at 325 nm.
When the pH of the green tea infusion is brought to 10, the shoulder at 325 nm becomes a peak. The subsequent addition of AgNO3 solution in portions of 2.5 ml per time or 5 ml per time leads to the development of the absorption band associated to the formation of silver nanoparticles, the surface plasma resonance band. Initially the peak of such band was found at 410 nm but gradually the peak shifted to longer wavelengths as the concentration of silver nanoparticles was increased reaching the final value of 416 nm.
Figure 4. Electronic absorption spectra (curves from bottom to top): diluted green tea infusion as detailed in the experimental section (black thick line); after K2CO3 addition to pH=10 (red
line); after addition of known volumes of AgNO3 there is the
growth of the silver nanoparticle absorption band at about 415 nm.
The kinetics of Ag+ ions reduction to silver nanoparticles exerted by the green tea infusion is described in the experimental section. Also in the case of green tea infusion the pseudofirst kinetic law is followed only in the first stages of the reduction and graphs similar to that shown in Fig. 3 can be obtained. The pseudofirst order kinetic rate constant for green tea infusion reduction of Ag+ ions was found about one order of magnitude larger than that measured previously on black tea: kgreen = 8.9x10⁻³ s-1.
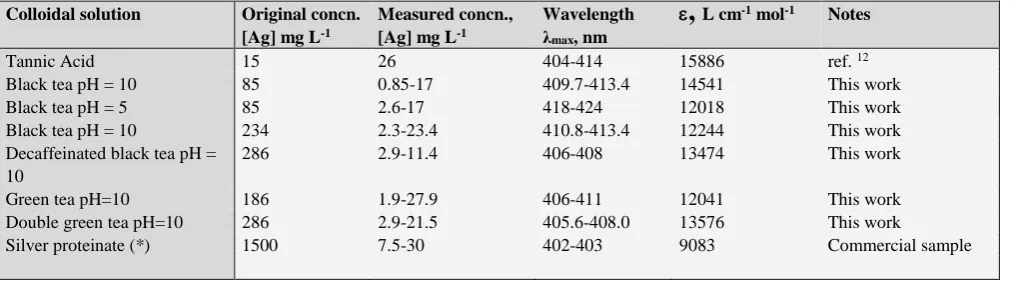
Molar extinction coefficient of the silver nanoparticles produced under different conditions
Table 3. Molar extinction coefficients () of the Ag nanoparticles
(*) Absorption max at 402 nm
This explains why the surface plasmon resonance band of silver nanoparticles reduced with green tea infusion shows an initial band at 410 nm and then, with further Ag+ reduction the band is red shifted to 416 nm. Similarly, in the black tea infusion the silver nanoparticles start from a surface plasmon resonace band at 394 nm which reaches 414 nm at the completion of the reduction.
The measurement of the molar extinction coefficient of silver nanoparticles was performed as detailed in the experimental section for black tea, for decaffeinated black tea and for green tea. The procedure involved the preparation of a tea infusion in 500 ml of distilled water, the alkalinization of the infusion to pH=10 through the addition of K2CO3 and then by the addition of AgNO3 in the desired amounts as specified in the mentioned experimental sections and as summarized in Table 3. Under these conditions the solutions were too dark for any spectrophotometric measurements and therefore known volumes of the colloidal solutions were diluted with distilled water and the absorbance at about 410-415 nm was determined. In general three different dilutions were performed and the average molar extinction coefficient was taken and reported in Table 3 using the Lambert-Beer law:
ε = Ab-1c-1 (3)
The molar extinction coefficient ε ( in L cm-1 mol-1) of silver nanoparticles was determined assuming the complete reduction of the Ag+ ions added and being b (expressed in cm) the path length of the quartz cuvette used for the measurement and c (in mol L-1) the silver concentration.
In the measurement range comprised in the interval of 0.5-30 mg L-1 of Ag the ε value of each sample studied was found practically constant and the average measured value is reported in Table 3. The highest ε = 15886 L cm-1 mol-1 was measured on the silver nanoparticles reduced with tannic acid in a previous work but the wavelength range of the surface plasmon resonance is comparable to that found on the silver nanoparticles reduced in black and green tea.12 As a general comment, the Ag nanoparticles in black tea infusion tend to have the surface plasmon resonance band slightly red shifted in comparison to the analogous samples prepared in green tea infusion. This fact combined with a general trend to slight higher molar extinction coefficient ε values for the Ag nanoparticles in black tea infusion, already
anticipates that the average diameter of the silver nanoparticles in black tea infusion should be larger than that of the Ag nanoparticled in green tea infusion (see next section).
As shown in Table 3, in one case we have changed the pH of the silver/black tea colloidal solution bringing it from 10 down to 5. No precipitations or phase separations were observed in the colloidal suspension upon acidification, however the spectrophotometric analysis revealed red shift of the silver nanoparticles absorption band from 410-414 nm at pH=10 to 418-424 nm at pH=5 this red shift is consistent with the phenomenon of silver particles aggregation and growth.1 The molar extinction coefficient dropped from an initial value of ε = 14541 L cm-1 mol-1 in the basic lyosol to ε = 12018 L cm-1 mol-1 in the acidified solution suggesting a light etching of the surface of the silver nanoparticles.
Decaffeinated black tea is able to reduce Ag+ ions in the same way as the normal black tea (see Table 3). This implies that the silver reduction is due to the polyphenols, catechins and flavanols and not by caffeine and theobromin. The molar extinction coefficient of the silver nanoparticles in decaffeinated black tea is ε = 13474 L cm-1 mol-1, a value completely inside the ε values range measured in different black tea samples.
For comparison Table 3 reports also the molar extinction coefficient measured on a commercial sample of silver proteinate, a commercial antiseptic where silver is reduced and stabilized to nanoparticles by the action of egg albumin protein. Silver proteinate shows an ε = 9083 L cm-1 mol-1, a value significantly lower than the ε values measured on all silver colloidal solutions prepared in black and green tea. Furthermore, the λmax value of the surface plasmon resonance band of silver proteinate was found at only 402 nm. The combined data of ε and λmax suggest a smaller particle size for silver proteinate than the silver nanoparticles prepared by black or green tea infusions.
Another information which can be gained from the electronic absorption spectra of silver nanoparticles is the shape of the particles. Krutyakov et al.1 discuss in detail this aspect considering different forms of silver nanoparticles (spheroidal, cylindrical, polyhedral) and presenting the corresponding electronic absorption spectrum . The spherical silver nanoparticles display the simplest electronic absorption spectrum with the a single surface plasmon resonance band as those shown in Fig. 1 and Fig. 4.
Colloidal solution Original concn. [Ag] mg L-1
Measured concn., [Ag] mg L-1
Wavelength λmax, nm
,
L cm-1 mol-1 NotesTannic Acid 15 26 404-414 15886 ref. 12
Black tea pH = 10 85 0.85-17 409.7-413.4 14541 This work Black tea pH = 5 85 2.6-17 418-424 12018 This work Black tea pH = 10 234 2.3-23.4 410.8-413.4 12244 This work Decaffeinated black tea pH =
10
Table 4. Average diameter, polydisperison index and zeta potential of Ag nanoparticles
Colloidal solution Average diameter, nm Polydispersion index Z-potential in mV Notes
Tannic Acid 55.7 0.303 -33.0 ref.12
Black tea pH = 10 78.7 0.560 -31.0 This work Green tea pH = 10 20.8 0.370 -29.8 This work
All the other silver nanoparticles forms display a more complex spectrum with additional bands and sub-bands or with the main peak shifted at longer wavelengths. Based on the spectra recorded on the silver nanoparticles reduced with tannic acid, black and green tea infusions it can be concluded that in all cases considered in the present work, spherical particles were produced.
Particle size of silver nanoparticles
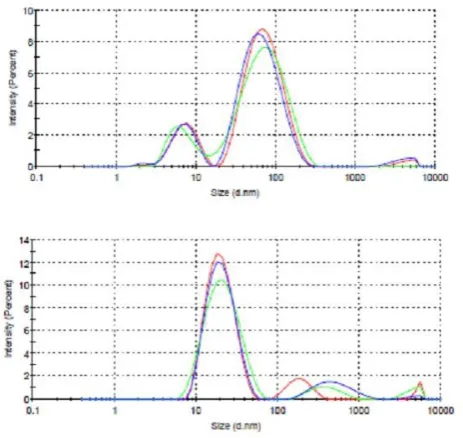
The Dynamic Light Scattering (DLS) analytical technique measures the Brownian motion of nanoparticles whose speed of motion (or diffusion constant), is linked to particle size through the Stokes–Einstein equation. Using the Malvern Zetasizer the silver colloidal suspensions were analyzed both in the black tea and in the green tea infusions as detailed in the experimental section. The results of such analysis are shown in Fig. 5.
Figure 5. Dynamic light scattering analysis of the particle size distribution of the silver nanoparticles produced in black tea and in green tea infusion as detailed in the experimental section.
The particle size distribution is broader (polydispersion index 0.560) and centered at about 78 nm in the case of the silver colloidal nanoparticles in black tea while the distribution is narrower (polydispersion index 0.370) in the case of silver colloidal nanoparticles in green tea with the average size at about 20.8 nm. All the data are summarized in Table 4.
For comparison are reported also the polydispersion index (0.303) and the average size distribution of the silver nanoparticles produced in tannic acid in a previous work.12
The catechins and favanols in green tea are able to produce smaller silver nanoparticles and with a narrower distribution than the thearubigins polyphenols present in the black tea which instead give higher average diameter and broader particle size distribution. Of course these data are more direct and precise than the analysis made with the electronic absorption spectroscopy which indeed suggested smaller particle size for the Ag nanoparticles in green tea (λ = 406-410 nm and ε = 13576 L cm-1 mol-1) than in black tea (λ = 410-413 nm and ε = 14541 L cm-1 mol-1).
Stability of the colloidal silver in black and green tea
Zeta (ζ) potential is the potential difference between the medium where the particles are dispersed and the stationary layer of fluid attached to the surface of each particle by mean of electrostatic interactions, dispersion forces, hydrogen bond [53,54]. The zeta potential indicates the degree of repulsion between adjacent, similarly charged particles in a dispersion. A high Z-potential will confer stability to the colloidal dispersion. This means that the dispersion will resist aggregation of its particles.53,54 When the Z-potential is low, attraction exceeds repulsion and the dispersion will break and flocculate. So, colloids with high Z-potential (negative or positive) are electrically stabilized while colloids with low Z-potentials tend to coagulate or flocculate.53,54 Using the Malvern Zetasizer we have measured also the Z-potential of the silver colloidal nanoparticles in black tea, green tea and those obtained with tannic acid in a previous work12 for comparison. All the results are reported in Table 4. A colloidal suspension is considered stable if the Z-potential ≥ |25| mV. Of course this limit is a convention and ±25 mV is the limit that arbitrary separates low-charged surfaces from highly charged surfaces. Table 4 shows that the Z-potential of Ag nanoparticles in black tea have ζ = -31 mV while such value is slightly lower in the case of Ag nanoparticles in green tea have ζ = -29.8 mV probably for the lower coordination ability of green tea catechins and flavanols in comparison to the higher coordination ability of thearubigins present only in the black tea. Anyway both silver colloidal dispersion either in black or in green tea exhibit more than satisfactory stability. Silver nanoparticles in tannic acid are even slightly better stabilized since ζ = -33 mV and this could be again attributed to a better ability of tannins to coat or to act as capping agents of the silver nanoparticles preventing the undesired aggregation and flocculation.
Evaluation of bactericidal and sporicidal effect of silver nanoparticles in black and in green tea
Table 5. Evaluation of bactericidal activity according to UNI EN1040 on P. Aeruginosa
Colloidal Ag in Black Tea [Ag] = 186 mg L-1 Contact time 5 min Contact time 10 min Contact time 15 min
[Ag] = 186 mg L-1 270 cfu R=5log 250 cfu R=5log <10 cfu R>5log
[Ag] = 3.72 mg L-1 >300 cfu R<5log 200 cfu R>5log <10 cfu R>5log
[Ag] = 1.86 mg L-1 >300 cfu R<5log 250 cfu R=5log <10 cfu R>5log
Colloidal Ag in Green Tea [Ag] = 233 mg L-1
[Ag] = 233 mg L-1 370 cfu R<5log 230 cfu R=5log <10 cfu R>5log
[Ag] = 4.66 mg L-1 400 cfu R<5log 200 cfu R=5log <10 cfu R>5log
[Ag] = 2.33 mg L-1 410 cfu R<5log 250 cfu R=5log <10 cfu R>5log
Note: cfu = colony forming unit
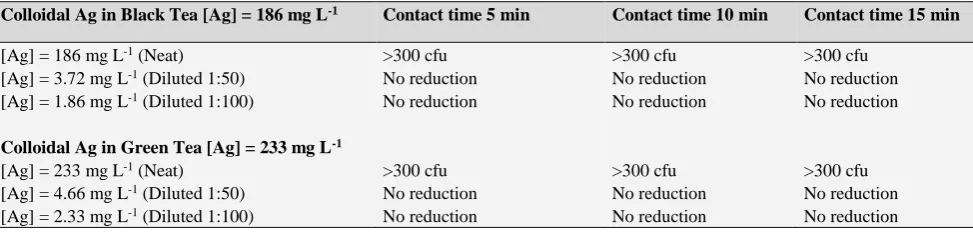
Table 6. Evaluation of sporicidal activity according to UNI EN 13704 on spores of B. Subtilis
Colloidal Ag in Black Tea [Ag] = 186 mg L-1 Contact time 5 min Contact time 10 min Contact time 15 min
[Ag] = 186 mg L-1 (Neat) >300 cfu >300 cfu >300 cfu
[Ag] = 3.72 mg L-1 (Diluted 1:50) No reduction No reduction No reduction
[Ag] = 1.86 mg L-1 (Diluted 1:100) No reduction No reduction No reduction
Colloidal Ag in Green Tea [Ag] = 233 mg L-1
[Ag] = 233 mg L-1 (Neat) >300 cfu >300 cfu >300 cfu
[Ag] = 4.66 mg L-1 (Diluted 1:50) No reduction No reduction No reduction
[Ag] = 2.33 mg L-1 (Diluted 1:100) No reduction No reduction No reduction
Note: cfu = colony forming unit
Even at high dilution the Ag+ ions bind to the –SH groups of enzymes inhibiting their activity and also causing the denaturation of proteins.55 Silver also reacts with the amino-, carboxyl-, phosphate-, and imidazole-groups and diminish the activities of lactate dehydrogenase and glutathione peroxidase.55 Furthermore, silver nanoparticles may attach to the surface of membrane cell disturbing permeability and respiration function of the cell. Smaller Ag nanoparticles are more effective bactericidal that the larger nanoparticles since they can penetrate the bacterial cells and causing the distruption of the cell walls thereby causing the production of free radicals including ROS (reactive oxygen species).1,4,6,9,10,55 The oligodynamic effect has been observed in living cells, algae, molds, spores, fungi, viruses, prokaryotic and eukaryotic microorganisms however silver nanoparticles are not very effective against viruses and especially against spores.55
In the present work, we have evaluated the silver nanoparticles solutions both in black and in green tea against the Gram-negative bacterium Pseudomonas Aeruginosa.
The test was conducted following the standard procedure UNI EN 1040 and the test results are summarized in Table 5. As expected, both silver nanoparticles solutions in black and in green tea infusion are effective toward P. Aeruginosa: even at the highest dilution adopted 1:100 the ufc was <10 with 15 min contact time. It is important also to emphasize that tea polyphenols are recognized antimicrobial agents.56 In particular epigallocatechin gallate and epicatechin gallate are reported to be the most effective agents.56 Synergistic effects of tea polyphenols with antibiotics were also reported.56 In our specific case it possible synergistic effects between the silver nanoparticles and the tea polyphenols could be expected. Tea polyphenols are also effective antivirus agents56 and may compensate the lower activity of
silver against viruses when combination of silver nanoparticles and tea infusion are used. Finally, it has also been demonstrated that tea polyphenols are effective against fungi and molds and their combination with silver should be certainly synergistic.56
Particularly interesting is the activity of tea polyphenols against Clostridium and Bacillus spores. Spores are known to be extremely resistant toward antimicrobial and disinfecting agents and indeed silver is not effective against them. After incubation with tea polyphenols, C. Botulinum
and C. Butyricum spores were decreased in number while no effect was shown in Bacillus Cereus spores.56 As shown in Table 6, our silver nanoparticles solutions in black and green tea infusions were tested against the Bacillus Subtilis
spores. Notwithstanding the good premises the experimental data show that silver nanoparticles either in black tea infusion or in green tea infusion are not effective together with tea polyphenols against the Bacillus Subtilis spores. Even the neat silver nanoparticles solutions and 15 min contact time are not effective against the spores.
Conclusions
Simple tea infusions from black tea, green tea and even from decaffeinated tea are able to reduce silver ions into silver nanoparticles which remain suspended into the infusions because the tea polyphenols act both as reducing agents and capping agents of the resulting colloidal silver.
constant of kblack = 9.44x10⁻⁴ s-1 was determined on black tea infusion and of kgreen = 8.9x10⁻³ s-1 in the case of green tea infusion. The molar extinction coefficient of the surface plasmon resonance band of silver nanoparticles was also determined in black and green tea infusions and compared with that determined on silver nanoparticles in tannin and on commercial silver proteinate for comparison.
A direct determination of the particle size distribution and the average diameter of the silver nanoparticles both in black and in green tea infusions was obtained by dynamic light scattering (DLS) measurements. Silver nanoparticles show a narrower distribution in green tea with an average diameter of 20.8 nm. The distribution of the silver particles size results broader in black tea with an average diameter of 78.7 nm. For comparison the silver nanoparticles in tannin exhibit an average diameter of 55.7 nm.
The stability of silver nanoparticles colloidal dispersions in both black and green tea infusions was determined with DLS measurements through the Z-potential value. The experimental results show that the silver nanoparticles in tea infusions exhibit a more than satisfactory long term stability and in any case comparable to Z-potential value measurable on silver nanoparticles produced with tannin. This result confirms that the tea polyphenols act simultaneously as reducing agents of silver ions and as capping agent of the resulting nanoparticles stabilizing the resulting colloidal suspension.
The bactericidal properties of silver nanoparticles in both black and green tea infusions were confirmed on the Gram(-) bacterium P. Aeruginosa. Instead, the silver nanoparticles in both black and green tea infusions are not effective against the spores of B. Subtilis.
References
1Krutyakov, Y.A., Kudrinskiy, A. A., Olenin, A.Y., Lisichkin, G.
V. Russian Chem. Rev.2008,77, 233.
2Nath, D., Banerjee, P., Environ. Toxicol. Pharmacol.2013, 36 ,
997.
3Ravindran, A., Chandran, P., Khan, S.S., Colloids Surf.B:
Biointerfaces2013, 105, 342.
4Sharma, V.K., Yngard, R.A., Lin, Y., Adv. Colloid Interface Sci.
2009, 145, 83.
5Abou El-Nour, K.M..M., Eftaiha ,A., Al-Warthan, A., Ammar,
R.A.A., Arabian J. Chem. 2010, 3, 135.
6Tolaymat, T.M., El Badawy, A.M., Genaidy, A., Scheckel, K.G.,
Luxton, T.P., Suidan, M., Sci. Total Environ.2010, 408, 999.
7Moritz, M. Geszke-Moritz, M. Chem. Engin. J.2013, 228, 596. 8Mittal, A. K., Chisti, Y., Banerjee, U.C., Biotechnology Adv. 2013,
31, 346.
9Sharma, T. K., Chopra, A., Sapra, M., Kumawat, D., Patil, S.D.,
Pathania, R., Navani, N.K., Int. J. Green Nanotech., 2012, 4, 1.
10Roy, N., Gaur, A., Jain, A., Bhattacharya, S., Rani, V., Environ.
Toxicol. Pharmacol., 2013, 36, 807.
11Kharissova, O.V., Dias, H.V.R., Kharisov, B.I., Olvera Perez, B.,
Perez, V.M.J., Trends in Biotechnology, 2012, 31, 240.
12Cataldo, F., Ursini, O., Angelini, G., European Chemical Bulletin
2013, 2, 700.
13Jha, A.K., Prasad, K., Int. J. Green Nanotech.: Phys. Chem., 2010,
1, 110.
14Guidelli, E.J., Ramos, A.P., Zaniquelli, M.E.D., Baffa, O.,
Spectrochim. Acta Part A 2011, 82 , 140.
15Ghaseminezhad, S.M., Hamedi, S., Shojaosadati, S.A.
Carbohydrate Polym.2012, 89, 467.
16Dipankar, C., Murugan, S., Colloids Surfaces B: Biointerfaces
2012, 98, 112.
17Bankura, K.P., Maity, D., Mollick, M.M.R, Mondal, D.,
Bhowmick, B., Bain, M.K., Chakraborty, A., Sarkar, J., Acharya, K., Chattopadhyay, D., Carbohydrate Polym. 2012,
89, 1159.
18Pandey,S., Goswami, G.K., Nanda, K.K., Int..J.Biol. Macromol.,
2012, 51, 583.
19El-Rafie, H.M., El-Rafie, M.H., Zahran, M.K., Carbohydrate
Polym.2013, 96, 403.
20Prakash, P., Gnanaprakasam, P., Emmanuel, R., Arokiyaraj, S.,
Saravanan, M., Colloids Surfaces B: Biointerfaces2013, 108, 255.
21Rao, Y.S., Kotakadi, V.S., Prasad, T.N.V.K.V., Reddy, A.V., Sai
Gopal, D.V.R. Spectrochim. Acta Part A2013, 103, 156.
22Kanmani, P., Lim, S.T., Carbohydrate Polym.2013, 97, 421. 23Barua, S., Konwarh, R., Bhattacharya, S.S., Das, P., Devi, K.S.P.,
Maiti, T.K., Mandal, M., Karak, N., Colloids Surfaces B: Biointerfaces 2013, 105, 37.
24Sen, I.K., Mandal, A.K., Chakraborti, S., Dey, B., Chakraborty,
R., Islam, S.S., Int..J.Biol. Macromol., 2013, 62, 439.
25Bharali, P., Saikia, J.P., Paul, S., Konwar, B.K. Int..J.Biol.
Macromol., 2013, 61 , 238.
26Steglich, W, Fugmann, B., Lang-Fugmann, S.(eds.) “Rompp
Encyclopedia of Natural Products”, Georg Thieme Verlag, Stuttgart 2000, 630.
27Budavari, S. (ed.) “The Merck Index”, 12th Ed. Merck Research
Laboratories, Whitehouse Station, 1996, 9221.
28Ajitha, B., Reddy, Y. A. K., Reddy, P.S., Spectrochim. Acta Part
A 2014, 121, 164.
29Ashokkumar, S., Ravi, S., Kathiravan, V., Velmurugan, S.,
Spectrochim. Acta Part A 2014, 121, 88.
30Xu, W., Jin, W., Lin, L., Zhang, C., Li, Z., Li, Y., Song, R., Li, B.,
Carbohydrate Polym.2014, 101, 961.
31Reddy, N.J., Vali, D.N., Rani, M., Rani, S.S., Mater. Sci. Engin.C
2014, 34, 115.
32Vimala, K., Varaprasad, K., Sadiku, R., Ramam, K., Kanny, K.,
Int..J. .Biol. Macromol., 2014, 63, 75.
33Vilchis-Nestor, A.R., Sánchez-Mendieta, V., Camacho-López,
M.A., Gómez-Espinosa, R.M., Arenas Alatorre, J.A., Mater. Lett.2008, 62, 3103.
34Moulton, M.C., Braydich-Stolle, L.K., Nadagouda, M.N.,
Kunzelman, S., Hussain, S.M., Varma, R.S. Nanoscale 2010,
2, 763.
35Vaseeharan, B., Ramasamy, P.,.Chen, J.C., Lett. Appl. Microbiol.
2010, 50, 352.
36Kamal, S. S. K., Sahoo, P.K., Vimala, J., Premkumar, M., Ram,
S., Durai, L., Acta Chim. Slov.2010, 57 , 808.
37Moulton, M.C., Braydich-Stolle, L.K., Nadagoud, M.N.,
Kunzelman, S., Hussain, S.M., Varma, S.R., Nanoscale,
2010, 2, 763.
38Loo, Y.Y., Chieng, B.W., Nishibuchi, M., Radu, S., Int. J.
Nanomedicine 2012, 7, 4263.
39Uddin, M.J., Chaudhuri, B., Pramanik, K., Middyac, T.R.,
40Özyürek, M., Güngör, N., Baki, S., Güçlü, K., Apak, R., Anal.
Chem.2012, 84, 8052.
41Chandra, G.K., Tripathy, D.R., Dasgupta, S., Roy, A. Appl.
Spectrosc.2012, 66 , 744.
42Yu. A. Mirgorod, V. G. Borodina, Inorg. Mater.2013, 49, 980. 43M. Zou, M. Du, H. Zhu, C. Xu, N. Li, Y Fu, Polym. Engin. Sci.
2013, 53, 1099.
44Y. H. Hui, “Encyclopedia of Food Science and Technology”,
Wiley, New York, 1992, 2292.
45Sang, S., Lambert, J.D., Ho, C.T., Yang, C.S., Pharmacol.
Research 2011, 64, 87.
46Stodt, U., Engelhardt, U.H., Food Research Int., 2013, 53, 636. 47Kuhnert, N., Archives Biochem.Biophys. 2010, 501, 37.
48Luczaj, W., Skrzydlewska, E., Preventive Medicine 2005, 40,
910.
49Polovka, M., Brezova, V., Stasko, A., Biophysical Chem. 2003,
106, 39.
50Morsy, M.A., Khaled, M.M., Spectrochimica Acta Part A 2002,
58, 1271.
51Carloni, P., Tiano, L., Padella, L., Bacchetti,T., Customu, C., Kay,
A., Damiani, E., Food Research Int.2013, 53, 900.
52Ananingsih, V.K., Sharma, A., Zhou, W., Food Research Int.
2013, 50, 469.
53Greenwood, R., Kendall, K., J. Eur. Ceramic Soc.1999, 19, 479. 54Hanaor, D.A.H., Michelazzi, M., Leonelli, C., Sorrell, C.C., J.
Eur. Ceramic Soc.2012, 32, 235.
55Wikipedia: http://en.wikipedia.org/wiki/Oligodynamic_effect 56Bansal, S., Choudhary, S., Sharma, M., Kumar, S.S., Lohan, S.,
Bhardwaj, V., Syan, N., Jyoti, S., Food Research Int. 2013,
53, 568.