Neutral to Earth Voltage Reduction Methods in Three-Phase Four Wire
Distribution Systems
G. Ahmadi and S.M. Shahrtash
Iran University of Science and Technology (IUST)Center of Excellence for Power System Automation and Operation associated to IUST [email protected]
ABSTRACT
Neutral to earth voltage can vary significantly depending on the load unbalance. Here, an analysis of neutral to earth voltage in multi-grounded three-phase four-wire distribution system is presented that considers load unbalance and the effect of explicitly represented neutral wire. A multiphase load flow algorithm is developed based on backward/forward sweep to examine the effects of various factors on the neutral to earth voltage (NEV), including unsymmetrical system configuration and load unbalance. The magnitude of NEV is investigated under various conditions on the number of grounding rods per feeder lengths and the grounding rods’ resistance. The algorithm and the associated models are tested on IEEE 13 bus system. Keywords— Neutral to Earth Voltage, three-phase four-wire systems, five-four-wire line model, multi-grounded neutral.
1.INTRODUCTION
Generally, distribution networks are operated in an unbalanced configuration and also service to consumers. This fact causes current flowing through neutral conductor and voltage dropping on neutral wire. The unbalance load and excessive current in neutral wire is one of the issues in three-phase four-wire distribution systems that causes voltage drop through neutral wire and makes tribulations for costumers. The existence of NEV makes unbalance in three phase voltages for three phase customers and reduction of phase to neutral voltage for single phase customers. Thus, its evaluation and reduction have many interests for operators.
In this paper, the effects of load balancing, three-phasing of single-phase loads and power factor correction on NEV have been analyzed in three-phase four-wire distribution systems. In addition, the results of various conditions on the number of grounding rods per feeder lengths and the grounding rods’ resistance on magnitude of NEV have been studied.
In order to perform NEV analysis, an appropriate load flow algorithm [1] and the associated power system modeling technique is advanced for NEV profile calculation on various conditions. The load flow method is based on backward/forward sweep method which is capable of five-wire simulation (three phase, multi-grounded neutral wire and ground equivalent wire) and neutral voltage calculation.
Since the neutral wire is explicitly represented in the utilized power flow technique, neutral currents are calculated directly. Thus, NEV can be computed by using the neutral wire current. In this way, the impact of different parameters on NEV can be
clearly visualized. The proposed methodology for evaluation of NEV is applied on IEEE 13 bus distribution network.
2.MODELING OF RADIAL DISTRIBUTION NETWORKS
The presented method in this paper for radial distribution system analysis is an improved method of one introduced in [2]. In this approach, the distribution feeder is modeled by a five-wire model to reveal the profile of neutral to earth voltages.
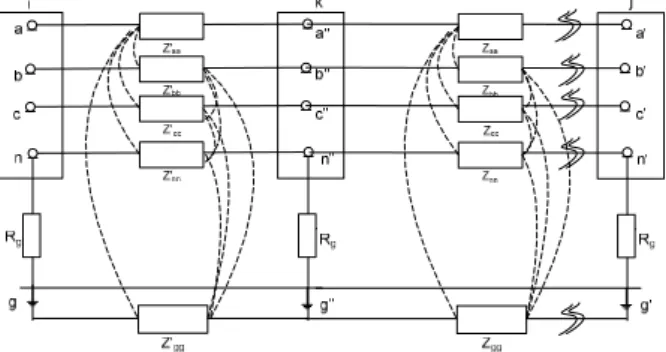
In the proposed method, along with the usage of five wire model for multi-grounded distribution feeders, the parameters of this model are derived according to Carson’s relations. Moreover, the self and mutual impedance of ground equivalent wire are assigned according to [3]. A multi-grounded distribution feeder may be divided to segments. Fig. 1 illustrates a three phase feeder with two segments.
Fig. 1. A three phase multi-grounded feeder
The number of segments depends on the times that the neutral is connected to the ground. Then, in order to reduce the size of the load flow problem, the junction nodes of grounding resistance should be eliminated. The Kron reduction can be applied to simplify the above circuit with multiple segments to one segment for each feeder. The resulting equivalent circuit is shown in Fig. 2.
3.POWER FLOW ALGORITHM
The proposed backward/forward sweep algorithm to solve the radial system can be divided into two parts: 1) backward current sweep and 2) forward voltage sweep.
Backward Current Sweep: For a radial feeder, the branch current can be calculated by summing the injection currents from the receiving bus toward the sending bus of the feeder. The general equation can be expressed as:
Fig. 2. The Ǚ equivalent circuit of a multi-grounded feeder
( )
( )
k m mg mn mc mb ma k jg jn jc jb ja k jJ
J
J
J
J
I
I
I
I
I
J
J
J
J
J
¦
∈Ω»
»
»
»
»
»
¼
º
«
«
«
«
«
«
¬
ª
+
»
»
»
»
»
»
¼
º
«
«
«
«
«
«
¬
ª
−
−
−
=
»
»
»
»
»
»
¼
º
«
«
«
«
«
«
¬
ª
lg ln lc lb la (1)where the relation is derived for kth iteration and;
[ ]
abcn lJ
is current flows on line section l,[ ]
abcng jI is current injections at bus j,
j is set of line sections connected downstream to bus j.
Forward Voltage Sweep: For a radial distribution system if branch currents were calculated, the bus voltages can be found from the sending bus toward the receiving bus of the feeder. The general equation can be expressed as:
( ) k
lc lb la h nn ng cg bg ag ng nn cn bn an cg cn cc bc ac bg bn bc bb ab ag an ac ab aa k jg jn jc jb ja k ig in ic ib ia k J J J J J Z Z Z Z Z Z Z Z Z Z Z Z Z Z Z Z Z Z Z Z Z Z Z Z Z V V V V V V V V V V V ij » » » » » » ¼ º « « « « « « ¬ ª × » » » » » » ¼ º « « « « « « ¬ ª = » » » » » » ¼ º « « « « « « ¬ ª − » » » » » » ¼ º « « « « « « ¬ ª = Δ lg ln (2)
where, as in (1), the relation is derived for kth iteration and;
[
abcng]
iV is the voltage of bus i,
[ ]
abcngij
Z
is the branch impedance from bus i to bus j.The power flow calculation is started with initial voltages for three phases at all nodes. It is necessary to assume that the initial voltage for all nodes at fundamental frequency is equal to
the source node voltage, with taking the initial voltage of neutral wire and ground equivalent wire as zero, i.e.
( ) 3 2 2 0
0
0
.
.
π j ref ref ref ig in ic ib iae
a
V
a
V
a
V
V
V
V
V
V
=
»
»
»
»
»
»
¼
º
«
«
«
«
«
«
¬
ª
=
»
»
»
»
»
»
¼
º
«
«
«
«
«
«
¬
ª
(3)In [6], the resulting branch current vector is explained and its formation procedure is presented. Thus, it can be written:
[ ][ ]
kij k
ij
A
I
J
=
(4)where
[ ]
ijA is the coefficient vector of currents for the branch between bus i and j.
The next step is to calculate the bus voltage variations with respect to the current injection vector, which can be calculated by combining (2) and the forward voltage sweep and expressed as:
(
)
[
k]
[ ]
[ ]
ks
V
HA
I
V
−
=
(5)where Vs is the source node voltage, and V is the bus voltage vector.
[ ]
HA is the relationship matrix between bus voltage vector and current injection vector, that the formation procedure is explained in [6].4.TEST SYSTEM SIMULATION
In this paper, the IEEE 13 bus test distribution system [5] is made less complex [4] for modeling and simulating as shown in Fig. 3, and the effects of load conditions and system parameters variations on NEV have been studied.
5.RESULTS
Results obtained by performing the proposed power flow method on IEEE example system are shown in next steps. 5.1. Effect of load balancing on NEV
To examine the effect of load balancing on NEV, first load imbalance index is introduced as
¦
+ +c b
a I I
IG G G that means vector sum of three phase currents at each bus and downstream. Then, to analyze the effect of load balancing on neutral voltage, load on bus 3 (Fig. 3) is made unbalance by shift of 30 percent of load from phase-B to phase-C. Then, 10 percent of the phase-B load is increased, while the same value is decreased in phase-C. The mentioned index values for buses 2, 3, 4 and their downstream which are calculated at these conditions, are shown in Table 1. As seen, the effect of this imbalance is descending severely at middle branch of network (related to bus 3, Fig. 3), but it has less effect on other branches (related to buses 2 and 4).
Table 1-Effect of load imbalance on main branches’ current
¦
IBus
30% imbalance
20% imbalance
10% imbalance
0.0% imbalance
2,5 0.2512 0.2536 0.2559 0.2582
3,6,7,9 0.2849 0.2290 0.1748 0.1225
4,8 0.0119 0.0121 0.0124 0.0125
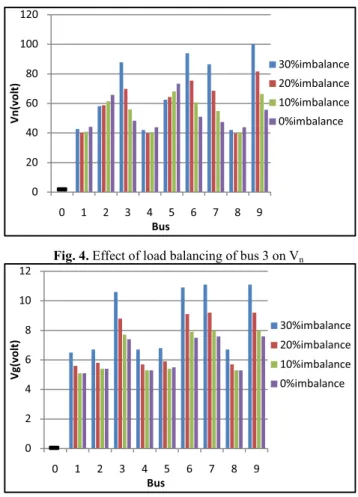
Ground and neutral wire current is decreased with imbalance decrease at middle branch (refer to Table 1). Consequently, ground and neutral wire voltages are decreased at buses 3, 6, 7 and 9 (Figs 4 and 5).
5.2. Three phasing of single phase load
As previously mentioned, three phasing of single phase load is a method of NEV reduction. In the case that the NEV is increased by single phase load, this method can be used for NEV reduction. Figs 6 and 7 present the result of three phasing of load at bus 9. Due to imbalance load of network, three phase currents are different and voltage drops are not equal in phases A, B and C and it causes voltage imbalance on load node. Therefore, despite the load balancing in bus 9, voltage imbalance makes unequal current flowing through three phase load and accordingly, neutral current and voltage are raised. Generally, three phasing method decreases NEV on related bus. Nevertheless, it may increase NEV on other buses, as shown in Figs 6 and 7.
Fig. 4. Effect of load balancing of bus 3 on Vn
Fig. 5. Effect of load balancing of bus 3 on Vg
Fig. 6. Vn variation for three phasing of single phase load on bus 9
0 20 40 60 80 100 120
0 1 2 3 4 5 6 7 8 9
Vn(vol
t)
Bus
30%imbalance 20%imbalance 10%imbalance 0%imbalance
-0 2 4 6 8 10 12
0 1 2 3 4 5 6 7 8 9
Vg(vol
t)
Bus
30%imbalance 20%imbalance 10%imbalance 0%imbalance
-0 10 20 30 40 50 60 70 80 90
0 1 2 3 4 5 6 7 8 9
Vn(vol
t)
Bus
Single phase Three phase
-Fig. 7. Vn variation for three phasing of single phase load on bus 9
5.3. Power factor correction
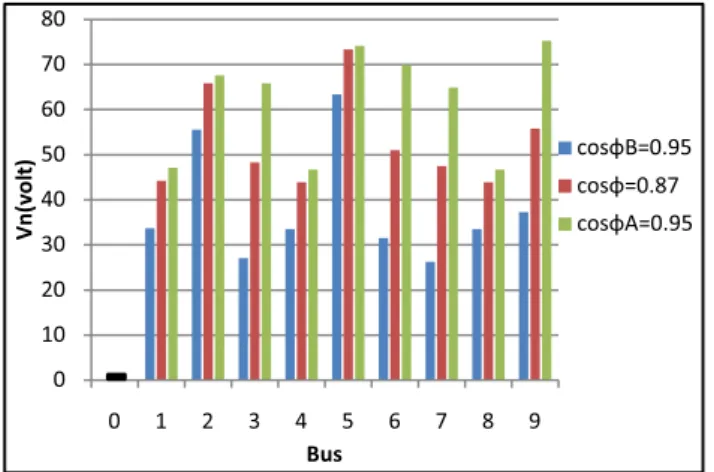
In this section, the effect of power factor correction is investigated on neutral and ground voltage. As it is mentioned, all of the bus voltages (excluding bus 0) are unbalanced by unsymmetrical and unbalanced system. In the test system, there is a three phase balanced load on bus 3 and a voltage drop on phase-B more than other phases. In simulations, power factorof load of bus 3 in phase-A and phase-B is increased from 0.87 to 0.95 lag and the resultant neutral and ground equivalent wire voltages are illustrated in Figs 8 and 9. As it is seen, voltage imbalance and consequently neutral and ground voltage are decreased as power factor of phase-B is increased. On the contrary, voltage imbalance is raised while power factor of phase-A is improved and neutral and ground voltage is magnified.
5.4. Variation of grounding rod’s resistance Rg
In this step, the effect of Rg variations on the NEV is examined with three Rg quantities: 6, 18 and 54 .
Figs. 10 and 11 show the neutral and ground voltage. Neutral voltage is sensitive to the change in Rg. The higher Rg causes higher neutral voltages, as expected. In Fig.10, it can be seen that Vn is increased as Rg is increased; because the current through the ground equivalent wire is decreased with Rg enlargement. Subsequently, the current flow through the neutral wire is increased. Therefore, the voltage drop in neutral wire is increased. Besides, Fig. 11 presents that as Vg decreases, Rg increases due to the decrease in the current flowing through the ground.
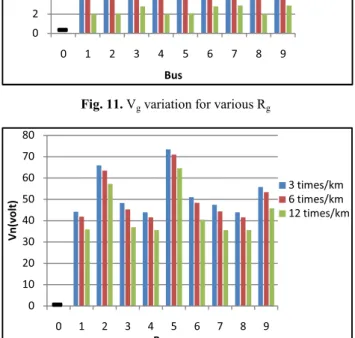
5.5. Number of grounding rods per length unit In this part, the resistance of rods is taken as 18 ohms. The results of three simulations are shown in Figs. 12 and 13.
It can be seen, when the number of Rg increases, or in other words when the connection of neutral wire to ground becomes better; generally, there is a trend of decreasing in Vn. The variation of Vn depends on the resistance of grounding rods, where the larger Rgs cause smaller variation in Vn (not shown).
Fig. 8. Vn variation for cos correction
Fig. 9. Vg variation for cos correction
Fig. 10. Vn variation for various Rg
0 1 2 3 4 5 6 7 8
0 1 2 3 4 5 6 7 8 9
Vg(vol
t)
Bus
Single phase Three phase
-
10020 30 40 50 60 70 80
0 1 2 3 4 5 6 7 8 9
Vn(vol
t)
Bus
cosB=0.95 cos=0.87 cosA=0.95
-0 1 2 3 4 5 6 7 8 9 10
0 1 2 3 4 5 6 7 8 9
Vg(vol
t)
Bus
cosB=0.95 cos=0.87 cosA=0.95
-0 10 20 30 40 50 60 70 80 90
0 1 2 3 4 5 6 7 8 9
Vn(vol
t)
Bus
Rg=6 Rg=18 Rg=54
-Fig. 11. Vg variation for various Rg
Fig. 12. Vn variation for various numbers of rods per length unit
Fig. 13. Vg variation for various numbers of rods per length unit
6.CONCLUSION
In this paper, effects of load balancing on neutral voltage have been studied. And, it has been shown that load balancing at one bus not also can decrease the neutral wire voltage at other buses but also can increase them in unbalance and unsymmetrical distribution systems. Moreover, it has been shown that three-phasing of single-phase loads in one bus for decreasing the neutral wire voltage can boost the neutral wire voltage at other ones. Furthermore, load factor correction can decrease NEV as well as it can increase it too. Also the
magnitude of NEV is investigated under various conditions on the number of grounding rods per feeder lengths and the grounding rods’ resistance and the results are given.
In addition for NEV calculation, a power flow method for radial distribution system is presented, which is an improvement in the method of [2]. In this improvement the distribution feeder is modeled by a five wire model to reveal the profile of neutral to earth voltages.
7.REFERENCE
[1]. G. Ahmadi, S.M. Shahrtash, “Neutral to Earth Voltage Analysis in Harmonic Polluted Distribution Networks with Multi-Grounded Neutrals”, World Academy of Science, Engineering and Technology, Vol. 37, Dubai, 2009, pp. 905-909.
[2]. J. H. Teng, C.Y. Chang, “Backward/Forward Sweep-Based Harmonic Analysis Method for Distribution Systems”, IEEE Transactions on Power Delivery, 2007, pp. 1665-1672.
[3]. R. M. Ciric, A. P. Feltrin, L. F. Ochoa, “Power Flow in Four-Wire Distribution Networks—General Approach”, IEEE Transactions on Power System, 2003, pp.1283-1290. [4]. J. jiang, “Elevated NeutralǦtoǦEarth Voltage in Distribution
Systems Including Harmonics” A Dissertation Presented to the Graduate School of Clemson University, 2006.
[5]. ___, “Radial Distribution Test Feeders”, Distribution System Analysis Subcommittee Report, IEEE Power Engineering Society, 2001, pp.908-912.
[6]. J. H. Teng, “A Direct Approach for Distribution System Load Flow Solutions”, IEEE Transactions on Power Delivery, 2003, pp.882-887.
0 2 4 6 8 10 12 14 16 18
0 1 2 3 4 5 6 7 8 9
Vg(vol
t)
Bus
Rg=6 Rg=18 Rg=54
-0 10 20 30 40 50 60 70 80
0 1 2 3 4 5 6 7 8 9
Vn(vol
t)
Bus
3 times/km 6 times/km 12 times/km
-0 2 4 6 8 10 12 14 16
0 1 2 3 4 5 6 7 8 9
Vg(vol
t)
Bus
3 times/km 6 times/km 12 times/km