PLANNING MALAYSIA
Journal of the Malaysian Institute of Planners (2007) V, 17 - 42
MULTICRITERIA ANALYSIS OF FLOOD CAUSES IN
KUALA LUMPUR
Nur Fazzillah Muhamed Noordin1
Project Executive, GEOINFO SERVICES SDN BHD
Alias Abdullah2 & Muhammad Nur Azraei Shahbudin3
INTERNATIONAL ISLAMIC UNIVERSITY MALAYSIA
Abstract
In today's world, natural disasters are becoming frequent occurrence as a result of human's excess and waste in using resources, especially land. Its effects can be seen in disasters such as flood in urban areas where population and built-up area is dense. Many studies have been conducted in flood prediction and river management but very few concentrate on evaluation of flood occurrence factors at rivers in urban areas. This study evaluates the significance of factors that cause urban flash floods in Kuala Lumpur by using Multi-Criteria Analysis (MCA) method with special reference to DEFINITE software. This study carries out a systematic approach encompassing a selection of criteria that determines the root cause of flood through consultation with major stakeholders like Department of Irrigation and Drainage (DID), Department of Environment (DOE), Kuala Lumpur City Hall (DBKL), and Malaysian Meteorological Department (MMD). Less than obvious results are due to the complexity and reality of the problem based on the interview of stakeholders with different views on the local environment. The MCA results reveal that stream and land (land use) are the main causes of flooding in urban areas that can be solved with a proper physical planning.
Keywords: MCDA, Flood Disasters, Risk Management, Urbanisation, Environment
1 She received a Bachelor Degree of Urban and Regional Planning from International
Islamic University Malaysia ([email protected]). 2
Professor, Department of Urban and Regional Planning, Kulliyyah of Architecture and Environmental Design, International Islamic University Malaysia, Kuala Lumpur ( [email protected]).
3 Research Officer, IIUM Consultancies, International Islamic University Malaysia,
Kuala Lumpur ([email protected]).
Nur Fazzillah 1\!11/iamed Noordi11, Alias Abdullah & J!11hammad Nur A=raei Slwhbudin kfulticriteria Analysis of Flood Causes in Kuala Lumpur
INTRODUCTION
In 1998 Yangtze's worst flood in 44 years occurred due to deforestation and intensive land development (Brown and Halweil, 1998) whilst in 2004, Bangladesh 10-year cycle floods arrived early also due to deforestation and irrigation (Logan, 2004). However, the 1995 flood in the Netherlands was due to melt water from mountains and extremely heavy rainfall4 and the 2002 flood in Germany was due to dam burst (BBC News, 151h August 2002). Kuala Lumpur is similar to China and Bangladesh where floods were due to human hand, in contrast with the Netherlands and Germany where floods were natural disasters.
Understanding the flood problem begins by finding out its root cause. The root cause is uncovered through the systematic approach of evaluating the causes of flood in urban areas such as Kuala Lumpur. A systematic approach would encompass a selection of criteria that can determine which, from a range of factors, are the root causes of flood. By establishing the root causes of flood measures can be taken to solve the flood problem from a specific scope of recommendations.
Working out the factors that cause floods is important although arguably there could be conflicting results. This is due to the complexity and reality of the problem and is based on the evaluation of authorities with different expertise and specialisations. The complexity of the problem could prevent any definite measure to be recommended for flood mitigation. However, short-term and long-term initiatives are recommended.
This study evaluates the significance of factors that cause urban flash floods at the Sg.5 Gombak catchment area within Kuala Lumpur by using the Multi-Criteria Analysis (also called the Multiple Multi-Criteria Decision Analysis (MCDA)) method. The application of MCA in this study has shown its effectiveness in assisting urban planners, authorities, decision makers, stakeholders and the public or end users as stated in Spatial Planning And Decision Support System For Modelling Water Resources (Alias Abdullah et al., 2004), and Evaluating
Rail Network Options Using MCDA (Ali Sharifi et al., 2004). It is aimed to assist parties who have an interest in urban flooding to take measures that will mitigate the hazards in the study area through long-term and short-term initiatives
4 Ministerie van Buitelandse Zaker, 2005
5 Sg. represents sungai or river. E.g., Sg. Gombak means Gombak River.
The Problem
PLANNING AfALA YSIA Jo11r11al of the lvfalaysia11 Institute of Planners (2007)
The Klang Valley (comprising of Kuala Lumpur and five other districts in Selangor State) has grown to encompass a wide expanse of highly urbanised area since 1860 as people from the rural areas had begun to migrate to the towns in hopes of a better life. Lack of proper planning back then forced many to set up squatter colonies. The advent of urbanisation saw Kuala Lumpur face many problems both social and physical in nature. The ad-hoe town gave way to a rapidly developing but unplanned city that grew dangerously close to the rivers. In the past, the occurrence of these floods is notably more often and more vicious. According to Salmah (2004), the problem of increased occurrences of flash floods in the Klang Valley is a consequence of unplanned development in the flood plains, resulting in changes to the environment.
There are two main rivers in Kuala Lumpur that are most prone to flooding due to their close proximity to urban areas, specifically Sg. Gombak and Sg. Klang. There is much evidence of public and drainage works being done to control the flooding of Sg. Klang such as the Stormwater Management and Road Tunnel (SMART)6, a two-pronged project under the Federal Government to alleviate the flood problem and ease traffic congestion in Kuala Lumpur city centre. On the other hand, there has been no news as yet of flood control measures intended for Sg. Gombak. Thus, Sg. Gombak catchment area within Kuala Lumpur is the case for this study and a reference for the MCA evaluation (see Figure 1).
There can be many causes of flood in Sg. Gombak due to the natural phenomena. However, the main factors that cause floods in urban areas like Kuala Lumpur mostly stem from human activities.
The first factor is land use change (here we called it as land factor). For the past fifty years the morphology of Kuala Lumpur had significantly changed from a known mining town to a modem capital city. The rapid urbanisation process had made Kuala Lumpur a modem concrete jungle. Empirical studies by scholars from various universities and research institutes had showed that floods in Kuala Lumpur and Klang Valley were due to impervious land or ground surfaces that cannot absorb water into the soil effectively thus causing flood at areas closest to the rivers.
6 SMART is an acronym for Storm\Vater Managen1ent and Road Tunnel, a project under the Federal Government of Malaysia initiated to alleviate the flooding problem in the eity centre of Kuala Lumpur. See http://www.smarttunnel.eom.my/home.htm on the project.
N11r Fa==iflah AI11hamed Noordi11, Alias Abdullah & Afuhammad N11r Azraei Sliahb11di11 Afulticriteria Analysis of Flood Causes in Kuala Lumpur
r
STUDY AREA
LEGEND:
01h•r RJ,•1~
l.:ih•
~J!. {;nmb~h C.1l<hm•11C
Rl\tf C:il<hmrul l~•:1
l'r•l•nd Tt1T!l&r~· of l\11:11:! Lumpu1 B~nu1br~
Figure I: The Study Area of Sg. Gombak, Kuala Lumpur
The second factor is Sg. Gombak does not have the capacity to drain off water quickly during heavy rain. In the '90s, it was cited that the cause for flooding
in the Kuala Lumpur city centre was due to clogging of drains and its capacity to hold very low volume of water.
The third factor is heavy rain as the cause of flooding. Floods occur more often
during the monsoon season as the monsoon storms rain heavily on the west coast of Peninsular Malaysia. Other weather factors that contribute to flooding are such as the global La Nina effect. As the monsoon storms follow a set pattern each year, there should be increased ability to manage the weather
PLA1VJ\'ING 1lIALA YSIA Jo11r11al ofrhe Afalaysia11 !11stilllle of Pla1111ers (2007)
effects. Even so, more often than not urban flooding also occurs after only a
light evening shower.
OBJECTIVE
The main objective is to find out systematically the most significant urban flood factor of highest priority in Sg. Gombak catchment area within Kuala Lumpur. The systematic evaluation uses MCA, which includes weight assignation of a selection of criteria by authorities and pairwise comparison of the objectives of each authority. Four government departments namely DID (Department of Irrigation and Drainage), DOE (Department of Environment), DBKL (Kuala Lumpur City Hall) and MMD (Malaysian MeteorologicaL Department), are chosen for the interview due to their relevance to the study area and scope of work.
RIVER HYDROLOGY AND THE CHARACTERISTICS OF URBAN FLOODS
Urban flood characteristics are different from rural floods. Firstly there must be a definition of what is known as 'urban area' and secondly what is the definition of 'flood'. From then on, the collective term of 'urban flood' can be better understood in terms of physical area where it occurs, its causes or factors, and its basic dynamics. Through the understanding of urban floods, criteria (including its respective indicator) for urban flood improvement are then derived and selected for the weight assignation and evaluation exercise.
URBAN FLOOD OCCURRENCE FACTORS
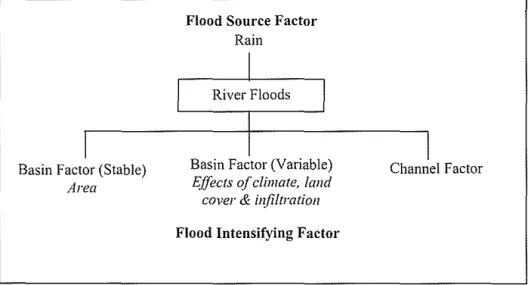
The factors are generally reasons that cause and intensify flood events in urban areas. Smith (1998) summarises the factors of flood occurrence - rain, basin (stable and variable), and channel factors (refer Figure 2).
Nur Fa=::illah Aluhamed Noordin, Alias Abdullah & 1\f11hammad Nur A=raei Shahbudin ,Uulticriteria A11a~rsis of Flood Causes in Kuala Lumpur
I
Basin Factor (Stable)Area
I
Flood Source Factor
Rain
I
River Floods
I
Basin Factor (Variable)
Effects of climate, land cover & infiltration
Flood Intensifying Factor
I
Channel FactorFigure 2: Flood cause factor and flood intensifying factors (After Smith, 1998)
FLOOD MITIGATION AUTHORITIES RELATED TO SG. GOMBAK CATCHMENT AREA
Understanding the organisation of authorities in charge of flood mitigation is imperative so that the choice of authorities to be interviewed will focus on the problem at hand. Only four authorities are selected for the interview so that their overall opinions will give an overview to the flood problem in Sg. Gombak. The first would be the authority responsible for planning and development of land within Sg. Gombak catchment area (i.e. DBKL), and the second is the authority responsible for the Sg. Gombak watercourse (i.e. DID). The third would be the authority responsible for the environment as a whole (i.e. DOE) and the fourth is the authority that can forecast the flood-causing weather (i.e. MMD).
MCA EVALUATION AND FINDINGS
The multiple criteria evaluation (MCE) of the flood factors is can-ied out based on the performances of each factor on various defined criteria and the relative importance of each criterion. The objective data is derived through assessment of the land use and environmental impacts of each flood factor interviews and processed using MCDA. In observing the perfonnance of each flood factor on a different criterion shows that there is one option that dominates the others. This
PLAiViV/iVG ilJALA YSIA Jo11r11al of the 1\10/aysian Institute of Planners (2007)
is expected although the flood factors are comparable to each other due to the
nature of the problem. The result of this process is given in the "effects table''.
The subjective information relates to the relative importance of objectives and criteria valued in interviews using the pairwise comparison method. In this process, the authorities made judgements on the relative importance of three main objectives in obtaining the flood factor i.e. physical planning, engineering and environmental objectives. Physical planning is important because the study area is located in a highly built-up area and therefore planning is essential, whereas engineering objective is included for the stream aspect, and lastly, environmental objective is to present the ecological aspect of the problem. The authorities interviewed include DID, DBKL, DOE, and MMD.
A structured pairwise comparison as the assessment procedure
Stmctured pairwise comparison is a priority assessment procedure, a judgement on the relative importance of the three main objectives outlined, namely physical planning, engineering and environmental aspects. Using the pairwise comparison method, the representatives of authorities made an assessment on the priorities of objectives. For this process the following procedure was used.
The main objectives were presented in a table such as Table !. Then, each representative was asked to rank the importance or relevance of the main objectives of the flood factors as seen by each authority. Table 1 depicts the outcome of the survey of various authorities.
The representatives then rank the order of importance between each of the objectives. Using the information in Table 1 for a structured pairwise comparison technique, the relative importance of the objectives and criteria for each authority was derived. Table 2 presents the relative importance of the main objectives as derived from Table I.
Based on Table 1 that presents the relative importance of the main objectives as perceived by each authority, three out of four authorities stated identical relative importance of the main objectives. In the survey, all the authorities feel that the physical planning objective is relatively strongly more important than the other objectives when it comes to evaluating flood occmTence factors. However, in the opinion of MMD, the environmental objective is less important as the natural environment can be controlled or predicted only to a certain extent such as rainfall, wind flow, weather pattern, etc.
Nur Fa::.:::illah ,\fufwmed Noonli11, Alias Abdullah & ,\fufwmmad Nur A::.raei Slwhb11di11 i\Iufricriteria Ana6"Sis of Flood Causes i11 K11olo Lumpur
Tahle 1: Summary ofrelative impo1iance of the main objectives as perceived by each authority
Weakly Strongly Weakly Strongly
more more more more
important important important important
DID DOE
Physical
x
Physicalx
Planning Planning
Engineering
x
Engineeringx
Environ1nent
x
Environmentx
DBKL MMD
Physical
x
Physicalx
Planning Planning
Engineering
x
Engineeringx
Environtnent
x
Environmentx
According to DID, the physical planning is most impo1iant especially in the integration of drainage to the urban layout for channeling runoff and floodwaters especially from critical points. DBKL also agrees in this respect, not only with the view that proper physical planning can help mitigate flooding near the city centre but also on enforcement of garbage dumping into the river. In the opinion of DOE, the engineering objective also has strong imp01iance in this study because the engineering aspect of the river plays a significant role in controlling and mitigating flood; such as those that contribute to smooth flow of water including shape of streambed and its material, sedimentation rate, etc.
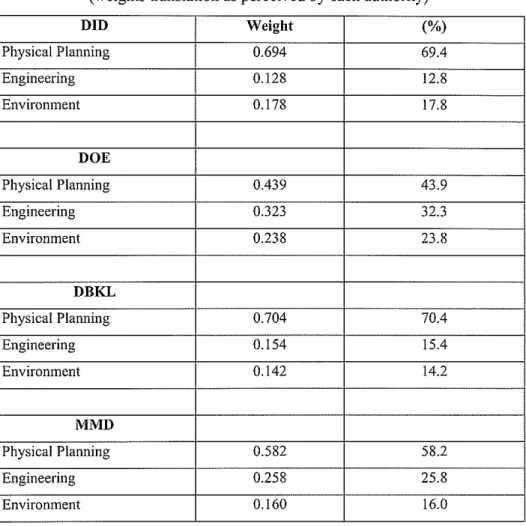
Table 2 shows the detailed results of the structured pairwise comparison method that was calculated. The authority that assigned the highest weight to physical planning objective is DBKL. With Kuala Lumpur geared towards excellent standards (world-class), the physical aspect is most important. This view is also somewhat shared by DID.
PLAJ\'t\'/1\'G ilfALA YSIA
Journal of the ivfalaysfrm !11stilu1e of Planners (2007)
Table 2: Structured pairwise comparison method (weights translation as perceived by each authority)
DID Weight (%)
Physical Planning 0.694 69.4
Engineering 0.128 12.8
Environ1nent 0.178 17.8
DOE
Physical Planning 0.439 43.9
Engineering 0.323 32.3
Environment 0.238 23.8
DBKL
Physical Planning 0.704 70.4
Engineering 0.154 15.4
Environment 0.142 14.2
MMD
Physical Planning 0.582 58.2
Engineering 0.258 25.8
Environment 0.160 16.0
The physical planning objective is imp01tant as stated by DID for practical aspects. In the survey of the authority representatives' opinion, much of their work involves laying down drainage at the most appropriate location besides monitoring and maintaining it. This calls for a lot of time spent on planning, research, and cost, therefore making the physical planning objective their concern in order not to waste valuable time, manpower and money. Like DBKL, engineering and environmental objectives are lesser concerns in terms of flooding although it was stressed that DID pays equal attention to all objectives. This is due to engineering being a means to mitigate flood before it happens i.e. river and drainage construction, whereas environment is beyond their scope of work.
Nur Fa::illah kfuhamed Noordin, Alias Abd111/a/i & ,\fuhammad N11r A:raei Shahbudin A/11/ticriteria Analysis of Flood Causes in Kuala L11111p11r
With both DOE and MMD, although the weight is definitely more on physical planning, it appears as if both authorities' representatives balance their views to encompass the bigger picture. The weights assigned to all three objectives are more evenly spread although not to the point of being equal. There being no doubt that physical planning is the objective with the highest weight in all four authorities, the second highest weight on engineering and lowest weight on environmental objectives was also assigned by all except for DID.
Evaluation objectives, criteria and indicators
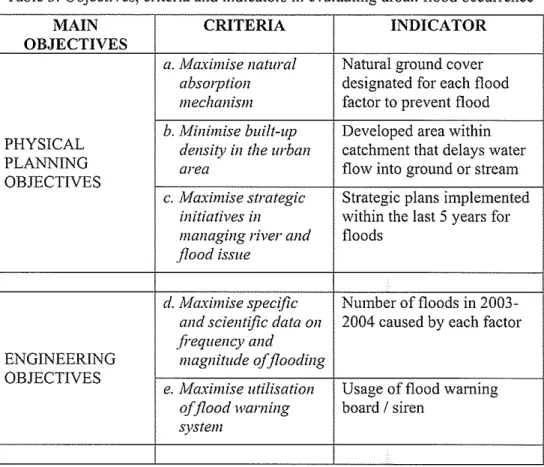
With the authorities' rank of objective importance known, evaluation of the flood factors commences with the basic outline of objectives, criteria and indicators of the study. The table summarising this is reproduced and reaiTanged with the inclusion of the MCDA objectives as shown in Table 3. Figure 3 illustrates the strncture of MCA evaluation.
Table 3: Objectives, criteria and indicators in evaluating urban flood occurrence
MAIN CRITERIA INDICATOR
OBJECTIVES
a. Maximise natural Natural ground cover absmption designated for each flood
n1echanis111 factor to prevent flood
PHYSICAL b. Minimise built-up density in the urban Developed area within catchment that delays water
PLANNING area flow into ground or stream
OBJECTIVES
c. Maximise strategic Strategic plans implemented
initiatives in within the last 5 years for
n1anaging river and floods flood issue
d. Maximise specific Number of floods in 2003-and scientific data on 2004 caused by each factor fi"equency and
ENGINEERING magnitude of flooding OBJECTIVES
e. Maxinzise utilisation Usage of flood warning offload warning board I siren
S)'SfeJJl
MAIN OBJECTIVES
ENVIRONMENTAL OBJECTIVES
CRITERIA
f
Maximise riverconservation
(naturalness af the rive1)
g. Minimise river madifications h. Maximise experts'
knowledge to study on urban flood
PLAi\'NING il/ALA YSJA
Journal of the klalaysia11 !11stit11te of Plamiers (2007)
INDICATOR
Percent length of river with natural bank
Percent length of river with modified bank
No. of studies conducted on flood
problems (including decision makers, stakeholders,
engineers and
planners)
The three main objectives of this study are underpinned by certain criteria. The criteria are to achieve the objectives of the study through indicators. Next, with the criteria and indicators on hand, the "effects table" is developed specifically for this study, the element on which multi-criteria evaluation7 is based upon. It consists of rows of indicators outlined previously (also known as "effects" in this exercise), and columns of urban flood factors. The urban flood factors in this study are three; namely land (as in relation to urbanisation), stream (as in relation to drainage) and rain (as in relation to weather). In the boxes where indicators and flood factors con-espond, the perfmmances of the indicators are assigned in appropriate units.
This data input into the effects table was done by the four representatives of the authorities; namely DID, DOE, DBKL and MMD. Looking at the main objectives, physical planning aspect is reflected in DBKL as one of the authorities, engineering aspect is reflected in DID and partly the DOE, and the environment aspect is reflected in DOE and MMD. All the interviewees are from the public sector because a greater number of people are affected by the decisions that are made in comparison with other sectors such as NGOs and private sector. The method of data input is through interview and telephone
7
DEFINITE2.0 software (2000) was developed by the Institute for Environmental Studies, Vrije University, Amsterdam, The Netherlands.
Nur Fazzillah Afuhamed Noordin, Alias Abdullah & Afuhammad Nur Azraei Shahb11di11 ,\111/ticriteria Analysis of Flood Causes in Kuala Lumpur
interview. In some cases, one officer did not have all the data required; therefore the survey is continued with other officers within the department.
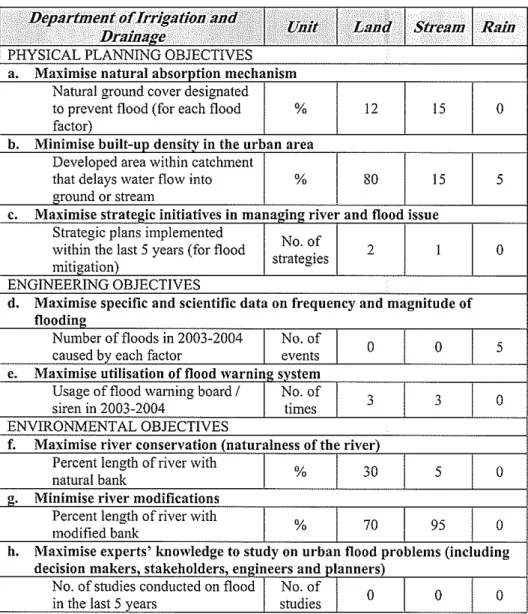
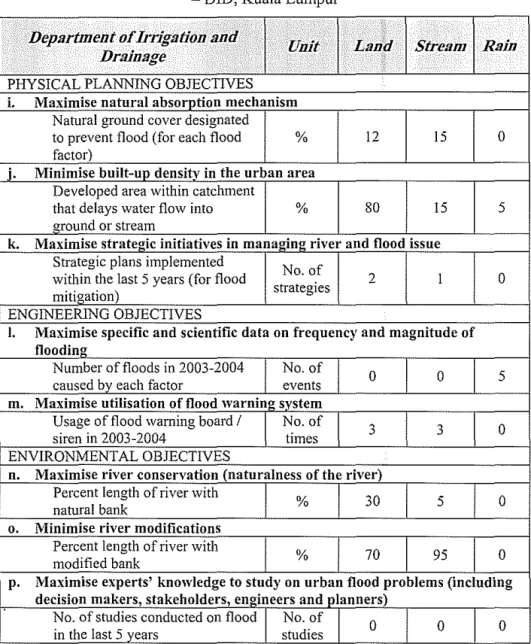
Table 5 shows the effects table as filled in by representatives of the Department of Irrigation and Drainage (DID). According to DID, the data in this effects table is estimation and is not conclusive.
Table 5: Effects table showing perfonnance of each flood occurrence factor - DID, Kuala Lumpur
Department of Irrigation and. · ..
Unit Lan<f Stream Rain
. Drainaee . ·
.
PHYSICAL PLANNING OBJECTIVES a. Maximise natural absorption mechanism
NatLtral ground cover designated
to prevent flood (for each flood % 12 15 0
factor)
b. Minimise built-up density in the urban area Developed area within catchment
that delays water flow into % 80 15 5
ground or stream
c. l\tlaximise strateQ:ic initiatives in manaQ:in!! river and flood issue
Strategic plans implemented
No. of within the last 5 years (for flood
strategies 2 1 0
mitigation)
ENGINEERING OBJECTIVES
d. Maximise specific and scientific data on frequency and magnitude of floodine
Number of floods in 2003-2004 No. of
0 0 5
caused by each factor events
e. Maximise utilisation of flood warnine system
Usage of flood waming board I No.of
3 3 0
siren in 2003-2004 times
ENVIRONMENTAL OBJECTIVES
f. Maximise river conservation (naturalness of the river)
Percent length ofriver with
% 30 5 0
natural bank
g. Minimise river modifications
Percent length of river with
% 70 95 0
modified bank
h. Maximise experts' knowledge to study on urban flood problems (including
decision makers, stakeholders, en!!ineers and olanners)
No. of studies conducted on flood No. of
0 0 0
in the last 5 years studies
N
'-0
GOAL
To seek for the most significant urban flood factor (contributor)
-~
"
ug
I
Physical planning Engineering objectiveI
EnvironmentalI
c ·;;:: ::;:
"
·i::"
8
~
u'E ,E r Maximise natural absorption 1ncchanism
(
Natural ground cover ©2007 byMJP Minimise built-up density in the urban area'
Maximise strategic initiatives in n1anaging river and flood issue(
Strategic
plans ilnplcmcntc
d within the
Maximise specific and scientific data on frequency and magnitude of
flooding
Number of floods in 2003-2004
caused by
each factor
Maxilnisc utilisation of flood warning system Usage of flood warning board I
siren r Maximise river conscrvatio 11 (naturalness of the river)
(
Percent length of river with natural bank Minilnisc river modificatio ns Percent length of river with modified bank Developed area within catchment that delays water flow into ground or strcan1last 5 years for floods
-~z
~,,~r'=l
Lan~
\tre;ncI
RainI
Figure 3 : The Evaluation Structure
--i
Maximise experts' knowledge to study on urban flood problems (including decision makers,
etc.)
,....,
No. of studies conducted on
flood
~;::--'
8 .,, §
0 t
.2 "
Nur Fa;;;;i/lah ,\luhamed Noordin, Alias Abdullah & i\111/iammad Nur A;;raei Shahbudi11 ,\fulticriteria Analysis of Flood Causes in Kuala Lumpur
Table 5: Effects table showing performance of each flood occurrence factor - DID, Kuala Lumpur
Department of h-rigation and
Unit Ladd Stream Rain
Drainage .
PHYSICAL PLANNING OBJECTIVES i. Maximise natural absorption mechanism
Natural ground cover designated
to prevent flood (for each flood % 12 15 0
factor)
i. Minimise built-up density in the urban area
Developed area \Vithin catchment
that delays water flow into % 80 15 5
ground or stream
k. Maximise strategic initiatives in managing river and flood issue
Strategic plans implemented
No. of within the last 5 years (for flood
strategies 2 l 0 mitigation)
ENGINEERING OBJECTIVES
I. Maximise specific and scientific data on frequency and magnitude of flooding
Number of floods in 2003-2004 No. of
0 0 5
caused bv each factor events
m. Maximise utilisation of flood \Varnin!! system
Usage of flood \Yarning board I No. of
3 3 0
siren in 2003-2004 ti1nes
ENVIRONMENTAL OBJECTIVES
n. Maximise river conservation (naturalness of the river)
Percent length of river \Vith
% 30 5 0
natural bank
o. Minimise river modifications Percent length of river with
% 70 95 0
modified bank
p. Maximise experts' knowledge to study on urban flood problems (including
decision makers, stakeholders, engineers and planners)
No. of studies conducted on flood No. of
0 0 0
in the last 5 vears studies
PLAI't'Nfl't'G ilfALA YSIA Journal of the Afalaysian l11slil11te of Planners (2007)
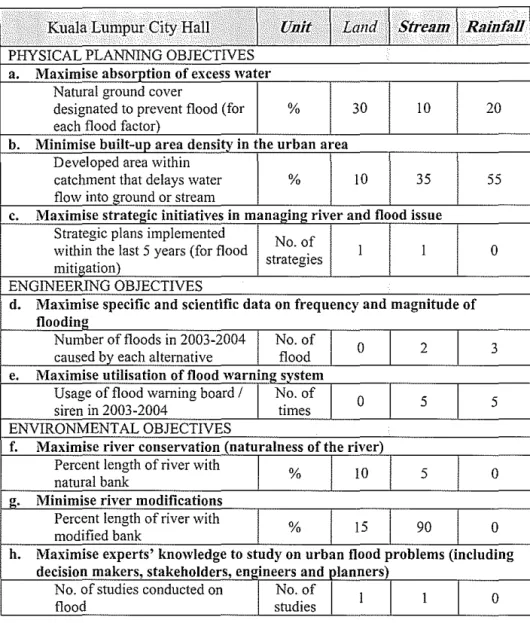
Table 6: Effects table showing perf01mance of each flood occurrence factor
- DOE, Kuala Lumpur
..- --_ ;:\•';-: - :. ___ :_-- --:,-;:.-:--:----_-,'--_J'."<_' -:-_'-___ --- --- -.:::<<»l'i": :>/<>.:· _ _,_ __ :.:J ,:::~:-:.__:.;_-.:;_;:,::;::::::<: I',,:::>·,.
· 'DepirtinentofEnvimnment"•'
-_ :<_--,-.---::-.:.__-<--"{--_:'·;.:>;.'';';';--;:_.;.:._:,_,---_______ :>---"I
_-.;.l,',Yf•m
:·::-:'<:-<<;(_:::-_:_<jj_-:-y ;/•;: _--. -_:-'....
ueam
.... •.•·.•· "'' --- -PHYSICAL PLANNING OBJECTIVES
a. Maximise absorotion of excess water Natural ground cover designated
to prevent flood (for each flood % 7 30 5
factor)
b. Minimise built-un area density in the urban area Developed area within catchment
that delays water flow into % 75 15 3
ground or stream
c. Maximise strateP-ic initiatives in manaqinq river and flood issue
Strategic plans implemented No. of
within the last 5 years (for flood strategie 3 2 0
mitiP"ation) s
ENGINEERING OBJECTIVES
d. Maximise specific and scientific data on frequency and magnitude of floodin"
Number of floods in 2003-2004 No. of
3 2 3
caused bv each factor events
e. Maximise utilisation of flood warnino svstem Usage of flood warning board I No.of
0 3 5
siren in 2003-2004 times
ENVIRONMENTAL OBJECTNES
f. Maximise river conservation <naturalness of the river)
Percent length of river with
% 15 15 70
natural bank
"·
Minimise river modificationsPercent length of river with
% 15 80 5
modified bank
h. Maximise experts' knowledge to study on urban flood problems (including
decision makers, stakeholders, enP"ineers and l Ianners) No. of studies conducted on flood No.of
0 0 0
studies
© 2007 byMIP 31
Nur Fa::il/ah ,\fulwmed Noordin, Alias Abd111/ah & Afuhammad Nur A:raei Shahb11di11 ,\fulticriteria Ana~;·sis of Flood Causes in Kuala Lumpur
Table 7: Effects table showing perfonnance of each flood occurrence factor
-DBKL
.
Kuala Lumpur City Hall Unit Land Stream Rainfall
.
PHYSICAL PLANNING OBJECTIVES a. Maximise absorntion of excess \Vater
Na rural ground cover
designated to prevent flood (for % 30 10 20
each flood factor)
b. Minimise built-up area densitv in the urban area Developed area within
catchment that delays water % 10 35 55
flow into Q"round or stream
c. Maximise strategic initiatives in managing river and flood issue Strategic plans implemented
No. of within the last 5 years (for flood
strategies 1 1 0
miti_gation)
ENGINEERING OBJECTIVES
d. Maximise specific and scientific data on frequency and magnitude of flooding
Number of floods in 2003-2004 No. of
0 2 3
caused by each alte1native flood
e. Maximise utilisation of flood \VarninQ: svstem Usage of flood warning board I No. of
0 5 5
siren in 2003-2004 times
ENVIRONMENTAL OBJECTIVES
f. Maximise river conservation (naturalness of the river) Percent length of river with
% 10 5 0
natural bank
2. Minimise river modifications Percent length of river with
% 15 90 0
modified bank
h. Maximise experts' knowledge to study on urban flood problems (including decision makers, stakeholders, eni ineers and lanners
No. of studies conducted on No. of
I 1 0
flood srudies
PLANNING 1lfALA YSIA
Jo11r11al of the Malaysia11 /11stit11te of Pla1111c1;<; (2007)
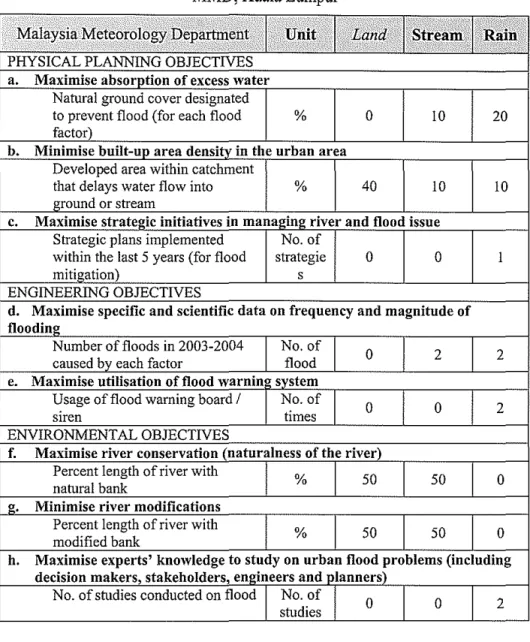
Table 8: Effects table showing performance of each flood occurrence factor
-MMD, Kuala Lumpur
· .. < · ···.· • . • ci.f< •.;, · 1•·;,; •
t<:<l;A·W''';•;, _/./·•
.•.~ Malaysia Meteqr()l(Jgy.J:)eJ:l~~()~1:2Ai<
0 'i , . , , .1.; .. .. .. . ..PHYSICAL PLANNING OBJECTIVES a. Maximise absorption of excess \vater
Natural ground cover designated
to prevent flood (for each flood % 0 10 20
factor)
b. Minimise built-uo area densitv in the urban area
Developed area within catchment
that delays water flow into % 40 10 10
ground or stream
c. Maximise strate2:ic initiatives in manae:ine: river and flood issue
Strategic plans implemented No. of
within the last 5 years (for flood strategie 0 0 I
mitioation) s
ENGINEERING OBJECTIVES
d. Maximise specific and scientific data on frequency and magnitude of flooding
Number of floods in 2003-2004 No. of
0 2 2
caused by each factor flood
e. Maximise utilisation of flood \varnin svstem
Usage of flood warning board I No.of
0 0 2
siren times
ENVIRONMENTAL OBJECTIVES
f. Maximise river conservation (naturalness of the river)
Percent length of river with
% 50 50 0
natural bank
g. Minimise river modifications
Percent length of river with
% 50 50 0
modified bank
h. Maximise experts' knowledge to study on urban flood problems (including decision makers, stakeholders, en2ineers and 1 lanners)
No. of studies conducted on flood No. of
0 0 2
studies
Multicriteria Analysis
After completing the objective information in the effects tables, the three flood factors were computed and analysed to show the overall performance of the flood factors. Because the indicators used to measure the performance of each factor have different units of measurement with varying magnitudes, before any
Nur Fa=zillah Afuhamed Noordin, Alias Abd11/lah & Af11hammod Nur A=raei Shahb11di11 /lfu/ticriteria Ana(rsis of Flood Causes in Kuala Lumpur
further processing can be done, they are put through a standardisation procedure reflecting the accuracy of each of the three flood factors. At the next step the standardised indicator scores of the factors were aggregated into a composite index representing the overall accuracy of each flood factor. These overall perfonnance scores are used to rank the three factors. The overall performance of the flood factors is shown in Figure 4, 5, 6, 7, and 8 in the following pages. The boxes similar to a bar graph are a graphic presentation of the indicators in the effects table. The higher the box is, the better the performance.
Figure 4 shows the scores of DID as mostly for land and stream factors. The DOE in Figure 5 is somewhat more balanced on average for the three factors, although for the separate indicators there are significant differences. DBKL as depicted in Figure 6, and MMD as shown in Figure 7, have markedly higher scores for the land and rain factors respectively. Figure 8 shows the overall performance of all authorities on each flood factor.
DID
TOTAL
Natural ground cover designated for each flood factor to prevent flood
Developed area within catchment that delays water flow into ground or stream
Strategic plans implen1ented \Vithin the last 5 years for floods
Number of floods in 2003-2004 caused by each
alternative
Maximise usage of flood warning board I siren
Percent length of river with natural bank
Percent length of river \Vith modified bank
0.71
0.77
O.B
0,69
0.43
PLA1V1V/NG 1lfALA YSIA Journal of the Malaysia11 /11stit11te of Planners (2007)
0.62 0.55
No. of studies conducted r0~.5~9---,,--"=, on flood
Land Stream Rain
Figure 4: The overall perfmmance of each factor on different indicators (equal weight for each objective) - Department oflrrigation and Drainage
Nur Fa==illah ,'v/11/iamed Noordin. Alias Abdullah & ,\Iuhammad Nur A=raei Shaltbudin 1\fulticri1eria Analysis of Flood Causes in Kuala Lumpur
DOE
TOTAL
Natural ground cover designated for each flood factor to prevent flood
Developed area within catchment that delays ·water flow into ground or stream
Strategic plans implemented within the last 5 years for floods
Number of floods in 2003-2004 caused by each alternative
ivlaximise usage of flood warning board I siren
Percent length of river with natural bank
Percent length of river with modified bank
No. of studies conducted on flood
0.52
0.29
0.38
0.56 0.72
0.21
0.63 0.64
0.35
0.76
0.45
0.76 0.44
0.28
0.49
Stream Rain Land
Figure 5: The overall performance of each factor on different indicators (equal weight for each objective)-Department of Environment
DBKL
TOTAL
Natural ground cover designated for each flood factor to prevent flood
Developed area within catchment that delays water flO\V into ground or stream
Strategic plans implemented \vithin the last
5 years for floods
Number of floods in 2003-2004 caused by each alternative
Maximise usage of flood warning board I siren
Percent length of river with natural bank
Percent length of river with modified bank
No. of studies conducted on flood
-~--,
0.85
0.88
0.75
0.88
0.46
0.88
0.88
Land
PLANNIJ\'G ilfALA YSIA Journal of the .Afalaysian !11stit11tc of Plaimers (2007)
_,_,
________
·~-·-0.41
0.54
0.41 0.19
0.76
0.19
0.19
0.76 0.62
0.19
0.19
Stream Rain
Figure 6: The overall performance of each factor on different indicators (equal weight for each objective) - City Hall Kuala Lumpur
Nur Fazzillah }vfuhamed Noordi11, Alias Abdullah & frluhammad Nur Azraei Shahb11di11 Afulticriteria Analysis of Flood Causes in Kuala Lumpur
MMD
0.66
TOTAL 0.33
Natural ground cover designated for each flood
factor to prevent flood 0.46
Developed area within catchment that delays
0.62
\vater flow into ground or 0.41 streain
Strategic plans 0.8
implemented within the
last 5 years 0.16 for floods
Number of floods in
2003-2004 caused by each 0.37 alternative 0.16
0.8
Maximise usage of flood warning board I siren
0.16
Percent length of river 0.59
0.37
with natural bank
Percent length of river
\Vith modified bank 0.16
No. of studies conducted
on flood 0.18 0.23
0.14
0.14
0.14
0.14
0.57
0.14
0.14
Rain Streatn Land
Figure 7: The overall perfonnance of each factor on different indicators (equal weight for each objective) - Malaysian Meteorological Service
TOTAL
Perspective: MMD
Perspective: DBKL
Perspective: DOE
Perspective: DID
PLA1V1VIJ\'G 1lfALA l'SIA Jo11r11af of the 1ifafaysia11 lnsti/11/e of Pla1111ers (2007)
0-53 0.51 0.45
0.4
0.44
0,53
0.44 0.45
0.59 0.59
Stream Land Rain
Figure 8: Overall perfmmance of all authorities on each flood factor
From the standardisation procedure resulting in overall perfonnance of the effects table, the performance of each indicator is now tested on the flood factors through a more detailed pairwise comparison of the importance of the effects. This second pai1wise comparison has each representative assigning weights resulting in a 'weighted summation'. 'Weights' is the value assigned to each effect in comparison to other effects. The standardized values of the effects are multiplied with the effective weights of the effects. The flood factor with the highest score is considered the best. The pie corresponds to the results. bar, which eventually shows the flood factor of choice of the authorities.
Unlike the first structured pai1wise comparison that resulted in physical planning as being the strongly important objective, the weighted summation shows a different aspect. The DOE representative's estimation from the effects
Nur Fa=zillah ,\fuhamed Noordi11, Alias Abdullah & A/11/iammad Nur A;;raei Sliahbudin ,\lulticriteria Analysis of Flood Causes in Kuala Lumpur
table shows the weighted summation results as 'stream' being the main flood factor. On the other hand, MMD representative's estimation shows the weighted summation results as 'rain'. In this aspect, DOE and MMD seem to present opposing estimation as compared to their priority assessment results.
Figure 9 shows the overall rank of each flood factor tallied to the authorities based on the previous weight summation exercise. This is to show that stream factor emerged as the first ranked flood factor, closely followed by land factor.
TOTAL
MMD
0.85
DBKL
DOE
DID
0.23
Stream Land Rain
Figure 9: Overall rank of all authorities on each flood factor
CONCLUSION
PLANl't'ING ft/ALA YS/A Journal of the A!falaysian I11stit11te of Plmmers (2007)
Ackoffs (1977) warning that 'an optimal solution is not an optimal solution to
a problem unless a model is a pe1fect representation of a problem' rings true. From many dimensions such as literatures, public opinion surveys, questionnaires, etc., it is obvious that a flood is caused by any of these three major factors i.e. land, stream, and rain. This study proves that it can demonstrate a systematic approach to evaluate the major causes of urban floods.
Several conclusive outcomes can be emphasised. Firstly, through the pairwise comparison, all the four authorities agree that physical planning is the principal objective in solving flood problems in Kuala Lumpur. Secondly, the results of MCA show two out of four authorities choosing 'land' factor as the primary cause of flooding in urban area. However, the total score for 'stream' factor is slightly higher than 'land' factor even if it is the primaiy choice of only one authority. Thirdly, in tenns of weight assignment of indicators, three out of four authorities assigned the highest weights on those indicators originating from physical planning objective in the criteria structure.
The connection between the results of pairwise comparison and MCA generally correspond to each other. Physical planning as the principal objective is consistent with 'land' factor, as in this study 'land' is a broad te1m for urbanisation, which is an aspect of physical planning. Thought there is no right or wrong answers, from the background study of the previous chapters it appears that the 'land' factor is indeed the topmost priority in controlling the flood problem because it is within our control.
As opposed to 'stream' and 'rain' which are natural elements that are difficult for man to change, 'land' is the only factor here that is governed by man-made laws, subject to man's activities and is directly within our control. 'Stream' and 'rain' are not 100% within our control even in terms of forecast; therefore, although each authority sets it as a priority, it does not justify their choice of physical planning as the main objective. The soil on riverbanks is naturally absorbent and can retain water. A river that is still flowing in its original form is able to retain water without bursting its banks during light rain. It is this characteristic of the river that we have to preserve by keeping the soil free from unnatural and impervious surfaces.
Nur Fa==illah ;\Juhamed Noordill. Alias Abdullah & A111hammad Nur A=raei Shahbmlin A111lticriteria Analysis of Flood Causes in Kuala Lumpur
REFERENCES:
Alias Abdullah et al. 2004. 'Spatial Planning and Decision Support System for Modelling Water Resources' in Water Environmelllal Planning: Towards
Integrated Planning and Management of Water Resources for Environmelllal Risks, IIUM, Kuala Lumpur, pp 261-282.
Ali Sharifi et al. 2004. 'Evaluating Rail Network Options Using Multiple Criteria Decision Analysis: Case Study Klang Valley, Malaysia' in
Applications of Planning and Decision Support Systems, IIUM, Kuala
Lumpur, pp 21-60.
Salmah Zakaria 2004. 'Integrated River Basin Management' in Water
Environmental Planning: Towards Integrated Planning and Management of Water Resources for Environmentol Risks, IIUM, Kuala Lumpur, pp
19-44.
Malczewski, Jacek 1999. GIS and Multicriteria Decision Analysis, John Wiley
& Sons Inc, New York.
Asakawa S. et al. 2004. 'Landscape change and the urbanisation process in Europe' in Intemational Joumal of Landscape and Urban Planning, Vol. 67, Elsevier, pp. 9-26.
Asian Development Bank 2002. Handbook on Environment Statistics, ADB Davide Geneletti 2005. 'Multicriteria analysis to compare the impact of
alternative road cotTidors: a case study in northern Italy' in Impact
Assessment and Project Appraisal, Vol. 23, Beech Tree Publishing, pp.
135-146