Comparing Evolutionary Operators, Search Spaces, and Evolutionary
Algorithms in the Construction of Facial Composites
Joseph James Mist, Stuart James Gibson and Christopher John Solomon School of Physical Sciences, University of Kent, Canterbury, United Kingdom E-mail: [email protected], [email protected], [email protected]
Keywords:interactive evolutionary algorithm, facial composite
Received:December 1, 2014
Facial composite construction is one of the most successful applications of interactive evolutionary com-putation. In spite of this, previous work in the area of composite construction has not investigated the algorithm design options in detail. We address this issue with four experiments. In the first experiment a sorting task is used to identify the 12 most salient dimensions of a 30-dimensional search space. In the sec-ond experiment the performances of two mutation and two recombination operators for interactive genetic algorithms are compared. In the third experiment three search spaces are compared: a 30-dimensional search space, a mathematically reduced 12-dimensional search space, and a 12-dimensional search space formed from the 12 most salient dimensions. Finally, we compare the performances of an interactive genetic algorithm to interactive differential evolution. Our results show that the facial composite construc-tion process is remarkably robust to the choice of evoluconstruc-tionary operator(s), the dimensionality of the search space, and the choice of interactive evolutionary algorithm. We attribute this to the imprecise nature of hu-man face perception and differences between the participants in how they interact with the algorithms.
Povzetek: Kompozitna gradnja obrazov je ena izmed najbolj uspešnih aplikacij interaktivnega evoluci-jskega raˇcunanja. Kljub temu pa do zdaj na podroˇcju kompozitne gradnje niso bile podrobno raziskane možnosti snovanja algoritma. To vprašanje smo obravnavali s štirimi poskusi. V prvem je uporabljeno sortiranje za identifikacijo 12 najbolj izstopajoˇcih dimenzij 30-dimenzionalnega preiskovalnega prostora. V drugem primerjamo uˇcinkovitost dveh mutacij in dveh rekombinacijskih operaterjev za interaktivni genetski algoritem. V tretjem primerjamo tri preiskovalne prostore: 30-dimenzionalni, matematiˇcno re-ducirani 12-dimenzionalni in 12-dimenzionalni prostor sestavljen iz 12 najpomembnejših dimenzij. Na koncu smo primerjali uspešnost interaktivnega genetskega algoritma z interaktivno diferencialno evolucijo. Rezultati kažejo, da je proces kompozitne gradnje obrazov izredno robusten glede na izbiro evolucijskega operatorja(-ev), dimenzionalnost preiskovalnega prostora in izbiro interaktivnega evolucijskega algoritma. To pripisujemo nenatanˇcni naravi percepcije in razlikam med interakcijami uporabnikov z algoritmom.
1
Introduction
Consider a situation in which a person witnesses a crime being committed by an unknown perpetrator. In the in-terests of identifying and subsequently locating the perpe-trator, a facial image is often created from the witnesses’ memory of the event. The traditional method is for the witness to select, from a database, individual facial fea-tures which a composite system operator then combines to form a likeness to the perpetrator called afacial compos-ite. However, psychological research has shown that peo-ple generally recognise faces as whole objects (holistically) as opposed to recognising faces as collections of individual features [24, 6]. Also, people find it difficult to recall faces from memory and describe them whereas recognising an individual from a photograph of their face is a relatively easy task. Holistic methods for facial composite construc-tion have been developed that account for these facets of human memory. EFIT-V [26] and EvoFIT [7] are commer-cial systems based on these principles that were developed
in the early 2000s. EFIT-V is now used by over 75% of police constabularies in the UK and by many other law en-forcement agencies in countries around the world.
The holistic method represents faces as points in a mul-tidimensional search space. In our work, we refer to such a search space as aface-spacedue to its conceptual simi-larity to the notion of face-space in cognitive psychology research [25]. The key idea is to navigate from an initial starting point navigate to a unique region of face-space that corresponds to a facial likeness of the perpetrator.
ap-proximated by a weighted sum of the PCs.
To produce a likeness of a perpetrator, some process for searching the face-space is required. A simple approach is to use a bank of sliders in which each slider corresponds to a single PC. This method has been used in a workable com-posite system [3] but has two drawbacks: it is unlikely that any one slider will produce a change in facial appearance that maps to a simple semantic description (e.g. thin face) and the number of permutations of for the bank of sliders becomes cognitively prohibitive even for a relatively small number of PCs.
An alternative, less demanding, method for locating a face in a face-space is to use an iterative process whereby generated faces are assessed by the witness according to their similarity to the perpetrator. This method is imple-mented in EFIT-V and EvoFIT usinginteractive evolution-ary algorithms(IEAs). In IEAs the fitness function evalua-tion, standard in evolutionary algorithms (EAs), is replaced by subjective human evaluation. IEAs are suitable for tasks requiring human assessment of solutions in which input values are difficult to optimise individually because of in-teraction between input values and because of the noisy and imprecise nature of human interaction. Takagi [23] pro-vides many examples of tasks that IEAs have been applied to, including the fitting of hearing aids, graphic art, and in-dustrial design.
Genetic algorithms (GAs) were introduced by Holland in 1973 [12]. GAs can be used to solve problems requiring binary, integer, and real valued inputs and are easy to im-plement. For these reasons, interactive genetic algorithms (IGAs) are a popular choice of IEA. IGAs were used in the implementation of EFIT-V and EvoFIT and have also been applied to tasks such as image filtering [15] and product design [4].
The use of human evaluation places limitations on an IEA which are not usually present in an EA. Fatigue will limit the number of individuals (faces) a user is willing to evaluate. Fatigue also limits the granularity of the scale upon which individuals can be rated. For example, a scale of 1–100 is overly burdensome whereas a simple “good” or “not good” decision is less so [28]. It is a demanding task for users to assign absolute fitness scores to individu-als, which limits the number of individuals that a user can be expected to evaluate. An alternative approach that en-ables users to evaluate more individuals, albeit generally less thoroughly, is to allow the user to compare individuals to each other. For example, individual “A” could be better than, as good as, or worse than individual “B”. The latter approach to evaluation is used in the IEAs implemented for comparison in this work.
When using an EA to solve a problem, care is taken to choose an appropriate algorithm, operators, and parameter values. In most cases it is feasible to perform many runs, comparing different algorithm design options and parame-ter values to see which yield the best result. Such compar-isons are prohibitively difficult when working with IEAs because of the limitations placed by human evaluation.
In an effort to make these comparisons, mathematical
models of human evaluation, which we refer to here as vir-tual users, have been used in place of human participants when optimising aspects of IEAs. These virtual users are effectively EAs implemented with limitations that model those imposed by human evaluation. Virtual users were used in the early development of EFIT-V and EvoFIT to choose effective IGAs, set population sizes, mutation rates, and selection pressures [19, 11, 8, 9].
It is difficult to judge the usefulness of the virtual user approach as there is virtually no work evaluating design decisions at the parameter/operator level of algorithm de-sign that use human participants. An experiment conducted by Breukelaar et al. [2] used a colour matching task to compare the use of three fixed step size and one variable step size mutation parameters in an interactive evolution strategy. The work concluded that using variable step size enabled colour matches to be achieved quicker than using fixed step sizes. Oinuma et al. [18] compared four recombi-nation operators in a face beautification task and concluded that a novel recombination method introduced in the pa-per pa-performed better than existing recombination methods. These results were not confirmed using statistical analysis and therefore it is not known whether the observed differ-ences were due to genuine differdiffer-ences between the opera-tors or if they were due noise in the data gathered. More robust testing of design decisions using human participants is required to gauge whether the comparison of parameter values and operators is useful or whether differences be-tween users generally renders any differences bebe-tween the design options irrelevant.
EFIT-V uses a face-space model determined by 60 PCs [21] whereas the number of PCs used in EvoFIT is harder to discern but [9] and [10] imply that the maximum possible number of PCs is used. The question of the optimal num-ber of PCs to use does not appear to have been addressed since the earliest work in the development of EFIT-V and EvoFIT. The imperfect nature of human face recognition implies that the number of dimensions used in holistic fa-cial composite systems could be reduced significantly with-out any perceived loss in image accuracy. If the number of PCs to be used is reduced then the most obvious PCs to retain are those which account for the most statistical variation in the training set. These PCs may not necessar-ily, however, be those that account for the most perceptual variation. In this paper we ask if human evaluation should play a role in selecting those PCs that are used to create a face-space of reduced dimensionality.
It is reasonable to expect that the difference between al-gorithms is more significant than the difference between operators. Differential evolution (DE) is a relatively recent metaheuristic algorithm having been introduced by Storn and Price in 1997 [22]. Examples of applications for inter-active differential evolution (IDE) include forensic image segmentation [17] and optimising optical illusions [16].
algorithms, including IDE and IGAs, for facial composite construction. It was found that IDE required fewer evalua-tions create a composite but the recognition rate of the IDE composites was lower than for the other algorithms. Lee and Cho [14] compared an IDE algorithm to an IGA and to a direct input manipulation method for an image enhance-ment task and found that participants generally favoured the IDE algorithm for usability. In neither of these experi-ments was a statistical comparison between the algorithms undertaken and so it is unknown whether these results are reliable.
In this work we construct a 12-dimensional “human reduced” face-space using human evaluation of the dif-ferences between pairs of faces drawn from a larger 30-dimensional face-space. We then compare two mutation operators and two recombination operators in an IGA us-ing a task in which participants create facial composites from memory. In the third experiment the performance of searches using the human-reduced face-space, developed in the first experiment, is compared to that of the larger 30-dimensional face-space and a “mathematically reduced” 12-dimensional face-space using the same facial compos-ite task. In the final experiment, we compare an IGA to an IDE algorithm.
2
Theory
2.1
Face-space model
A face-space model was constructed that captures the nat-ural variation of shape and texture (the shading and colour) of human faces. The training set of photographs used to build our face-space model consists of 27 male and 63 fe-male faces of various ages. The model building process starts with manually placing 190 land mark points on each photograph to delineate the key facial features at, for ex-ample, at the corners of the eyes, the bottom of the chin, and the outline of the eyebrows. The face shape of each subject in the training set is hence defined by a 380 dimen-sional vector containing the x-y coordinates of 190 land mark points.
The face shapes are aligned, using the Procrustes method, and the mean face shape ¯s calculated. Princi-pal components analysis (PCA) is used to reduce the 380-dimensional shape model to a smaller number of dimen-sions. Any face shapescan then be approximated asbsby the shape model using
bs=Psbs+ ¯s (1)
where Ps are the PCs of the shape model ordered from
most important (the PCs which account for the most vari-ance in the data) to least important andbsis a vector of
pa-rameters that determine how the shape PCs are combined to make the face shape.
In order to create the texture model that encodes the image pixel values, each photograph in the training set is
partitioned using its land mark points and Delaunay tri-angulation. Piecewise affine transforms are used to warp each training image to the mean face shape thereby form-ing shape normalised texture patterns. PCA is then used to find a texture model of much fewer dimensions than the original pixel space of the normalised texture patterns. As with the face shapes, any face texture gmay be approxi-mated using
b
g=Pgbg+ ¯g. (2)
wherePgare the PCs of the face texture ordered from the
most important to least important and bs are parameters
that determine how the texture PCs are combined to make the face texture. Finally, a face-space model is created from the combined shape and texture models using PCA to fur-ther reduce the number of dimensions. Thus, the appear-ance model parameters,c, of any face can be approximated asbcusing
bc=Q
T
wbs bg
≡QT
wPTs (bs−¯s)
PTg (bg−g¯)
(3)
where Q are the appearance PCs of the training set or-dered from the most important to the least important and
wscales the shape parameters such that equal significance is assigned to shape and texture.
New faces can be generated by setting the values of ann -dimensional parameter vectorcand performing the above process in reverse. Starting with the extraction ofb
b=
n
X
i=1
qici (4)
where qi is thei-th column of matrix Q in Equation 3.
The shape and texture parametersbsandbgare extracted
fromband are used in Equations 1 and 2 to find the shape parameterssand texture parametersg. The pixel intensi-ties in gare rearranged into a two-dimensional (or three-dimensional for colour images) array of pixels which then form an intermediate face image with mean face shape. As-pects of the edge of the face image which are due to the land marking process have a dominant unwarranted effect on the perception of the face. To counter this effect the gen-erated face texture is inserted and blended into a softened background. The resulting image is subsequently warped according to the shape parameters,s, to form the final face image.
It is important to note that there are many features which cannot be reproduced using this method. Apart from obvi-ous highly distinctive features such as birthmarks and scars, more mundane high frequency features such as beards and hair cannot be effectively rendered. In commercial soft-ware these features are added separately using overlays and drawing packages.
2.2
The interactive algorithms used
wherenis the number of dimensions of the face-space be-ing used.
A larger population requires more processing time to generate the composites and imposes a greater cognitive burden on the user whereas a smaller population size means that a greater number of generations is required to achieve a satisfactory composite. EvoFIT uses a population size of 18, EFIT-V uses uses a population size of 9. We used a population size of 9 for both the IGA and IDE because this number of images could be displayed at a reasonable scale and also limits the cognitive demands placed on the user when comparing faces.
The IGA used in this work is very similar to that devel-oped by Frowd [8]. Only three levels of fitness evaluation are allowed: preferred (best), selected, and not selected. Every generation exactly one individual is chosen as the preferred individual. This individual is carried unaltered into the following generation. Eight new individuals are needed to populate each generation. Each new individual has two parents and so a mating pool of sixteen individuals is required.
Stochastic universal sampling (SUS) [1] is used to select the parents to go into the mating pool. In SUS a “wheel” bearing a superficial similarity to a roulette wheel, is con-structed based on the fitness values of individuals in the previous generation. In the IGA used in this work, each selected individual is assigned an equal sized section of the wheel except for the preferred individual which is assigned a double sized wedge. To select the parents, a “spinner” comprising sixteen equally spaced arms is spun and for ev-ery arm that “comes to rest” on a particular section the in-dividual corresponding to that section is added once to the parent pool.
Once the parent pool is filled, individuals are drawn from the pool in pairs to undergo recombination to form new in-dividuals. Uniform crossover and arithmetic crossover re-combination operators are used in our experiments. In our implementation of uniform crossover there is equal chance that the offspring will inherit each gene from either parent. In our implementation of arithmetic crossover the value of each gene in an offspring is the mean of the values for that gene in the parents.
After a new individual is created using recombination it undergoes mutation. We used Gaussian addition and Gaus-sian replacement mutation operators in our experiments. In Gaussian addition, the mutated gene valuec0iis given by
c0i=ci+σi·m·ri (5)
whereσiis the standard deviation (SD) of the data on the i-th PC, m is the mutation factor set by the user on the interface, and ri is a random number from the Gaussian distribution N(0,1). Gaussian replacement is the name given in this paper to an analogous method to the uniform mutation operator. In uniform mutation, each geneci in an offspring’s genotype will be replaced, with probability
pm, by a uniformly distributed random valuec0i such that
c0i∈[Lower limit,Upper limit]. The Gaussian replacement operator is similar except thatc0iis a random number taken
fromN(0,1)and multiplied by the SD of the data on thei -th PC. c0i has the further restriction that it is bounded by a hyperrectangle which designates the edge of the face-space, that isc0i ∈ [−2.5,2.5]SDs. This was done to re-duce the likelihood of implausible faces or faces exhibiting image artefacts. The mutation probability is set by the mu-tation slider and is restricted to the range[0, pmax]where
pmax= 5/(the dimensionality of the face-space). The IDE algorithm used is an adaptation of basic DE as presented by Price et al. [20]. In DE each member of the population is the main parent of exactly one offspring. This main parent is thetarget vectorand the offspring is known as the trial vector. Three other parents are used to gen-erate each trial vector; thebase vector and twodifference vectors. Once the trial vectors have been generated each is compared to its target vector. If the trial vector is found to be fitter than its target vector then the trial vector takes the place of target vector in the population.
The first step in creating a trial vector is to create a mu-tant vectoraccording to
xmutant=xbase+F(xdiff1−xdiff2) (6)
wherexbaseis the base vector, xdiff1andxdiff2are the
dif-ference vectors, andFis the mutation scale factor which is usually constrained to the range(0,1). The second step is to cross the mutant vector with the target vector to create the trial vector according to
xi,trial=
xi,mutant ifri<Cr xi,target otherwise
(7)
whereCris the crossover probability andri is a random number drawn from a uniform distribution in the range
(0,1). To ensure that xtrial 6= xtarget, ifxtrial = xtarget
one random position i in xtrial would be set such that xi,trial = xi,mutant. A virtual user was used to find optimal values ofF andCrfor the IDE implemented in this work, as some values ofF andCrcan lead to, for example, pre-mature convergence. The optimal values were found to be
F = 0.6 andCr = 0.5. Preliminary testing with human evaluation confirmed that these values were suitable.
The target, base, and difference vectors were chosen to be different members of the population. Each vector was used as the base vector exactly once per generation. The order for the base vectors was determined using the ran-dom permutation method. The difference vectors for each trial vector were chosen at random from the population ex-cluding the trial vector’s target and base vectors.
3
Software for Experiments 2, 3,
and 4
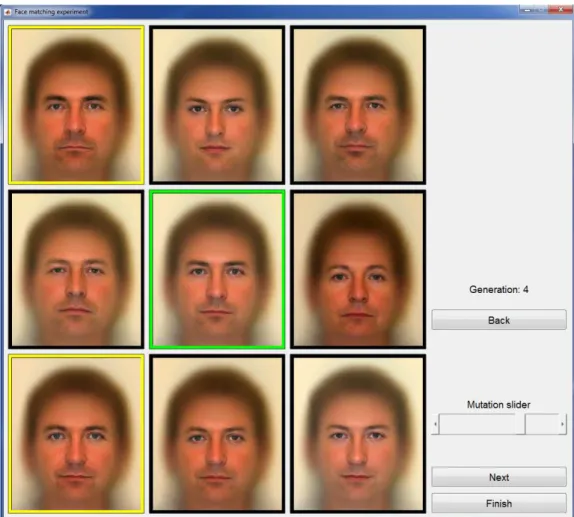
Figure 1: Screenshot of the interface for the IGA
A screenshot of the interface developed for the IGA is given in Figure 1. For every generation the participant would choose, using the left mouse button, exactly one pre-ferred composite face that best resembled the target face they were trying to recreate. Additionally, if the partici-pant thought that any of the other faces were a good like-ness, they had the option of selecting these using the right mouse button. Anywhere from zero to eight faces could be selected in this way. A green border was placed around the face the participant preferred, a yellow border for those faces the participant thought were also good, and a black border for those faces that were not selected. Once they were satisfied that they had selected the best match, and any other matches they considered to be good, the par-ticipant would go to the next generation by pressing the ‘Next’ button. The participant would repeat the process until they thought no further improvement was possible, at which point they would click on the ‘Finish’ button.
A mutation slider was included so that participants could adjust the value of the mutation parameter. For the experi-ments reported in this paper, the mutation slider was decre-mented by0.03per generation by the software (the slider’s range was [0,1]). A ‘Back’ button was included which enabled the participant to go back to the previous
gener-ation and make alternative selections or adjust the muta-tion slider if they were not satisfied with the current gener-ation. This design decision was based on comments from participants in earlier experiments who expressed a desire for such functionality when the population as a whole was worse than that of the previous generation.
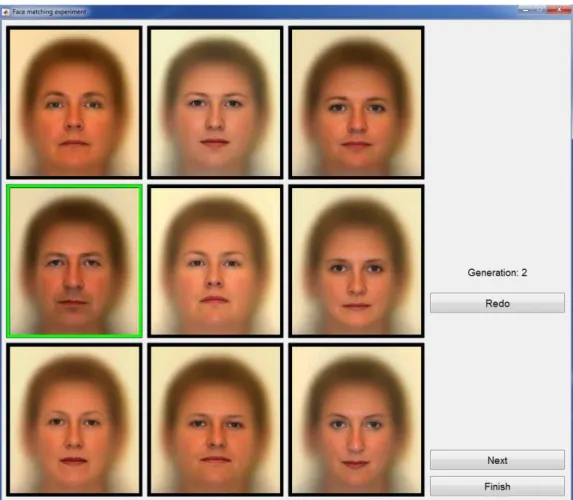
Figure 2: Screenshot of the main interface for the IDE algorithm
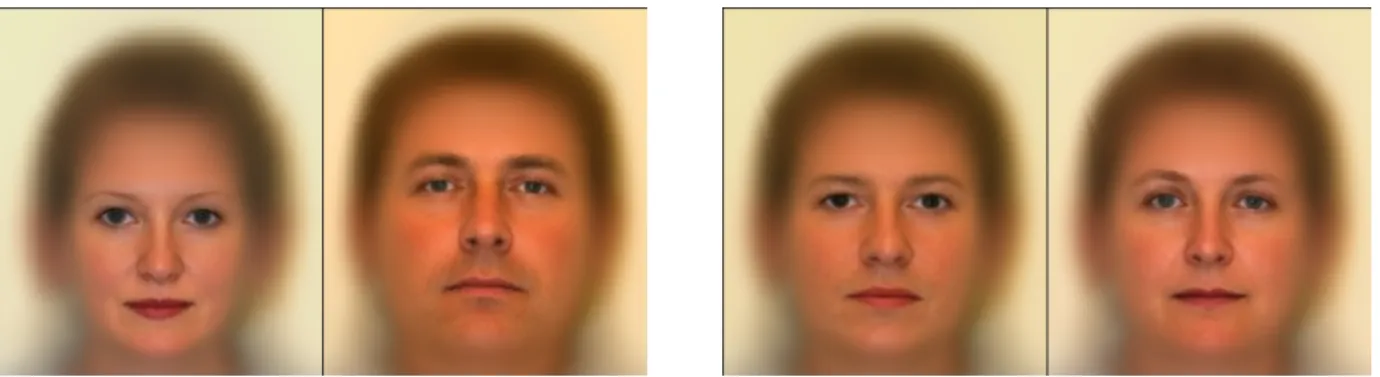
(a) Faces generated at±3SDs on the 1-st PC (b) Faces generated at±3SDs on the 30-th PC
Figure 4: The pairs of faces at±3SDs on the 1-st and 30-th PCs
4
Experiment 1: Identifying the
most perceptually significant PCs
4.1
Method
In the first experiment 32 participants performed a face sorting task to determine which 12 of the first 30 PCs, de-rived using PCA, are perceptually most significant. Ac-cordingly, thirty pairs of faces were generated from the first 30 PCs. Each pair of faces was constructed from points at ±3 SDs along one of the PCs. If we form a ‘large’ 30-dimensional face-space in which a face’s representation is given byc = [c1, c2, . . . , ci, . . . , c30] then each pair of
points(c+k,c−k)representing a pair of faces has the
face-space coordinates
c±i=
±3 SDs ifi=k
0 otherwise (8) The pairs of faces from the 1-st and 30-th PCs are shown in Figure 4
The faces were printed in their respective pairs on matt photographic paper. Each pair was 5.8 cm high by 10.2 cm wide. There are three reasons why the task was limited to 30 pairs of faces: 30 pairs of faces fit comfortably on a desk’s surface, the differences between each pair of faces becomes smaller for higher order PCs, and the difficulty of the task increases with the number of pairs.
At the start of the experiment the pairs of faces were ar-ranged randomly in a grid six pairs high by five pairs wide. The participants were instructed to group the 12 pairs of faces which “exhibited the most within pair dissimilarity”. Once the participants had done this they were instructed to sort the 12 pairs of faces from the most similar to the least similar. In preliminary testing, it was observed that the de-gree of dissimilarity between pairs of faces became very hard to discern beyond the 12 most dissimilar pairs. Con-sequently, 12 dimensions were used for the human reduced face-space.
4.2
Results
A pair of faces was awarded 12 marks when judged to be the most dissimilar by a participant. Similarly, the second
most dissimilar pair was awarded 11 marks, the third 10 marks and so on until the 12 most dissimilar face pairs had been accounted for. The marks were summed over all of the participants to obtain the aggregated rank order of face pairs and hence the perceptual ordering of PCs. The 12 most perceptually significant PCs were found, in order, to be 1, 2, 3, 5, 15, 7, 4, 14, 13, 6, 18, and 9. These are the PCs that were used to build the human reduced face-space. It can be seen that 8 of the 12 PCs in the human reduced face-space are in the first 12 PCs of the larger 30-dimensional face-space.
5
Experiment 2: Comparison of
recombination and mutation
operators
5.1
Method
In this experiment 15 participants were used to compare two recombination operators (uniform crossover and arith-metic crossover) and two mutation operators (Gaussian re-placement and Gaussian addition).
being at±2.5SDs on each axis. The points were grouped into nine clusters using K-means clustering via Matlab’s
kmeansfunction. The centroids of the nine clusters were used as the genotypes for the initial population of faces.
At the start of each run the participants were given 10 seconds to study the target face which they then tried to recreate from memory using the IGA facial composite pro-cess. The target face was not shown to the participants again until the end of the run. The target faces were cho-sen to be equidistant from the centre of the human re-duced face-space. At the end of every run, participants were shown the composite they had just created and were asked to rate its similarity to the target on a scale from 1 to 10. Composites were then displayed side-by-side with their corresponding target faces and in each case the partic-ipant provided an additional similarity score. The purpose of the without target comparison was to gauge how well the composites matched the faces held in the minds of the participants; in reality witnesses would not have an image of the perpetrator to compare their composites to. The with target comparison was included as a slightly less subjective measure of how good the composites were.
Three sets of objective data were gathered: the time taken to create the composites, the number of generations it took to create the composites, and the number of times the Back button was used. The time taken, and the num-ber of generations, were used as indicators of how quickly the participants were able to attain face matches. The use of the ‘Back’ button was recorded to provide an indication of how often the searches were producing a generation that was worse than the proceeding one.
5.2
Results
Table 1 comprises the means and standard deviations of the following measured variables: number of generations, time taken, number of times the Back button was used, partici-pant rating of their composite without reference to the tar-get, and participant rating of the their composite with ref-erence to the target. Each of the measured variables were subjected to aligned rank transform (ART) with two-way ANOVA [27]; having two mutation operators (Gaussian addition and Gaussian replacement) and two recombina-tion operators (uniform crossover and arithmetic crossover) (Table 2). The differences between the mutation operators, and the differences between the recombination operators, were not significant for any of the measured variables. The interaction between the operators, that is the effect of using any particular mutation/recombination operator pair, was not significant.
6
Experiment 3: Comparison of
Face-Spaces
6.1
Method
In this experiment 21 participants were used to compare three face-spaces: a face-space constructed from the first
30 PCs of the PCA analysis (the large space), a face-space constructed from the first 12 PCs (the mathematically reduced face-space), and a face-space constructed form the 12 most perceptually important PCs identified in the first experiment (the human reduced face-space).
As the results of the second experiment showed no sig-nificant difference between the operators on any of the recorded measures, arithmetic crossover and Gaussian ad-dition were arbitrarily chosen as the operators for this ex-periment.
As there were only three test conditions (large face-space, human reduced face-face-space, and mathematically re-duced face-space) each participant performed two runs for each condition, equal to 2×3 = 6 runs in total. Each participant also performed an additional practice run at the start of the experiment.
The initial populations for each of the face-spaces were generated using the same method as that used in Exper-iment 2. The target faces were chosen to be equidistant from the centre of the 30-dimensional face-space. They were also chosen such that they could not be represented exactly in the two 12-dimensional face-spaces. This was done to model the error in reconstruction associated with using a low-dimensional face-space.
6.2
Results
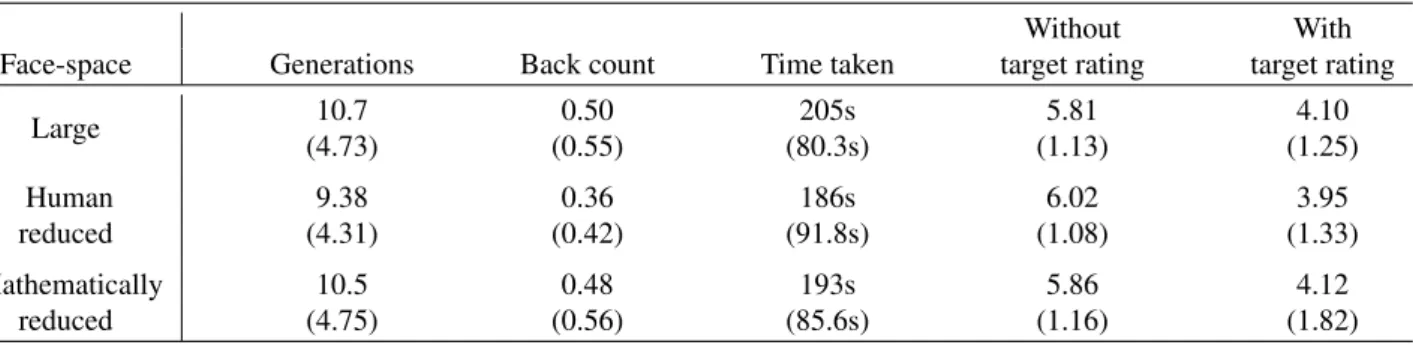
The measured variables were the same as those for Exper-iment 2. The means and standard deviations of the mea-sured variables for each of the face-spaces are presented in Table 3.
Performing Friedman’s test on each of the measured variables showed that the differences between the face-spaces were not significant for any of the measured vari-ables (number of generations: χ2(2) = 2.11, p = 0.349,
number of times the ‘Back’ button was used: χ2(2) = 0.54, p = 0.765, time taken: χ2(2) = 2.14, p = 0.343,
without comparison rating: χ2(2) = 2.37, p= 0.306, and
with comparison rating:χ2(2) = 0.71, p= 0.700).
7
Experiment 4: Comparison of
IGA and IDE
7.1
Method
In this experiment 22 participants were used to compare an IGA to an IDE algorithm.
Table 1: Means (standard deviations) of the dependent variables in the comparison of mutation and recombination opera-tors in the creation of facial composites
Mutation Gauss. replacement Gauss. replacement Gauss. addition Gauss. addition Recombination uniform arithmetic uniform arithmetic
Generations 10.6 (5.10) 12.5 (8.64) 11.5 (4.73) 9.73 (2.49) Back count 0.73 (1.33) 0.47 (0.74) 0.87 (1.41) 0.47 (0.64) Time taken 195s (91.5s) 222s (155s) 220s (71.1s) 188s (66.2s) Without rating 6.27 (1.22) 5.47 (2.00) 6.07 (1.03) 6.07 (1.49)
With rating 4.40 (2.10) 5.07 (2.19) 4.60 (2.41) 4.40 (2.32)
Table 2: ART with two-way ANOVA of the dependent variables in the comparison of mutation and recombination opera-tors in the creation of facial composites
Mutation Recombination Interaction Variable F(1,56) p-value F(1,56) p-value F(1,56) p-value Generations 0.025 0.874 0.041 0.840 0.826 0.367
Back count 0.153 0.670 0.368 0.547 0.055 0.816
Time taken 0.427 0.516 0.553 0.460 0.851 0.360
Without comparison rating 0.132 0.718 0.510 0.478 0.771 0.384
With comparison rating 0.425 0.517 0.214 0.645 0.571 0.529
Table 3: Means (standard deviations) of the dependent variables in the comparison of the large, human reduced and mathematically reduced face-spaces in the creation of facial composites
Without With Face-space Generations Back count Time taken target rating target rating
Large 10.7 0.50 205s 5.81 4.10
(4.73) (0.55) (80.3s) (1.13) (1.25)
Human 9.38 0.36 186s 6.02 3.95
reduced (4.31) (0.42) (91.8s) (1.08) (1.33)
Mathematically 10.5 0.48 193s 5.86 4.12
There were two test conditions (IGA and IDE) hence we had each participant perform two runs using each condi-tion, equal to2×2 = 4runs in total. Each participant also performed two practice runs at the start of the experiment, one for each of the IEAs.
The initial populations were generated using the same method as that used in Experiment 2. The target faces were chosen to be equidistant from the centre of the human re-duced face-space.
7.2
Results
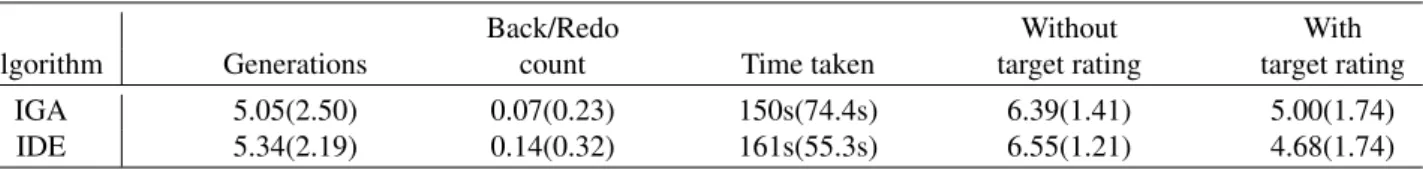
The measured variables were the same as those for Ex-periments 2 and 3 but the use of the IGA’s “Back” button was compared to the use of the IDE’s “Redo” button. The means and standard deviations of the measured variables for each of the algorithms are presented in Table 4.
Performing exact calculations for Wilcoxon’s signed-rank test on the measured variables showed that the dif-ferences between the face-spaces were not significant for any of the measured variables (number of generations:
p= 0.571, number of times the “Back”/“Redo” button was used: p = 0.625, time taken: p = 0.305, without com-parison rating: p = 0.553, and with comparison rating:
p= 0.520).
The participants were also asked which of the two IEAs they preferred as it was possible to differentiate between the IEAs because of the difference between the interfaces. The IGA was preferred by 6 of the 22 participants, 14 pre-ferred IDE and 2 stated no preference. Performing exact calculations for the sign test showed that this difference was not significant: p= 0.115. Those who preferred IDE often stated that they found it easier to compare two faces at a time than nine, which they found made the composite process easier.
8
Conclusion
A human reduced face-space for use with an IEA in the creation of facial composites was derived from a higher dimensional PCA based face-space. The performances of searches for faces in the human reduced face-space were compared to those of a mathematically reduced face-space and to the larger face-space. Searches performed using an IGA with two different mutation operators and two differ-ent recombination operators were compared. Searches per-formed using the IGA were compared to those perper-formed using IDE.
The prioritisation of the PCs with regards to human eval-uation was found to be similar to the numerical ordering returned by PCA itself. The human reduced face-space was found to share 8 of its 12 dimensions with the math-ematically reduced face-space. We note that our data set comprised images captured under conditions of controlled pose, lighting and facial expression. If this were not the case, one might expect greater differences between the
per-ceptual and numerical orderings of PCs. This is because users can filter out variability due to lighting, pose, and camera angle; something that selecting the most significant PCs mathematically does not account for.
No significant differences in the performances of the searches conducted using the different operators were de-tected, nor were any significant differences found between the performances of the IEAs. The difficulty and uncertain nature of creating a facial composite render any difference in the performances of the operators or the IEAs insignifi-cant. This observation calls into question the utility of us-ing virtual users or even testus-ing with human users to aid in making algorithmic design decisions; and lends strength to the idea that it is safe to make these decisions based on the judgement of the people implementing an IEA. Our work also brings into doubt the validity of conclusions in prior work based on experiments with virtual users or where sta-tistical analysis has been omitted.
No significant differences in the performances of the searches conducted in the different face-spaces was ob-served. Again this is likely to be due to the imperfect na-ture of face recall and recognition. This result implies that it is possible to reduce the dimensionality of the face-space without any loss of performance. It also shows that using the mathematical ordering of the PCs is acceptable when truncating the face-space and it is unlikely to be necessary to make allowances for human perception.
References
[1] J. E. Baker (1987) Reducing bias and inefficiency in the selection algorithms,Proceedings of the Second International Conference on Genetic Algorithms, pp. 14–21.
[2] R. Breukelaar, M. Emmerich, T. Bäck (2006) On In-teractive Evolution Strategies,Lecture Notes in Com-puter Science, vol. 3907, pp. 530–541.
[3] R. Brunelli, O. Mich (1996) SpotIt! an interactive identikit system, Graphical Models and Image Pro-cessing, vol. 58, no. 5, pp. 399–404.
[4] F. Cluzel, B. Yannou, M. Dihlmann (2012) Using evo-lutionary design to interactively sketch car silhouettes and stimulate designer’s creativity,Engineering Ap-plications of Artificial Intelligence, vol. 25, no. 7, pp. 1413–1424.
[5] T. F. Cootes, G. J. Edwards, C. J. Taylor (1998) Ac-tive appearance models,Proceedings of the European Conference on Computer Vision (ECCV), pp. 484– 498.
Table 4: Means (standard deviations) of the dependent variables in the comparison of the IGA and IDE algorithm
Back/Redo Without With
Algorithm Generations count Time taken target rating target rating IGA 5.05(2.50) 0.07(0.23) 150s(74.4s) 6.39(1.41) 5.00(1.74) IDE 5.34(2.19) 0.14(0.32) 161s(55.3s) 6.55(1.21) 4.68(1.74)
[7] C. D. Frowd, P. J. B. Hancock, EvoFIT, www.
evofit.co.uk, Accessed 27/04/2015.
[8] C. D. Frowd (2001) EvoFIT: A Holistic, Evolution-ary Facial Imaging System. PhD thesis, Department of Psychology, University of Stirling.
[9] C. D. Frowd, P. J. B. Hancock, D. Carson (2004) EvoFIT: a holistic, evolutionary facial imaging tech-nique for creating composites, Transactions in Ap-plied Perception, vol. 1, no. 1, pp. 19–39.
[10] C. D. Frowd, J. Park, A. McIntire, V. Bruce, M. Pitch-ford, S. Fields, M. Kenirons, P. J. Hancock (2008) Ef-fecting an improvement to the fitness function. How to evolve a more identifiable face,Proceedings of the ECSIS Symposium on Bio-inspired Learning and In-telligent Systems for Security, pp. 3–10.
[11] S. J. Gibson, C. J. Solomon, A. Pallares Bejarano (2003) Synthesis of photographic quality facial com-posites using evolutionary algorithms,Proceedings of the British Machine Vision Conference, pp. 221–230.
[12] J. H. Holland (1973) Genetic algorithms and the opti-mal allocation of trials,SIAM Journal on Computing, vol. 2, no. 2, pp. 88–105.
[13] B. Kurt, A. S. Etaner-Uyar, T. Akbal, N. Demir, A. S. Kanlikilicer, M. C. Kus, F. H. Ulu (2006) Ac-tive appearance model-based facial composite gener-ation with interactive nature inspired heuristics, Lec-ture Notes in Computer Science, vol. 4105, pp. 183– 190.
[14] M.-C. Lee, S.-B. Cho (2012) Interactive differential evolution for image enhancement application in smart phone,Proceedings of the IEEE Congress on Evolu-tionary Computation (CEC), pp. 2411–2416. [15] J. J. Mist, S. J. Gibson (2013) Optimization of
weighted vector directional filters using an inter-active evolutionary algorithm, Proceedings of the Genetic and Evolutionary Computation Conference (GECCO), pp. 1691–1694.
[16] Z. S. Mohamad, A. Darvish, S. Rahnamayan (2011) Eye illusion enhancement using interactive differen-tial evolution, Proceedings of the IEEE Symposium on Differential Evolution, pp. 135-141.
[17] H. Mushtaq, S. Rahnamayan, A. Siddiqi (2015) Color Separation in Forensic Image Processing Using Inter-active Differential Evolution,Journal of Forensic Sci-ences, vol. 60, no. 1, pp. 212–218.
[18] J. Oinuma, K. Arakawa, H. Harashima (2014) Evalu-ation of genetic algorithm for interactive evolutionary face image beautifying system,Proceedings of the 6th International Symposium on Communications, Con-trol and Signal Processing, pp. 594-597.
[19] A. Pallares-Bejarano (2006) Evolutionary Algorithms for Facial Composite Synthesis. PhD thesis, School of Physicial Sciences, University of Kent.
[20] K. Price, R. M. Storn, J. A. Lampinen (2006) Differ-ential evolution: a practical approach to global opti-mization, Springer Science & Business Media.
[21] C. J. Solomon, S. J. Gibson, J. J. Mist (2013) Interac-tive evolutionary generation of facial composites for locating suspects in criminal investigations, Applied Soft Computing, vol. 13, no. 7, pp. 3298–3306.
[22] R. Storn, K. Price (1997) Differential evolution — a simple and efficient heuristic for global optimization over continuous spaces,Journal of global optimiza-tion, vol. 11, no. 4, pp. 341–359.
[23] H. Takagi (2001) Interactive Evolutionary Computa-tion: Fusion of the Capabilities for EC Optimization and Human Evaluation,Proceedings of the IEEE, vol. 89, no. 9, pp. 1275–1296.
[24] J. W. Tanaka, M. J. Farah (1993) Parts and wholes in face recognition,Quarterly Journal of Experimental Psychology, vol. 46A, pp. 225–245.
[25] T. Valentine (1991) A unified account of the effects of distinctiveness, inversion and race in face recognition,
Quarterly Journal of Experimental Psychology, vol. 43A, pp. 161–204.
[26] Visionmetric, EFIT-V,www.visionmetric.com, Accessed 27/04/2015.
[27] J. O. Wobbrock, L. Findlater, D. Gergle, J. J. Higgins (2011) The aligned rank transform for nonparametric factorial analyses using only anova procedures, Pro-ceedings of the SIGCHI Conference on Human Fac-tors in Computing Systems, pp. 143–146.