VOLUME 16 ISSUE 1 (2018), Page 193 – 204
FACTORS INFLUENCING THE WILLINGNESS TO WALK TO THE BUS STOPS IN PENANG ISLAND
Nur Sabahiah Abdul Sukor1 & Siti Fadhlina Muhammad Fisal2
1,2
School of Civil Engineering UNIVERSITI SAINS MALAYSIA
Abstract
This study, investigates pedestrians’ ‘willingness to walk’ to Rapid Penang bus stops in Penang Island. Parameters, such as socio-demographics, walking distance and walking time, were examined to determine factors that influence ‘willingness to walk’. Questionnaire surveys were used to collect the data from 400 participants. The data was analysed using multiple regression analysis through the ‘Statistical Package for the Social Sciences’ (SPSS). Analysis of determinant factors was split into two dependent variables. Firstly, the willingness to walk based on current condition, and secondly, the willingness to walk, if improvements to environment and infrastructure were made to the bus stops. The results showed that socio-demographic factors, such as walking distance, walking time and trip purpose would likely to influence the pedestrians’ ‘willingness to walk’. This study also identified the maximum, minimum, and average distances walked by a pedestrian to reach the bus stops (as well as the willingness travel time.) The outcome of this study will contribute to better planning of transportation system in Penang Island especially on the Penang Transport Master Plan (PTMP) projects.
INTRODUCTION
To achieve sustainable city status, Penang State Government has focused on three issues, crime, cleanliness and traffic congestion (“Penang Transport Master Plan”, 2013). Penang State Government, through continuous effort, has delivered praiseworthy progress; the crime rate has decreased and the environment has seen some regeneration. However, traffic congestion remains a primary concern on Penang Island, due to economic growth and increasing numbers of tourists.
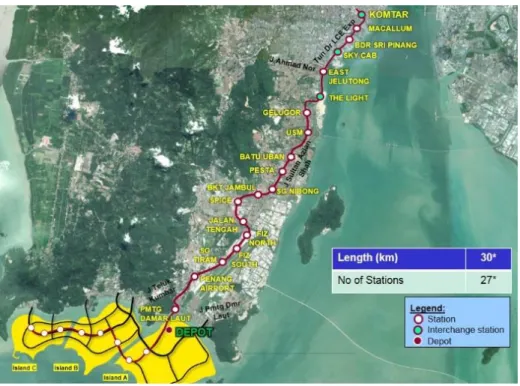
In 2013 the Transport Master Plan Strategy report, was adopted by Penang State Government in a bid to improve the transport system (Pejabat Setiausaha Kerajaan Negeri Pulau Pinang, 2013). The strategy outlines an integrated transit network, with the appropriate long-term capacity to increase public transport adaptation in Penang. The proposed transit lines are Bayan Lepas LRT, Ayer Itam monorail, Tanjung Tokong monorail, and tram services in the Georgetown heritage area. However, this study focuses on the Bayan Lepas LRT network from Kompleks Tun Abdul Razak (KOMTAR), to land considered most suitable for reclamation in the south, made up of 27 stations along a 30-km length network, as shown in Figure 1.
Figure 1: Proposed network of Bayan Lepas LRT line
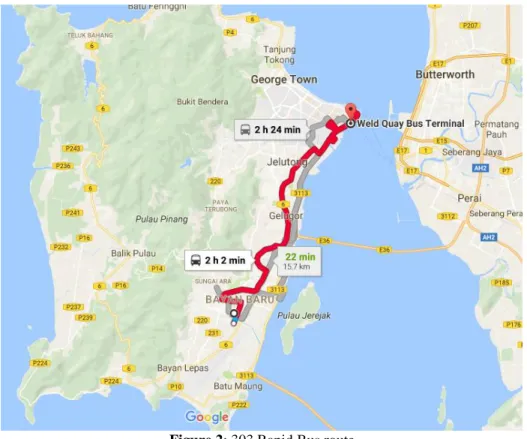
Links between future development of Bayan Lepas LRT and Rapid Penang bus routes have been investigated, finding Route 303 from Weld Quay Port to Persiaran Mayang Pasir to be the most parallel. Consequently, the study of walking accessibility to public transport was done on Route 303, which is expected to support accessibility to the proposed LRT lines. The Rapid Penang bus route is shown in Figure 2.
Figure 2: 303 Rapid Bus route
Source: https://www.google.com/maps. Rapid Penang Route 303
To gain insight on accessibility to the proposed transit network, the primary objective of this research is to identify acceptable walking distances to bus stops, while taking the origin and destination of pedestrians into consideration. The second objective is to analyse factors that affect a bus users’ ‘willingness to walk’.
RESEARCH BACKGROUND
Daniels and Mulley (2013) claim that the impact of socio-demographic factors, has mostly been studied in the context of differentiating factors for ‘willingness to walk’, and travel behaviour. Gender, age, marital status, income; education, and vehicle ownership were all factors. Corpuz, Hay, & Merom (2005) find that females in Sydney walked more than their male counterparts, those older and younger in age walked more, as did people with low car ownership. Moreover, Freeland, Banerjee, Dannenberg and Wendel (2013) state that those from lower income households, living in urban environments with greater access to public transport, were likely to walk more.
In addition,Burke and Brown (2007) used travel data collected from the ‘single weekday travel diaries’ of 10,931 Queensland residents, which included trips to schools, workplaces and shops. The study found 600m to be the average walking distance between homes and local public transport. Meanwhile, analysis of travel data from Sydney found that bus users walked for 50m to access bus services, while train users were willing to walk distances greater than 100m to access train services. The studies showed a marked difference in average walking distances, between users of train and bus services. Findings showed train users were willing to walk up to 2,000m to access services, while those using bus services were only willing to walk up to 1,900m (Daniels & Mulley, 2013).
In addition, Owen, Humpel, Leslie, Bauman and Sallis (2004) categorise three types of walking, including walking for exercise, walking to get to and from places; and total walking. These types of walking had environmental attributes. Pedestrians’ were encouraged to walk when pathways were aesthetically pleasing, convenient, and safe. Walkability, access to public open spaces, and proximity to amenities also encouraged pedestrians to walk. Overall, understanding environmental influences on physical activities such as walking, is important if one wishes to encourage people to walk.
Satisfaction level, is another definitive characteristic when assessing the quality of public transport services (Brons, Givoni, & Rietveld, 2009). Evaluation of public transport user satisfaction, is also influenced by infrastructure, for example, fitted benches and cleanliness. In a study on the ‘Kaohsiung Mass Rapid Transit’ (KMRT) in Kaohsiung City Taiwan, a survey was conducted to collect data on perceived value, and overall user satisfaction with (KMRT) services (Lai & Chen, 2011). The results showed that factors such as service quality, perceived value, overall satisfaction and behavioural intention, had significant implications for public transit companies wishing to increase ridership; and reduce auto dependency. Vehicle safety, facility cleanliness, and customer services were also found to be key components of passenger satisfaction. A study by Efthymiou and Antoniou (2017) further clarify factors affecting user satisfaction. Comfort, staff’ attitude and safety were all sighted.
Wee (2010) observe that motorists and motorcyclist respectively, often parked or rode on accessible pathways, creating safety concerns; and a nuisance for pedestrians. The findings have shown that the provision of safe and comfortable walking environs, alongside thoughtful motorists and appropriate road use, do increase pedestrians’ ‘willingness to walk’ and wait at bus stops.
STUDY METHODOLOGY
Data in this study was sourced using a questionnaire, which focused on Route 303s’ bus stops. The total number of respondents targeted in this study was 400, however, only 392 questionnaires were entirely complete and suitable for analysis. The questionnaire was divided into two parts, Part A and Part B. To qualify the respondents’ socio-demographic, Part A questioned the respondents on age, gender, race, nationality, level of education, status and monthly income. In Part B, respondents were asked how far and how long it took for them to walk to the nearest bus stop. Respondents were also asked how often in the course of a month they use public bus services. Respondents were also questioned on their ‘willingness to walk’ if improvements to pedestrian walkways were made.
Multiple regression analysis was employed to evaluate factors that affect ‘willingness to walk’, such as walking time and walking distance. The dependent variable used was the respondents’ ‘willingness to walk’ to bus stops in present and future conditions, i.e. conditions after improvements are made. The independent variables for analysis were age, gender, nationality and race, status; level of education, monthly income, vehicle ownership, license ownership and satisfaction level; frequency of bus use, distance from home to bus stop, travel time from home to bus stop, existence of pedestrian walkways and trip purpose. The multiple regression equation is shown below (1)
Y = b1X1 + b2X2 + b3X3 +…. + bxXx + a (1)
Where,
Y = dependent variable b = regression coefficient X = independent variable a = constant
RESULTS
Indonesian Malay. The Chinese made up 19.9% of respondents, Indians accounted for 17.1%, and other races, such as Kadazan and Melanau, totalled 21.9%.
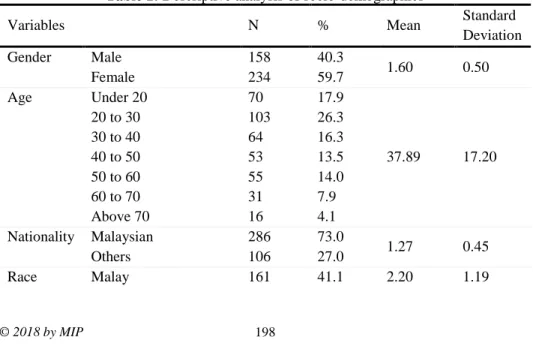
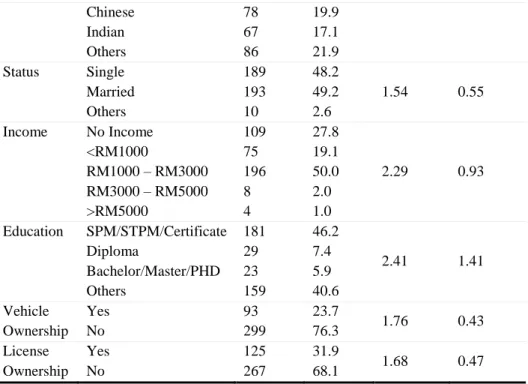
In terms of marital status, 49.2% of respondents were married, 48.2% were single, respondents describing their status as other totalled 2.6%. Analysis of respondents’ monthly income showed 27.8% had no source of income or were dependant on their pensions, 19.1% of respondents had a monthly income of less than RM1,000, 50.1% had a monthly income between RM1,000 and RM3,000, 2.0% had a monthly income between RM3,000 and RM5,000, and 1.0% had a monthly income of more than RM5,000. A total of 46.2% of respondents held SPM or STPM certificates, while respondents with a higher level of education were in the minority; 7.4% held diplomas, and only 5.9% held a Bachelor, Master or PhD. The majority (40.6%), were educated up to secondary school level; though some did not graduate secondary school at all. Further analysis showed 45.4% of respondents were daily users of the Rapid Penang bus service, and 19.6% of respondents used the service 4 to 6 days per week. Those using the bus service less than 4 days per week totalled 14.5%, those using the service only a few days per month accounted for 15.1%, and respondents reporting other frequencies of use totalled 5.4%.
The respondents that owned vehicles at home (23.7%) were less than the respondents that did not own any vehicles at home (76.3%). In detail, the respondents owned at least a car (17.6%), a motorcycle (9.9%) or a lorry/van (1.0%). Moreover, most of the respondents had no driving license either for car, motorcycle or lorry/van (68.1%) and only a few have driving licenses (31.9%). The results can be referred in Table 1 below.
Table 1: Descriptive analysis of socio-demographics
Variables N % Mean Standard
Deviation
Gender Male
Female
158 234
40.3
59.7 1.60 0.50
Age Under 20
20 to 30 30 to 40 40 to 50 50 to 60 60 to 70 Above 70
70 103 64 53 55 31 16
17.9 26.3 16.3 13.5 14.0 7.9 4.1
37.89 17.20
Nationality Malaysian Others
286 106
73.0
27.0 1.27 0.45
Chinese Indian Others 78 67 86 19.9 17.1 21.9
Status Single
Married Others 189 193 10 48.2 49.2 2.6
1.54 0.55
Income No Income
<RM1000
RM1000 – RM3000 RM3000 – RM5000 >RM5000 109 75 196 8 4 27.8 19.1 50.0 2.0 1.0
2.29 0.93
Education SPM/STPM/Certificate Diploma Bachelor/Master/PHD Others 181 29 23 159 46.2 7.4 5.9 40.6
2.41 1.41
Vehicle Ownership Yes No 93 299 23.7
76.3 1.76 0.43
License Ownership Yes No 125 267 31.9
68.1 1.68 0.47
Table 2 shows a descriptive analysis of respondents walking distance and walking time to bus stops along Route 303. The farthest walking distance recorded was between 200m and 400m, reported by 37.2% of respondents. This was the same percentage recorded for respondents who walked less than 200m. However, 11.3% of respondents reported walking more than 1km to get to a bus stop; with the most in this category being foreign workers. In addition, 47.2% of respondents reported travel times of 10 to 20 minutes to reach the nearest bus stop, and 41.1% reported travel times of less than 5 minutes.
Table 2: Descriptive analysis of walking distance (meters) and walking time (minute)
Variables N % Mean Standard Deviation
Walking distance (m) < 200 200 – 400 400 – 700 700 – 1000 >1000 146 146 38 18 44 37.2 37.2 9.7 4.6 11.3
2.15 1.282
Walking time (min) < 5 minutes 10 – 20 minutes 20 – 30 minutes >30 minutes 161 185 24 22 41.1 47.2 6.1 5.6
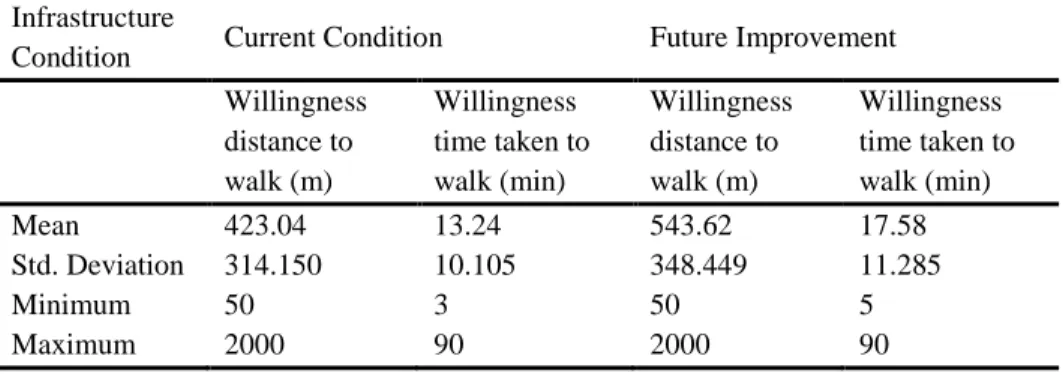
In terms of questions asked regarding ‘willingness to walk’, Table 3 shows the comparative results between current and proposed future conditions; where future conditions assume improvements to infrastructure have been made.
Table 3: Descriptive statistic of willingness to walk based on distance and time Infrastructure
Condition Current Condition Future Improvement
Willingness distance to walk (m)
Willingness time taken to walk (min)
Willingness distance to walk (m)
Willingness time taken to walk (min)
Mean 423.04 13.24 543.62 17.58
Std. Deviation 314.150 10.105 348.449 11.285
Minimum 50 3 50 5
Maximum 2000 90 2000 90
Findings based on current conditions show that the minimum distance respondents were willing to walk was 50m, while the maximum distance was 2km. The average distance walked based on current conditions was between 400m to 500m. Respondents reported their preferred travel times as a minimum of 3 minutes, a maximum of 90 minutes, and an average time of 13 minutes. Foreign workers were found to be more amenable to longer walking distances and walking times. Findings based on future conditions, i.e. if improvements to pedestrian walkways were made, show respondents were willing to walk between 500m to 600m. Future conditions had no bearing on the minimum and maximum distances that respondents were willing to walk. Future conditions did have a bearing on walking time, with respondents reporting extended travel times of up to 18 minutes being agreeable, if improvements to pedestrian walkways were made.
To understand factors affecting ‘willingness to walk’ to bus stops based on current conditions, multiple regression analysis was applied, with walking distance as the dependent variable being considered.
Table 4: Multiple regression analysis of willingness distance to walk based on current condition
Model
Unstandardized Coefficients
Standardized Coefficients
t Sig.
B Std. Error Beta
(Constant) 291.486 82.147 3.548 .000
Nationality -133.314 32.849 -.189 -4.058 .000
Home based Trip Purpose -123.271 33.999 -.181 -3.626 .000
Pedestrian Walkway 92.556 30.916 .137 2.994 .003
Status 73.965 28.535 .118 2.592 .010
Gender -63.919 30.017 -.100 -2.129 .034
Dependent Variable: Willingness to walk based on current condition, & considering distance
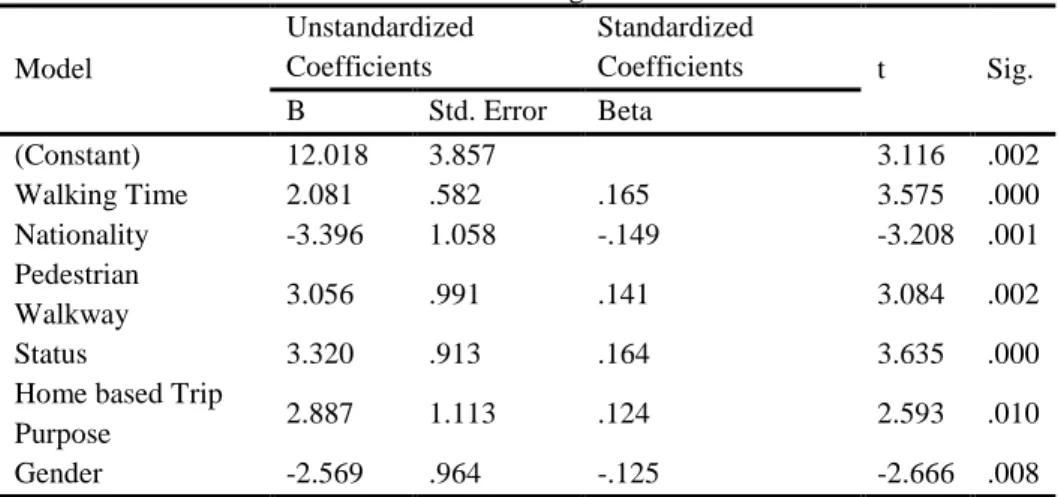
Table 5 shows the results of multiple regression analysis on ‘willingness to walk’, based on current conditions and considering travel time. Findings show that walking distance, nationality, type of trip, satisfaction level regarding pedestrian walkways; marital status and gender, are independent variables that influence ‘willingness to walk’. Results indicate that respondents with longer walking times were non-Malaysian, satisfied with pathway conditions, involved with home-based trips, females; and those that are married, were also more likely to walk for a longer period of time. When analysed, both dependant variables were found to be similar.
Table 5: Multiple regression analysis of willingness to walk based on current condition & considering time
Model
Unstandardized Coefficients
Standardized
Coefficients t Sig.
B Std. Error Beta
(Constant) 12.018 3.857 3.116 .002
Walking Time 2.081 .582 .165 3.575 .000
Nationality -3.396 1.058 -.149 -3.208 .001
Pedestrian
Walkway 3.056 .991 .141 3.084 .002
Status 3.320 .913 .164 3.635 .000
Home based Trip
Purpose 2.887 1.113 .124 2.593 .010
Gender -2.569 .964 -.125 -2.666 .008
Dependent Variable: Willingness to walk based on current condition & considering time
Table 6: Multiple regression analysis of willingness to walk based on future conditions & considering distance
Model
Unstandardized Coefficients
Standardized
Coefficients t Sig.
B Std. Error Beta
(Constant) 300.655 91.497 3.286 .001
Walking Distance 73.035 12.544 .269 5.822 .000
Nationality -134.832 36.425 -.172 -3.702 .000
Pedestrian
Walkway 113.706 34.206 .152 3.324 .001
Home based Trip
Purpose 151.284 38.865 .188 3.893 .000
Gender -76.769 33.322 -.108 -2.304 .022
Dependent Variable: Willingness to walk based on future conditions, & considering distance
Table 7 shows factors affecting respondents’ ‘willingness to walk’, based on future conditions and considering time. Results show that respondents who currently walk greater distances and have longer travel times, would be willing to walk further still, and adjust to even longer travel times, if improvements to infrastructure were made.
Table 7: Multiple regression analysis of willingness to walk based on future conditions & considering time
Model
Unstandardized Coefficients
Standardized
Coefficients t Sig.
B Std. Error Beta
(Constant) 12.867 3.980 3.233 .001
Walking Time 2.845 .668 .202 4.257 .000
Pedestrian
Walkway 4.165 1.136 .171 3.666 .000
Nationality -3.208 1.193 -.126 -2.688 .007
Home based Trip
Purpose 3.382 1.276 .130 2.652 .008
Gender -2.511 1.100 -.109 -2.282 .023
DISCUSSION
Collated data show respondents will walk an average distance of 600m to access bus services, with the average time travelled being around 20 minutes. The farthest distance walked by respondents to access bus services was 200m to 400m, where bus stops in areas where respondents live and work are on average only 100m to 500m apart.
Most respondents reported their nearest bus stop being between 10 to 20 minutes away. Respondents were willing to walk a minimum distance of 50m and a maximum distance of 2,000m. Respondents reported their preferred travel times as a minimum of 3 minutes, a maximum of 90 minutes, and an average time of 13 minutes. Walking distance and walking times were based on actual bus stop locations. Significant factors affecting ‘willingness to walk’ to bus stops were comparable, whether or not improvements to infrastructure were made. Study results indicate that (gender, nationality, marital status, current walking distance, current walking time, safe and accessible pedestrian walkways, types of trip and trip purpose) all affect 'willingness to walk'. Factors that do not significantly affect ‘willingness to walk' are race, level of education, monthly income, vehicle ownership, license ownership, satisfaction level, frequency of bus use and distance from home to bus stop.
CONCLUSION & RECOMMENDATIONS
ACKNOWLEDGEMENT
This study is sponsored by the Ministry of Higher Education, Malaysia through the financial support from TRGS Grant Scheme (203/PAWAM/67610002)
REFERENCES
Brons, M., Givoni, M., & Rietveld, P. (2009). Access to railway stations and its potential in increasing rail use. Transportation Research Part A: Policy and Practice, 43(2), 136-149.
Burke, M., & Brown, A. L. (2007). Distances people walk for transport. Road & Transport Research: A Journal of Australian and New Zealand Research and Practice, 16(3), 16-29.
Corpuz, G., Hay, A., & Merom, D. (2005, September). Walking for transport and health: Trends in Sydney in the last decade. In 28th Australasian Transport Research Forum, Sydney, Australia.
Daniels, R., & Mulley, C. (2013). Explaining walking distance to public transport: The dominance of public transport supply. Journal of Transport and Land Use, 6(2), 5-20.
Efthymiou, D., & Antoniou, C. (2017). Understanding the effects of economic crisis on public transport users’ satisfaction and demand. Transport Policy, 53, 89-97. Freeland, A. L., Banerjee, S. N., Dannenberg, A. L., & Wendel, A. M. (2013). Walking
associated with public transit: moving toward increased physical activity in the United States. American Journal of Public Health, 103(3), 536-542.
Google Maps (2017, April 28) Retrieved from
https://www.google.com/maps/d/viewer?mid=
1ulYWzcNA05y5y6U-z1G5skv17Io&hl=en&ll=.5367143686190816%2C100.311692&z=13
Lai, W. T., & Chen, C. F. (2011). Behavioral intentions of public transit passengers - The roles of service quality, perceived value, satisfaction and involvement. Transport Policy, 18(2), 318-325.
Mitchell, C., & Wee, J. (2010, June). Improving Accessibility in Penang State, Malaysia. In International Conference on Mobility and Transport for Elderly and Disabled Persons (TRANSED). June 1-4, 2010, Hong Kong.
Owen, N., Humpel, N., Leslie, E., Bauman, A., & Sallis, J. F. (2004). Understanding environmental influences on walking: review and research agenda. American Journal of Preventive Medicine, 27(1), 67-76.
Pejabat Setiausaha Kerajaan Negeri Pulau Pinang (2013). The Recommended Penang
Transport Master Plan. Pulau Pinang. Retrieved from
http://pgmasterplan.penang.gov.my