Lucrări ştiinŃifice Zootehnie şi Biotehnologii, vol. 41 (1) (2008), Timişoara
RISK ANALYSIS IN MEAT PRODUCING
ANALIZA RISCULUI IN PRODUCEREA LAPTELUI
PIRVUTOIU I.*, POPESCU AGATHA**, GRIGORAS M.A.***
*Hyperion University Bucharest, Romania
**University of Agricultural Sciences and Veterinary Medicine, Bucharest, Romania *** University of Agricultural Sciences and Veterinary Medicine, Cluj Napoca , Romania
This paper aimed to evaluate Risk bankruptcy using “Score Method” based on Canon and Holder’s Model. The data were collected from the Balance Sheet and Profit and Loss Account for the period 2005-2007, recorded by a Dairy Farm .The study has put in evidence the bad financial situation of the company a reason to face a high risk bankruptcy in the all the three years. The high values of Z score function recorded every year reflects that there is no room for a financial recover, as long as the risk coefficient is higher than 80 %. Such a risk analysis would have to be made a few years ago in order to be useful for identifying in time the factors with a negative influence on the financial statement and to take the corresponding measures for avoiding such a bankruptcy. For Dairy commercial farms, such an analysis is compulsory at present taking into account the risky business environment.
Key words: risk bankruptcy , Canon and Holder’s Model, milk producing
Introduction
Materials and Methods
In order to set up this paper, the data collected from Balance Sheet and Profit and Loss Account of a Dairy Farm for the period 2005-2007 were collected and processed according to “Score Method”. Its purpose is to predict models for bankruptcy evaluation based on statistical techniques of discriminatory analysis. As a result Z score is obtained using the following linear function:
Z = a1x1 + a2x2 + a3x3 + ……. + anxn , where:
“ x “ represents the involved ratios and “a “ the balancing coefficient for each ratio. In the economic theory, among the well known models based on Score Method, there are, Altman’s Model, Canon and Holder’s Model, Loeb and Partier’s Model, Bank of France’s Model. In this study, we used Canon and Holder ’s Model which is based on the following linear function :
Z = 16 X1 + 22 X2 – 87 X3 – 10 X4 + 24 X5 , where:
X1 = Partial Solvability Ratio = (Receivables + Availabilities) /(Short term Debts); X2 = Financial Stability Ratio = Owner’s Equity / Total Liabilities; X3 =
Financial Costs Level in Turnover = Financial Costs /Turnover; X4 = Personnel
Costs /Value Added; X5 = Operating Gross Profit / Value Added . The
calculated Z score shows bankruptcy risk. In this purpose we compared the resulted value to the well known benchmarks :
• Favorable area for Z < 4
• Uncertainty area for 4 < Z < 9
• Unfavorable area for Z > 9.
Bankruptcy probability has been appreciated based on the following interval meanings and Z score values as shown in the Table below:
Z value Negative 0-1.5
1.5-4.0
4.0-8.5
8.5-9.5
10 13 1
6 Bankrupcty
Risk
> 80 75-80
70-75
50-70
35 30 25 1
5
Results and Discussions
Comments on the evolution of the basic data.
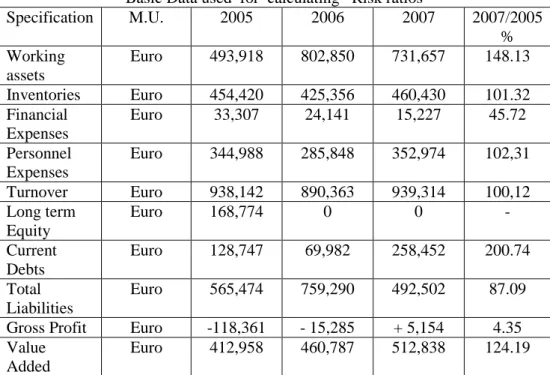
exactly, from Euro 254,419 in the year 2005 to Euro 460,430 in the year 2007. The financial costs decreased by 54.28 % from Euro 33,306 in 2005 to Euro 15,227 in 2007. The personnel costs increased by 2.31% from Euro 344,988 in 2005 to Euro 352,974 in the year 2007. The firm turnover remained approximately at the same level from a year to another. In the year 2007, it registered Euro 939,314, being by 0.12% higher than in the year 2005. The long term equity counted Euro 186,774 just in the year 2005, but in the following years, the company didn’t have any other loans. The current debts increased by 2 times in the analyzed period, reaching Euro 258,452 in the year 2007. The total liabilities decreased by 13%, from Euro 565,474 in 2005 to Euro 492,502 in 2007. Gross profit recorded negative values in the first two years as follows: -Euro 118,361 in the year 2005 and – Euro 15,285 in the year 2006, but a positive one in the year 2007: Euro 5,153. The value added increased by 24.19 %, from Euro 412,958 in 2005 to Euro 512,837 in the year 2007 ( Table 1 ).
Table 1 Basic Data used for calculating Risk ratios
Specification M.U. 2005 2006 2007 2007/2005
% Working
assets
Euro 493,918 802,850 731,657 148.13
Inventories Euro 454,420 425,356 460,430 101.32
Financial Expenses
Euro 33,307 24,141 15,227 45.72
Personnel Expenses
Euro 344,988 285,848 352,974 102,31
Turnover Euro 938,142 890,363 939,314 100,12
Long term Equity
Euro 168,774 0 0 -
Current Debts
Euro 128,747 69,982 258,452 200.74
Total Liabilities
Euro 565,474 759,290 492,502 87.09
Gross Profit Euro -118,361 - 15,285 + 5,154 4.35
Value Added
Euro 412,958 460,787 512,838 124.19
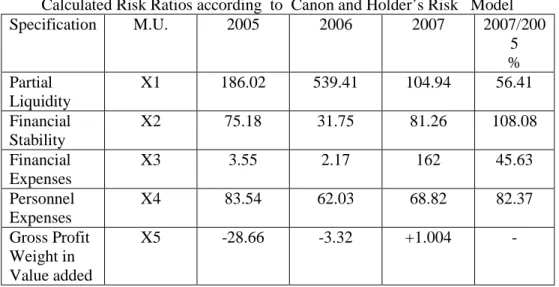
Comments on Risk Ratios evolution .
The Partial Liquidity decreased by 43.59% from 186.02 % in the year 2005 to 104.94 % in the year 2007. This was due to the ratio between working assets and inventory on one side and current debts on the other side. The rhythm of current debts increase was higher compared to working assets increasing rhythm.
2003, Also, the total liabilities decreased had also a good influence on the level of this indicator.
The financial expense share in Turnover decreased by 54.37 % from 3.55% in 2005 to 1.62% in the year 2007. This was due to the reduced financial expense from a year to another, so that in 2007, their level was twice lower than in the year 2005.
The personnel costs diminished by 17.63%, from 83.54 % in 2005 to 68.82% in the year 2007, because the value added increased in a higher rhythm in comparison with personnel costs, which is in fact a positive aspect.
The share of Gross Profit in value added recorded negative values in the first two years- 28.66% in the year 2005 and – 3,32% in the year 2006, but in the year 2007, it registered the value 1.004 %.
Table 2 Calculated Risk Ratios according to Canon and Holder’s Risk Model
Specification M.U. 2005 2006 2007 2007/200
5 % Partial
Liquidity
X1 186.02 539.41 104.94 56.41
Financial Stability
X2 75.18 31.75 81.26 108.08
Financial Expenses
X3 3.55 2.17 162 45.63
Personnel Expenses
X4 83.54 62.03 68.82 82.37
Gross Profit Weight in Value added
X5 -28.66 -3.32 +1.004 -
Using the X1-X5 values in the score function formula for the studied years, Z Score Value was determined and presented in Table 3.
Table 3 Value of Z Score Function
Function Item 2005 2006 2007
16 X1 2,976 8,630.56 1,679.04
22 X2 1,653.96 698.50 1,787.72
-87 X3 -308.85 -188.79 -140.94
-10 X -835.40 -620.30 -688.20
24 X5 -687.87 -79.68 24.00
Z 2,798.19 8,440.29 2,661.62
the lack of payment capacity and a very low profitability rate, practically at the lowest level. The variability of risk bankruptcy from a year to another reflects a lack of financial stability .
Table 4 Risk Bankruptcy interpretation
Specification 2005 2006 2007
Z Value 2,798.19 8,440.29 2,661.62
Risk Bankruptcy
Very high Very high Very high
Conclusions
1. The study based on Conan and Holder Model shows that the Dairy Company recorded a bad financial situation and it was facing a high risk bankruptcy in all the the years . .
2. The high values of Z score function recorded every year reflects that there is no room for a financial recover, as long as the risk coefficient is higher than 80 %.
3. Such a risk analysis would have to be made a few years ago in order to be useful for identifying in time the factors with a negative influence on the financial statement and to take the corresponding measures for avoiding such a bankruptcy.
4. For Dairy commercial farms, such an analysis is compulsory at present taking into account the risky business environment .
Bibliography
1. Bodie , Z., Merton , R.C. (2000) – Finance , Prentice Hall, Inc.
2.Bolten , S.E., Conn, R.I. (1981) – Essentials of Managerial Finance, Boston, Mass: Houghton Miffin Co, Chapter 10.
3.Brogham, E.F., Houston, J.F. ( 1999) – Fundamentals of Financial
Management, Concise , 2nd Edition, The Dryden Press
4.Hsu , Christine (2005) – Using the Dow Jones Interactive to perform financial ratio analysis , College of Business, California State University
5.Leiritz, A. (1990) – La pratique de la gestion finaciere , Paris
6.Niculescu, M. – (1993) – Economic and Financial Analysis , Bucharest 7.Paraschivescu , D.M., Pavaloaia , W .- (1994 )- Accounting anf Financial Analysis Models . Neuron Press House, Focsani
9.Pirvutoiu I., Popescu Agatha (2007) - Risk Analysis and its role in the prevention of commercial companies bankruptcy , The 12th Session of Scientific Papers of Teaching Staff with international participation, Romanian American University, May 18-19, 2007, Vol.2, ( p.432-435).
10. Pirvutoiu I., Popescu Agatha ( 2007 ) - Study concerning Risk evaluation in Combined Fodder Industry , International Scientific Symposium “Performance and Competitiveness in Animal Production”, UASVM Iasi, May 4-5 2007, Scientific Papers , Zootehnie Series, Vol.50, (p. 678-680)
11. Popescu Agatha (2007)– Financial Analysis, Dominor Publishing House, Bucharest, p.141-142, p.224-228.
12.Scott , D.F., Martin, J.D., Petty, J.W., Keown , A. ( 1999) – Basic
Financial Management, 8th Edition, Prentice Hall, Inc.