International Journal of Research in Engineering & Applied Sciences
An Investigation of Organizational Cooperation Based on Spatial Data Sharing and
Interoperability
Fatih TAKTAK1,
Asst. Prof. Dr.
Usak University, Faculty of Engineering, Department of Geomatic Engineering, Usak, Turkey.
Hulya DEMIR2,
Prof. Dr.
Yildiz Technical University, Faculty of Civil Engineering Department of Geomatic Engineering, Istanbul, Turkey.
Abstract
Collection, processing, storage of information and communications network that provides transmission from place to place through networks is important. A functional and physical communication network among the public institutions, the local governments, the private sector and all sectors doing business with Spatial Data is available. Communicative compatibility that operative according to a certain hierarchy is extremely an important dynamic in terms of the productivity and efficiency of the system. Collaboration between institutions or individuals is realized through informal networks that are not bound to designated rules. Taking advantage of the network analysis, Existing collaborations and communication networks can be formally presented. In this study, the relationship between public bodies, local governments, private sectors and all the sectors working with spatial data was examined socially, and an effort was made to reveal the collaboration system which the institutions built unawares and are running without adhering to any rules through "social networks" for the first time.
The questions in the face-to-face survey with the institutions that selected to show their cooperation within the network were tried to be revealed. By evaluating the obtained networks, at the national level, it were made suggestions that would be useful and could lead.
INTRODUCTION
The improving computer technologies have made it possible for official/unofficial communication or relation networks between individuals or, more generally, all kinds of actors to be materialized. To this end, several softwares have been made available for academic or specialist communities. It thus has paved the way for building a social network model desired for many applications and benefiting from the properties and findings obtained. Concept of social network was first used by Ferdinand Tönnies and Emile Durkheim in 1800s, and it provided the basis for today's social network analysis (SNA). In 1900s, J. Barnes conducted a more systematical study on a certain group, and therefore, is considered to be the founder of social network analysis. Barnes defined the social network in 1950s a structure of connections. Thanks to Barnes, academic or specialist communities started to focus on the subject more and more, and many researches have been performed for the use of the computer technologies developed recently and limitless applications (Freeman 2004, Scott and Carrington 2011, Chan and Liebowitz 2006).
National spatial data infrastructures are a system that leads up to interoperability, enabling either horizontal or vertical effective data sharing, immediate access to services and use required by related persons from all public bodies, local governments, private sector and all sectors which work with spatial data. It is a comprehensive application which is built so that institutions can access the data they require fast, economically and productively to operate. Technological applications based on the spatial data have been increasing day by day, and so the number of users accordingly (Craglia and Campagna 2010, Bregt et al. 2008).
It is necessary to determine the functional, physical and hierarchic boundaries of the institutions and ensure an efficient cooperation between them for an interinstitutional data sharing today. The system to build the invisible interinstitutional cooperation is social network. SNA which can be also defined as digitalizing and making the relationships between the actors scientific is used to turn the intra and interorganizational relationship networks into digital data. Since the shape and properties of the network obtained based on the digitalized data will present the productivity of the institutional or interinstitutional communication network, it shows how to take necessary precautions or provide support on the topics analyzed (Chan 2001, Crompvoets et al. 2008, Crompvoets et al. 2010; Peng et al. 2016).
which will be able to present the interoperability of the institutions unawares and without adhering to any rules through the social, not technical, examination of the interinstitutional relationship network. The social network analysis was examined and the organizational structure between the institutions was revealed.
SOCIAL NETWORK ANALYSIS
SNA is defined as a method that investigates the interpersonal social relationship structures, an analytical framework for examining the relationships between social beings and researches of mapping and measuring the relationships between social actors (Adkins, 2008; Kale, 2007; Zhou, 2008). SNA is based on the assumption of the importance of the relationship between the interactional groups. Social beings defined as actors are shown as nodes on the level. Social relationships affect how people feel as a result of their experiences, in other words, their subjective spaces and to which information and resources they can access with these experiences (Hawe and Ghali, 2008; Budhiraja and Khatri, 2013). The benefit of the SNA is that it provides the opportunity to define the relationships between people and then examine their ways of being connected to each other (Haythornthwaite, 2005; Firestone et al., 2012; Firestone et al., 2011).
SNA is a method often utilized to reveal the social dynamics in sociological and organizational studies. It is also used to determine the information sharing patterns in education and online learning communities and understand the social capital accumulation in the network. Since information is an important factor in the generation of wealth, economic actors want to direct the information to themselves (Harrer, 2006; Niles-Yokum, 2015). This is one of the reasons that make SNA important. The question "In which circumstances can the people who are closer to the information use this as an advantage?" can be answered with SNA (Gürsakal, 2009; Sorenson, 2006; Zhao, 2013).
SNA which is based on the assumption of the importance of the relationship between the interactional groups is the analysis of all kinds of relationship between institutions, people or groups shown as nodes on the line, in general, the actors who are in relationship with each other. The aim of SNA is to examine the structure of a social network, make deductions about an institution or group and produce information (Demir and Taktak, 2011; Cook et al., 2013).
understandable. The position, connections and weak or strong sides of an actor in the social network can be revealed by determining the measures such as density and centrality of a network (Gürsakal, 2009). Various measures can be obtained by performing the SNA at different levels. When an analysis is conducted for the network generally, different measures are determined in the examination of the subgroups in the network and the evaluation of each actor in the network (Hanneman and Riddle, 2005; Gencer et al., 2009). Even though there are different denominations, each being is called "node"; each connection/relationship between the beings is called "connection" in the network basically. Since the connections between two nodes in visualization applications are shown with a line that connects the nodes to each other, they are generally called "edge" (Chakrabarti, 2003).
Certain measuring methods are utilized in the social network analysis to explain the position of the actors within the network, identify the relationship between the actors and defined the network as a whole (Jablin and Putnam, 2001).
a- Social network mechanism measures used for actors and network mechanisms
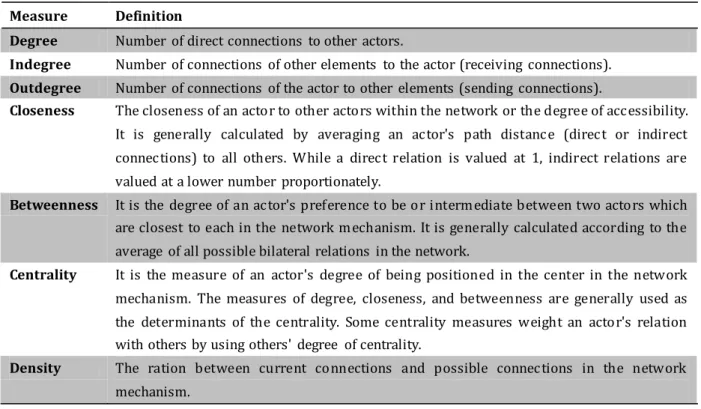
By using degree, indegree, outdegree, range, closeness, betweenness, centrality, prestige, roles of the actors in the network mechanism, intensity, centralization and Dimensional Network science, very large networks can be modeled, the resistance and reliability of the networks can be analyzed, mathematical algorithms needed for all these experiments and measures can be developed and the relationship between the architecture and functions of the network can be understand more comprehensively (Gürsakal, 2009; Chakrabarti, 2003).
Table 1: Social network mechanism measures used for actors
Measure Definition
Degree Number of direct connections to other actors.
Indegree Number of connections of other elements to the actor (receiving connections). Outdegree Number of connections of the actor to other elements (sending connections).
Closeness The closeness of an actor to other actors within the network or the degree of accessibility. It is generally calculated by averaging an actor's path distance (direct or indirect connections) to all others. While a direct relation is valued at 1, indirect relations are valued at a lower number proportionately.
Betweenness It is the degree of an actor's preference to be or intermediate between two actors which are closest to each in the network mechanism. It is generally calculated according to the average of all possible bilateral relations in the network.
Centrality It is the measure of an actor's degree of being positioned in the center in the network mechanism. The measures of degree, closeness, and betweenness are generally used as the determinants of the centrality. Some centrality measures weight an actor's relation with others by using others' degree of centrality.
Density The ration between current connections and possible connections in the network mechanism.
INSTITUTIONAL COMMUNICATION
It is possible for institutions to realize their common objective only when they communicate with each other; and only then they can continue their operation. Communication is an element that can exist between individuals and between individuals and groups including the inner communication of the person and that coordinates the organizational structure (Eroğluer, 2011; Belasen, 2008).
APPLICATION
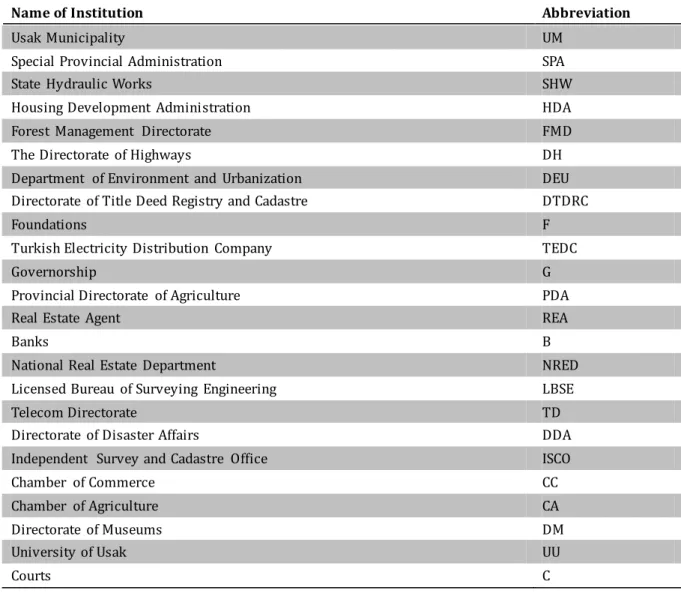
Within the scope of the institutions in Usak province shown in Table 2, the cooperation of the institutions which produce or use spatial data was investigated with SNA method. Statistical and visual evaluations were made with the software NetMiner 4 which is a SNA software and preferred in scientific publications. In total, the survey is conducted with 24 pcs state institutions and private sector.
Table 2: Institutions surveyed in Usak province
Name of Institution Abbreviation
Usak Municipality UM
Special Provincial Administration SPA
State Hydraulic Works SHW
Housing Development Administration HDA
Forest Management Directorate FMD
The Directorate of Highways DH
Department of Environment and Urbanization DEU Directorate of Title Deed Registry and Cadastre DTDRC
Foundations F
Turkish Electricity Distribution Company TEDC
Governorship G
Provincial Directorate of Agriculture PDA
Real Estate Agent REA
Banks B
National Real Estate Department NRED
Licensed Bureau of Surveying Engineering LBSE
Telecom Directorate TD
Directorate of Disaster Affairs DDA
Independent Survey and Cadastre Office ISCO
Chamber of Commerce CC
Chamber of Agriculture CA
Directorate of Museums DM
University of Usak UU
Courts C
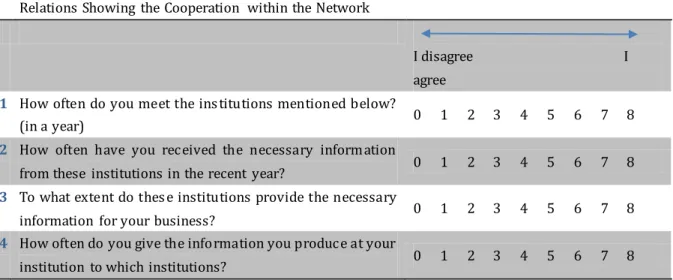
a- Relations showing the cooperation within the network
which are capable of presenting the intra-network cooperation were asked to related persons.
While preparing the survey questions, the book "hidden power of the social network" are utilized (Cross and Parker, 2004). The written book in this area; cooperation, sharing, solidarity and information about the decision-making processes are taken into account.
The four questions of The survey part forms that all the negotiations between other institutions of social life, in order to determine the information exchange and social cooperation was prepared under the main title " Relations Showing the Cooperation within the Network ". As the scale of the survey questions, the most appropriate "Likert scale" is used. As the number scales; predominantly representation of figure is considered to be from 0 to 8.
Table 3: Social network analysis survey questions
Relations Showing the Cooperation within the Network
I disagree I agree 1 How often do you meet the institutions mentioned below?
(in a year) 0 1 2 3 4 5 6 7 8 2 How often have you received the necessary information
from these institutions in the recent year? 0 1 2 3 4 5 6 7 8 3 To what extent do these institutions provide the necessary
information for your business? 0 1 2 3 4 5 6 7 8 4 How often do you give the information you produce at your
institution to which institutions? 0 1 2 3 4 5 6 7 8
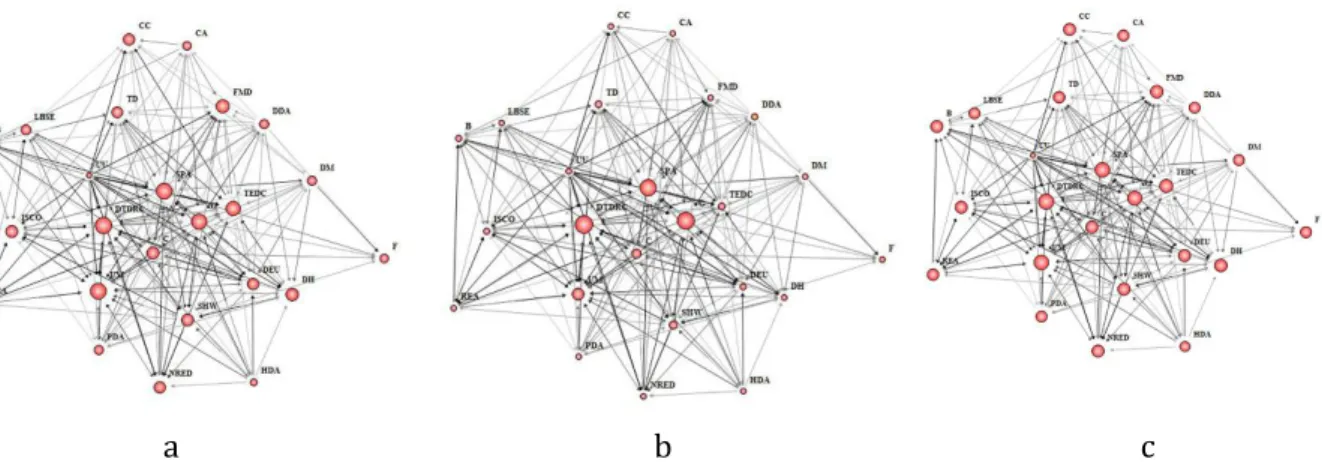
Survey Question 1: Each institution surveyed in Usak province was asked "How often do you
meet the institutions mentioned below?", and network and centrality charts were obtained with
the evaluation of the data obtained from the answers. The density of communication between/request of meeting with actors is shown in (Fig-1).
a b c
a) Degree network map and degree centrality chart
b) Betweenness network map and betweenness centrality chart c) Closeness network map and closeness centrality chart.
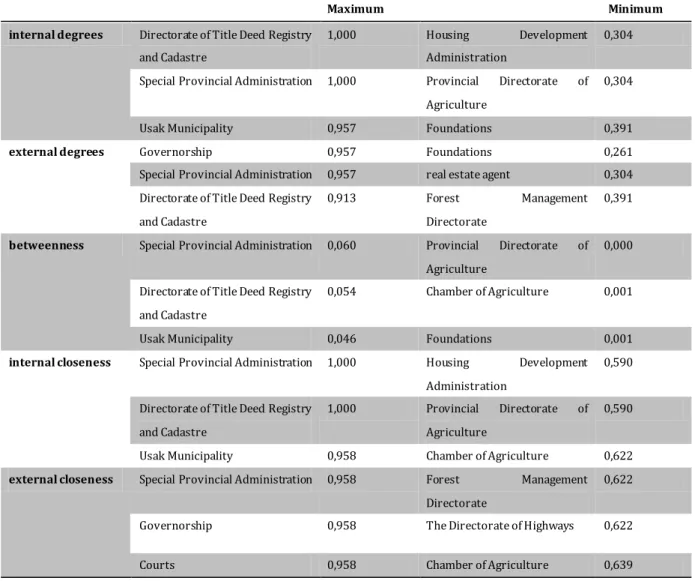
In Table 4 indegree, outdegree, in closeness, out closeness and betweenness values calculated according to the answers given to the first survey question by the public bodies, that is, actors are shown for three institutions each that have the highest and the lowest value. In this study, indegree centrality was examined and analyzed according to the sum of number of relation/meeting directly requested from a public body by other institutions and the fact how many different institutions this relation/meeting request came from. Similarly, outdegree centrality was calculated using matrixes built with the sum of number of relation/meeting directly requested from a public body by other institutions and the fact how many different institutions this relation/meeting request came from.
Table 4: "How often do you meet the institutions mentioned below?" question's maximum and minimum results of in/outdegree, betweenness, and in/out closeness values
Maximum Minimum
internal degrees Directorate of Title Deed Registry and Cadastre
1,000 Housing Development
Administration
0,304
Special Provincial Administration 1,000 Provincial Directorate of
Agriculture
0,304
Usak Municipality 0,957 Foundations 0,391
external degrees Governorship 0,957 Foundations 0,261
Special Provincial Administration 0,957 real estate agent 0,304
Directorate of Title Deed Registry and Cadastre
0,913 Forest Management
Directorate
0,391
betweenness Special Provincial Administration 0,060 Provincial Directorate of Agriculture
0,000
Directorate of Title Deed Registry and Cadastre
0,054 Chamber of Agriculture 0,001
Usak Municipality 0,046 Foundations 0,001
internal closeness Special Provincial Administration 1,000 Housing Development Administration
0,590
Directorate of Title Deed Registry and Cadastre
1,000 Provincial Directorate of
Agriculture
0,590
Usak Municipality 0,958 Chamber of Agriculture 0,622
external closeness Special Provincial Administration 0,958 Forest Management Directorate
0,622
Governorship 0,958 The Directorate of Highways 0,622
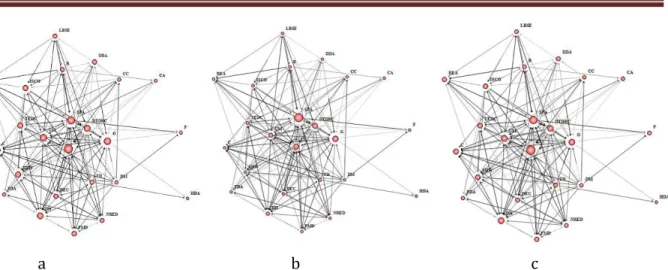
Survey Question 2: Each institution surveyed in Usak province was asked "How often have you
received the necessary information from these institutions in the recent year?", and network and
centrality charts were obtained with the evaluation of the data obtained from the answers. The general overview of actors and relations between them is shown in (Fig- 2).
a b c
Fig- 2: According to the answers given to the second questions, for the actors and the relations between them;
a) Degree network map and degree centrality chart
b) Betweenness network map and betweenness centrality chart c) Closeness network map and closeness centrality chart
In Table 5 indegree, outdegree, in closeness, out closeness and betweenness values calculated according to the answers given to the second survey question by the public bodies, that is, actors are shown for three institutions each that have the highest and the lowest value.
Table 5: "How often have you received the necessary information from these institutions in the
recent year?" question's maximum and minimum results of in/outdegree, betweenness, and
in/out closeness values
Maximum Minimum
internal degrees
Directorate of Title Deed Registry and Cadastre
0,870 Foundations 0,000
Usak Municipality 0,826 Chamber of Commerce 0,000 Special Provincial
Administration
0,826 National Real Estate Department
0,130
external degrees
Courts 0,913 Foundations 0,000
Governorship 0,913 Chamber of Commerce 0,000 Special Provincial
Administration
0,913 Forest Management Directorate
0,087
betweenness Directorate of Title Deed Registry and Cadastre
0,094 University of Usak 0,000
Special Provincial Administration
0,086 Forest Management Directorate
0,000
internal closeness
Directorate of Title Deed Registry and Cadastre.
0,872 University of Usak 0,000
Usak Municipality 0,834 Housing Development Administration
0,457
Special Provincial Administration
0,834 Chamber of Agriculture 0,533
external closeness
Courts 0,915 Chamber of Commerce 0,000
Governorship 0,915 Foundations 0,000
Special Provincial Administration
0,915 National Real Estate Department
0,501
Survey Question 3: Each institution surveyed in Usak province was asked "How often have you
received the necessary information from these institutions in the recent year?", and network and
centrality charts were obtained with the evaluation of the answers. The general overview of actors and relations between them is shown in (Fig- 3).
a b c
Fig- 3: According to the answers given to the third questions, for the actors and the relations between them;
a) Degree network map and degree centrality chart
b) Betweenness network map and betweenness centrality chart c) Closeness network map and closeness centrality chart
Table 6: "To what extent do these institutions provide the necessary information for your
business?" question's maximum and minimum results of in/outdegree, betweenness, and in/out
closeness values
Maximum Minimum
internal degrees
Special Provincial Administration
0,957 University of Usak 0,130
Usak Municipality 0,913 Housing Development Administration
0,130
Directorate of Title Deed Registry and Cadastre
0,913 Provincial Directorate of Agriculture
0,217
external degrees
Special Provincial Administration
0,957 National Real Estate Department
0,130
Courts 0,957 Foundations 0,261
Directorate of Title Deed Registry and Cadastre
0,870 real estate agent 0,261
betweenness Special Provincial Administration
0,131 Chamber of
Commerce
0,000
Directorate of Title Deed Registry and Cadastre
0,089 Chamber of
Agriculture
0,000
Governorship 0,078 National Real Estate Department
0,000
internal closeness
Special Provincial Administration
0,957 Housing Development Administration
0,468
Usak Municipality 0,915 University of Usak 0,513 Directorate of Title Deed
Registry and Cadastre
0,915 Provincial Directorate of Agriculture
0,540
external closeness
Special Provincial Administration
0,958 Chamber of
Commerce
0,000
Courts 0,958 National Real Estate Department
0,523
Governorship 0,920 real estate agent 0,561
Survey Question 4: Each institution surveyed in Usak province was asked "How often do you
give the information you produce at your institution to which institutions?", and network and
a b c
Fig- 4: According to the answers given to the fourth questions, for the actors and the relations between them;
a) Degree network map and degree centrality chart
b) Betweenness network map and betweenness centrality chart c) Closeness network map and closeness centrality chart
In Table 7 indegree, outdegree, in closeness, out closeness and betweenness values calculated according to the answers given to the second survey question by the public bodies, that is, actors are shown for three institutions each that have the highest and the lowest value.
Table 7: "How often do you give the information you produce at your institution to which
institutions?" question's maximum and minimum results of in/outdegree, betweenness, and
in/out closeness values
Maximum Minimum
internal degrees
University of Usak 0,783 Chamber of Agriculture
0,174
Special Provincial Administration
0,696 Foundations 0,174
Usak Municipality 0,609 Directorate of Museums
0,217
external degrees
Special Provincial Administration
0,957 Courts 0,000
Directorate of Title Deed Registry and Cadastre
0,957 Foundations 0,000
TEDAS 0,957 Housing Development Administration
0,000
betweenness Special Provincial Administration
0,186 Chamber of
Agriculture
0,000
internal closeness
University of Usak 0,791 Housing Development Administration
0,399
Special Provincial Administration
0,725 Chamber of
Commerce
0,470
The Directorate of Highways
0,621 Chamber of
Agriculture
0,470
external closeness
Special Provincial Administration
0,958 Housing Development Administration
0,000
Directorate of Title Deed Registry and Cadastre
0,958 Foundations 0,000
Governorship 0,958 Courts 0,000
The first evaluation was performed for the density measurements so that the complex structure of the network can be analyzed and the network can be understandable (Table 8). The density of the number of the links between the nodes of a network means that actors (institutions) know each other or there is more interaction. The maximum number of links that can form in the network in the SNA performed for twenty four institutions (n) in the thesis study is 552 (n*(n-1)). Calculations of "general density of the network according to the number of links" given in Table 8 shows what percentage of the connections which can be built has been realized potentially.
Table 8: Density evaluation concerning the networks
Relations Findings Number of
links
presented (1)
Network's general density according to the number of links (2) = (1)/552
Realization level Co op er at io n in th e ne tw or k
Institutions' frequency of meeting with each other
352 0.638 Upper
intermediate Institutions' frequency of receiving
information from each other
263 0.476 Intermediate
Institutions' competence or productivity of providing each other with the information they need
277 0.502 Intermediate
Institutions' frequency of providing each other with information
213 0.386 Lower
level even though institutions' frequency of meeting with each other is upper intermediate. The fact that "Realization level" found by considering the general density of the network according to the number of links shows that institutions of which the network was built within the scope of NPDI are not strongly linked to each other and they are almost alienated from each other.
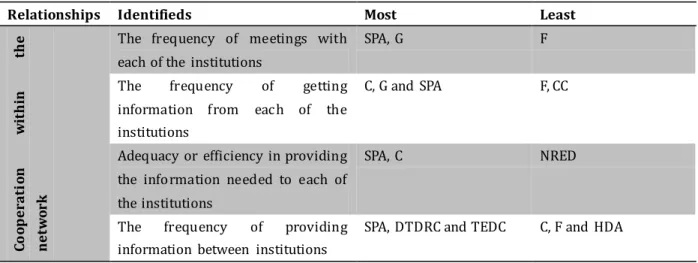
Table 9: Evaluation of indegree centrality of the networks
Relationships Identifieds Most Least
Co op era ti on w it h in th e n et w ork
The frequency of meetings with each of the institutions
DTDRC and SPA HDA and PDA
The frequency of getting information from each of the institutions
DTDRC F and CC
Adequacy or efficiency in providing the information needed to each of the institutions
SPA UU and HDA
The frequency of providing information between institutions
UU CA and F
Table 10: Evaluation of outdegree centrality of the networks
Relationships Identifieds Most Least
Co op era ti on w it h in th e n et w ork
The frequency of meetings with each of the institutions
SPA, G F
The frequency of getting information from each of the institutions
C, G and SPA F, CC
Adequacy or efficiency in providing the information needed to each of the institutions
SPA, C NRED
The frequency of providing information between institutions
SPA, DTDRC and TEDC C, F and HDA
Table 11: Evaluation of the betweenness values of the networks
Relationships Identifieds Most Least
Co op era ti on w it h in th e n et w ork
The frequency of meetings with each of the institutions
SPA PDA
The frequency of getting information from each of the institutions
DTDRC UU, CA and FMD
Adequacy or efficiency in providing the information needed to each of the institutions
SPA CC, CA and NRED
The frequency of providing information between institutions
SPA CA, REA and F
When the betweenness centrality in Table 11 is examined, institutions DTDRC and SPA come to the forefront in the relations showing the cooperation in the network on the basis of active institutions that may intermediate.
Table 12: Evaluation of in closeness centrality of the networks
Relationships Identifieds Most Least
Co op era ti on w it h in th e n et w ork
The frequency of meetings with each of the institutions
SPA, DTDRC HDA, PDA
The frequency of getting information from each of the institutions
DTDRC UU
Adequacy or efficiency in providing the information needed to each of the institutions
SPA HDA
The frequency of providing information between institutions
UU HDA
Table 13: Evaluation of out closeness centrality of the networks
Relationships Identifieds Most Least
Co op era ti on w it h in th e n et w ork
The frequency of meetings with each of the institutions
SPA, G and C FMD and DH
The frequency of getting information from each of the institutions
C, G and SPA CC and F
Adequacy or efficiency in providing the information needed to each of the institutions
SPA and c CC
The frequency of providing information between institutions
In the networks built, the results of in and out closeness values belonging to the institution(s) which can reach other institutions in the shortest way and has great ability to access information are shown in Table 12 and 13.
When the in closeness centrality in Table 12 is examined, institutions such as DTDRC and SPA; when the out closeness centrality in Table 13 is examined, institutions such as SPA, G and C come to the forefront in the relations showing the cooperation in the network on the basis of active institutions.
CONCLUSION
In this study, it was aimed that the differences of institutions that produce spatial data are revealed; therefore, the ongoing planning process for the future is contributed within the context of NPDI. In Usak province for the NPDI application, the relationship between public bodies, local governments, private sectors which produce spatial data and all the sectors working with spatial data was examined socially, and an effort was made to reveal the collaboration system which the institutions built unawares and are running without adhering to any rules through "social networks".
REFERENCE
[1] Adkins D. (2008). The Use of Social Network Analysis to Measure Knowledge Sharing in The New York State Project Management Community of Practice, ProQuest, New York State Universities, Newyork. http://sunzi.lib.hku.hk/ER/detail/hkul/4358515.
[2] Barnett G.A. (2011). Encyclopedia of Social Networks. Thousand Oaks, CA: Sage. University of California, Davis, USA, University of California, Davis.
[3] Belasen A.T. (2008). The theory and practice of corporate communication: A competing values perspective. State University of New York - Empire State College, Sage Publications, CA.
[4] Bregt A.K., Grus L., Crompvoets J., Castelein W.T. and Meerkerk J. (2008). Changing demands for Spatial Data Infrastructure assessment: Experience from The Netherlands, A multi-view framework to assess spatial data infrastructures, Digital Print Centre, The University of Melbourne, Australia, Melbourne, pp. 357–370.
[5] Budhiraja I., Khatri A. (2013). A Study on Motıves Behınd The Use of Socıal Networkıng Sıtes, IJRESS, Volume 3, Issue 2, ISSN: 2249-7382.
http://euroasiapub.org/wp-content/uploads/2016/09/2-1-18.pdf [6] Chakrabarti S. (2003). Social Network Analysis. Mining the Web, 203-254.
[7] Chan K. and Liebowitz J. (2006). The synergy of social network analysis and knowledge mapping: a case study. International Journal of Management and Decision Making, 7(1), (pp. 19-35). DOI:10.1.1.477.584&rep=rep1&type=pdf
[8] Chan T.O., Feeney M., Rajabifart A. and Williamson I.P. (2001). The dynamic nature of spatial data infrastructure: A method of descriptive classification, Geomatica, 55 (1), (pp. 65– 72). DOI:10.1.1.15.2286&rep=rep1&type=pdf
[9] Cook J., Norbert P. and Bachmair B. (2013). Using social network sites and mobile technology to scaffold equity of access to cultural resources. In: G. Trentin and M. Repetto, eds. Using Network and Mobile Technology to Bridge Formal and Informal Learning, (pp. 31-56).
[10] Craglia M. and Campagna M. (2010). Advanced regional SDI in Europe: “Comparative cost-benefit evaluation and impact assessment perspectives. International Journal of Spatial Data Infrastructures Research, 5, (pp.145-167).
http://ijsdir.jrc.ec.europa.eu/index.php/ijsdir/article/viewFile/166/282
[11] Crompvoets J., Man E.D. and Macharis C. (2010). Value of spatial data: networked performance beyond economic rhetoric, International Journal of Spatial Data Infrastructure Research, 5, (pp. 96–119). DOI:10.1.1.502.1870&rep=rep1&type=pdf
[13] Cross R. and Parker A. (2004). The Hidden Power of Social Networks, Harvard Business School Press.
[14] Demir H. and Taktak F. (2011). Konumsal Veri Üzerine Sosyal Ağ Analizi (SAA): Afyonkarahisar Örneği. Harita Teknolojileri Elektronik Dergisi, 3 (1), (pp. 7-16).
[15] Eroğluer K. (2011). Örgütsel İletişim ile İş Tatmini Unsurları Arasındaki İlişkiler: Kuramsal Bir İnceleme. Ege Akademik Bakış Dergisi, 11 (1), (pp. 121-136).
[16] Firestone S.M., Christley R.M., Ward M.P. and Dhand N. K. (2011). Adding the spatial dimension to the social network analysis of an epidemic. C. Fourichon, D.U. Pfeiffer Eds. Society for veterinary Epidemology and Preventive Medicine, Annual Conference Proceedings, Leipzig, Germany, (pp. 171–181).
DOI:http://dx.doi.org/10.1016/j.prevetmed.2012.01.020
[17] Firestone S.M., Christley R.M., Ward M.P. and Dhand N.K. (2012).
Adding the spatial dimension to the social network analysis of an epidemic: Investigation of the 2007 outbreak of equine influenza in Australia. Original Research Article Preventive Veterinary Medicine, 106(2), (pp.123-135).
DOI:http://dx.doi.org/10.1016/j.prevetmed.2012.01.020
[18] Freeman L. (2004). The Development of Social Network Analysis: A Study in the Sociology of Science, Vancouver, CA: Empirical Press, Canada.
[19] Gencer M., Gunduz C. and Tunalıoğlu V.S. (2009). CL-SNA: Social Network Analysis with Lisp, SPLASH Systems. Programming, and Applications: Proceedings of the 2007 International Lisp Conference, 17, ACM New York, USA. DOI:10.1145/1622123.1622143
[20] Gürsakal N. (2009). Sosyal Ağ Analizi. Dora Basım Dağıtım Ltd., Bursa.
[21] Hanneman R.A. and Riddle M. (2005). Introduction to Social Network Methods. Riverside, CA: University of California, Riverside. http://faculty.ucr.edu/~hanneman/nettext/
[22] Harrer A., Zeini S. and Pinkwart N. (2006). Evaluation of Communication in Websupported Learning Communities—an Analysis with Triangulation Research Design, International Journal of Web Based Communities, 2 (4), (pp. 428-446). DOI:
http://dx.doi.org/10.1504/IJWBC.2006.011768
[23] Hawe P. and Ghali L. (2008). Use of Social Network Analysis To Map The Social Relationships Of Staff And Teachers At School. Health Education Research, 23 (1): 62-69.
DOI:10.1093/her/cyl162
[24] Haythornthwaite C. (2005). Social Network Methods and Measuresfor Examining E-learning
[online]. Available from:
ttp://citeseerx.ist.psu.edu/viewdoc/download?doi=10.1.1.135.6993&rep=rep1&type=pdf , [Accessed 20 May 2013].
[26] Kale U. (2007). Online Communicatıon Patterns in a Teacher Professional Development Program. Thesis (PhD). Indiana Ünv. https://books.google.nl/books?id=_cfiQTFXokUC
[27] Kalla H.K. (2005). Integrated Internal Communications: A Multidisciplinary Perspective. Corporate Communications: An International Journal, 10 (4), (pp. 302-314). DOI: http://dx.doi.org/10.1108/13563280510630106
[28] Niles Yokum K., and Wagner D. L. (2015). The Aging Networks, 8th Edition : A Guide to Programs and Services. New York, NY: Springer Publishing Company.
[29] Peng Q., Wang Kelvin C., P., Liu X., and Chen B. (2016). 98.2.1 SNA (Social Network Analysis). In , ICTE 2015 - Proceedings of the Fifth International Conference on Transportation Engineering, September 26-27, 2015, Dalian, China American Society of Civil Engineers (ASCE).
[30] Scott, J. (2012). Social Network Analysis. London: Sage.
[31] Scott J. and Carrington P.J., (2011). The SAGE Handbook of Social Network Analysis, SAGE. [32] Sorenson O. (2006). Editorial Objectives: Organization and Social Network. Management
Science, Informs, 52 (10), 4. DOI:http://dx.doi.org/10.1287/mnsc.1060.0645 [33] Tutar H. (2009). Örgütsel İletişim. Seçkin Yayıncılık, Ankara.
[34] Van Riel C.B.M. and Fombrun C.J. (2007). Essentials of corporate communication: Implementing practices for effective reputation management, Routledge, New York.
[35] Zhao Y. (2013). Social Network Analysis, R and Data Mining, (p. 123-136).
ftp://cran.r-project.org/pub/R/doc/contrib/Zhao_R_and_data_mining.pdf
[36] Zhou D. (2008). Mining Social Documents and Networks. Thesis (PhD). Computer Science and Engineering, The Graduate School The Pennsylvania State Ünv.
Biography of Authors
Asst. Prof. Fatih TAKTAK, born in 1978. He graduated in 1996 as Dipl.-Ing. in Geodesy and Photogrammetry Engineering at Selcuk University. He obtained his MsC degree in 2005 at Kocatepe University. He obtained his Ph.D. degree in 2013 at Yildiz Technical University. He is since 2014, Asst. Prof. of Engineering Faculty, Usak University. He is currentley working on Land Management and urban transformation.