International Journal of Research in Engineering & Applied Sciences
Email:- [email protected], http://www.euroasiapub.org
112
Effect of Sample Size on Correlation and Regression Coefficients
Swati Gupta1 Research Scholar, Department of Education, Aligarh Muslim University, India
Dr. Mamun Ali Naji Qasem2 Faculty of Education, IBB University, Yemen
ABSTRACT:
The study was conducted to know the effect of sample size (by doubling the data) on correlation coefficient, determination coefficient (R2), F value and Beta coefficient of multipleregression. The statistical comparative method was used in the study. The sample consisted of 100 students. Three scales i.e. ‘home environment’, ‘language creativity’ and ‘thinking strategy’ were used in the present study. The findings of the study revealed that: (1) the sample size is not affecting the value of correlation coefficient but it affects the level of significance for correlation coefficient. (2) There is no effect of sample size on determination coefficient R2) but the level of F value became high if
the sample size is bigger. (3) There is no effect of sample size on Beta coefficient for independent variables in multiple regression. (4) The big sample size yields small level of significance. In other words, the level of errors became less if the sample size is bigger.
KEYWORDS: Sample Size,Correlation Coefficient and Regression Coefficient
INTRODUCTION
The use of statistics in educational research has grown from analyzing the data by using percentages, means and standard deviations to more sophisticated techniques such as regression analysis and structural equation of modelling etc. These statistical techniques have helped researchers to uncover the significant relationships among the various variables relating to human potentials and behaviours. The use of statistical techniques has also been facilitated with the advent of technology and software, which have made the process of analysis easy. Previously, calculators were the norms of the day but today, software like SPSS, SAS and AMOS are used in research very conveniently and all of them are user-friendly (Al-Sayd, 2005).
One of the most common measures of association is the coefficient of correlation. It measures the relationship between two or more variables, such as linear relationship between two sets of measurements. The correlation between two variables can be classified as positive or negative correlation. It is positive if the increase or decrease in one variable is related to the increase or decrease in the other variable. Also, it can be negative when the increase in one variable corresponds with the decrease in the other variable or the decrease in one variable corresponds with the increase in the other variable. Moreover, there might be a third kind of correlation i.e. zero correlation. If, no relationship exists between the two sets of measures of variables, it is called zero correlation (Singh, 2006).
International Journal of Research in Engineering & Applied Sciences
Email:- [email protected], http://www.euroasiapub.org
113
the data. For temporal data, the Xi values represent time and the Yi values represent theobservations. An estimate of the magnitude of trend can be obtained by performing a regression of the data versus time and using the slope of the regression line as the measure of the strength of the trend (Feild, 2009).
In contrast to simple linear regression where scores on one predictor variable are employed to predict the scores of a criterion variable, in multiple regression analysis, a researcher attempts to increase the accuracy of prediction through the use of multiple predictor variables. In multiple regression, a researcher can predict ‘Y’ score by using several criteria. For example, the equation for
two predictor variables would be as {Y=a+b1X1 +b2X} (Beins and McCarthy, 2012). Regression
procedures are easy to apply as all statistical software packages and spreadsheet programs
calculate the slope and intercept of the best fitting line, as well as correlation coefficient (r).
However, regression entails several limitations and assumptions, which are concerned to normality, linearity, homoscedasticity of the data and independence of the residuals (Sheskin, 2000). So the present study is an attempt to study the effect of sample size on correlation and regression coefficients.
RESEARCH OBJECTIVES
1. To know the effect of sample size on correlation coefficient
2. To know the effect of sample size on determination coefficient (R2) and F value of multiple
regression
3. To know the effect of sample size on Beta coefficient of multiple regression
RESEARCH HYPOTHESES
1. There is no effect of sample size on correlation coefficient.
2. There is no effect of sample size on determination coefficient (R2) and F value of multiple
regression.
3. There is no effect of sample size on Beta coefficient of multiple regression.
RESEARCH METHOD AND PROCEDURE
To achieve the above mentioned objectives, the researchers used statistical comparative method. The researchers followed the following steps:
First: Three standardized scales (Home Environment, Language Creativity and Thinking Strategy) have been applied on 100 students in Faculty of Education in Um Al-Qura University, KSA and Aligarh Muslim University.
Second: The data has been repeated 1 time to make the sample size 200 then it has been repeated 3 times to make sample size 400. Finally, the data has been repeated 7 times to make the sample size = 800.
Third: The data has been analyzed by applying Pearson correlation coefficient and multiple regression through SPSS program.
International Journal of Research in Engineering & Applied Sciences
Email:- [email protected], http://www.euroasiapub.org
114
RESEARCH SAMPLE
Three scales have been applied on 100 students as core sample then the data has been repeated in SPSS program. The sample of research has been selected by using stratified random sampling technique, because the stratified random sampling is an appropriate sampling technique to represent all the stratas of the population.
RESEARCH TOOL USED
Three standardized scales (Home Environment, Language Creativity and Thinking Strategy) have been administered on the selected sample to get original data.
STATISTICAL METHODS
- Pearson correlation coefficient - Multiple Regression
ANALYSIS AND INTERPRETATION
In order to achieve the objectives formulated in the present study, the data has been analyzed and interpreted, which has been presented through the following tables and figures:
First objective: To know the effect of sample size on correlation coefficient
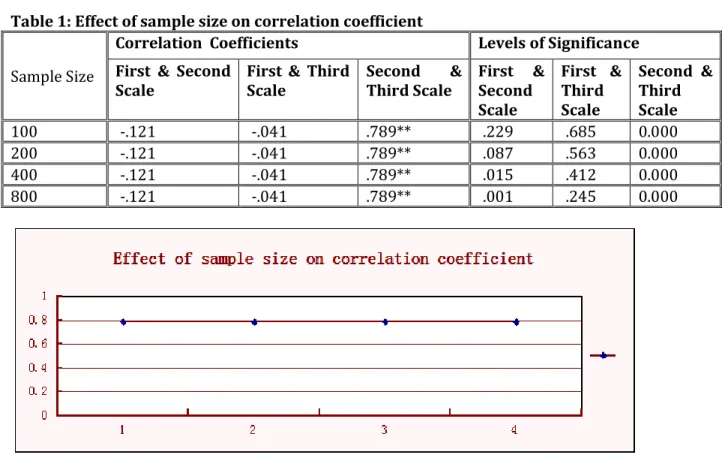
Table 1: Effect of sample size on correlation coefficient
Sample Size
Correlation Coefficients Levels of Significance
First & Second Scale
First & Third Scale
Second & Third Scale
First & Second Scale
First & Third Scale
Second & Third Scale
100 -.121 -.041 .789** .229 .685 0.000
200 -.121 -.041 .789** .087 .563 0.000
400 -.121 -.041 .789** .015 .412 0.000
800 -.121 -.041 .789** .001 .245 0.000
International Journal of Research in Engineering & Applied Sciences
Email:- [email protected], http://www.euroasiapub.org
115
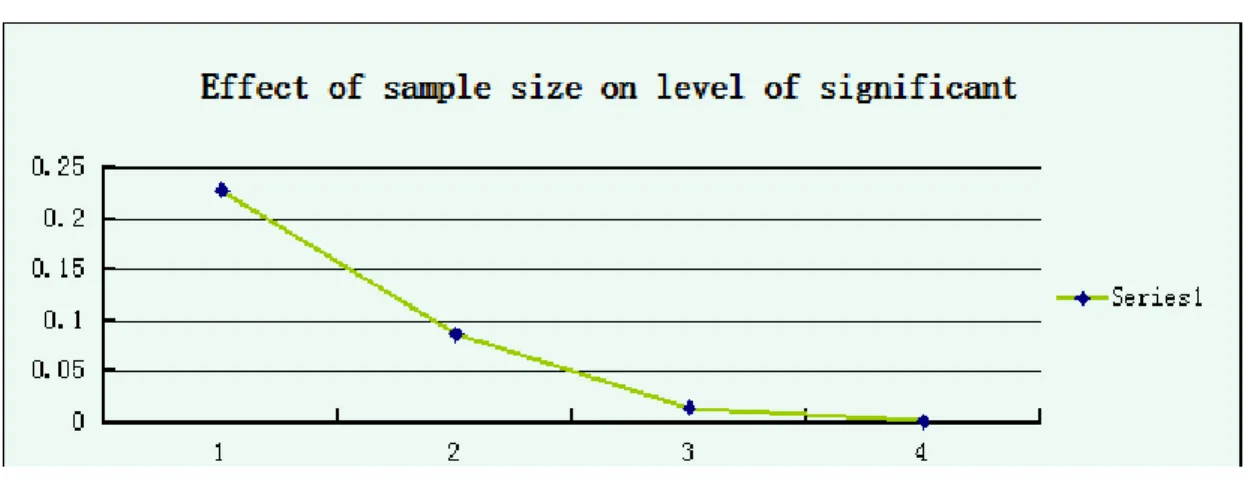
Figure 2: Effect of sample size on level of significanceThe perusal of table no.1 and figures no. 1& 2 show that:
- There is no difference between the values of Pearson correlation coefficients with respect to
the sample size. Thus the null hypothesis “There is no effect of sample size on correlation coefficient" is accepted.
- There is difference in levels of the significance for correlation coefficients according to
sample size. The big sample size yields small level of significance. In other words, the level of errors becomes less if the sample size is bigger.
Second objective: To know the effect of sample size on (R2) determination coefficient and F value
of multiple regression
Table No. 2: Effect of sample size on (R2) determination coefficient and F value of multiple
regression
Sample Size
(R2) Determination Coefficients F Value Levels of Sig.
100 .023 1.123 .329b
200 .023 2.282 .105b
400 .023 4.598 .011b
International Journal of Research in Engineering & Applied Sciences
Email:- [email protected], http://www.euroasiapub.org
116
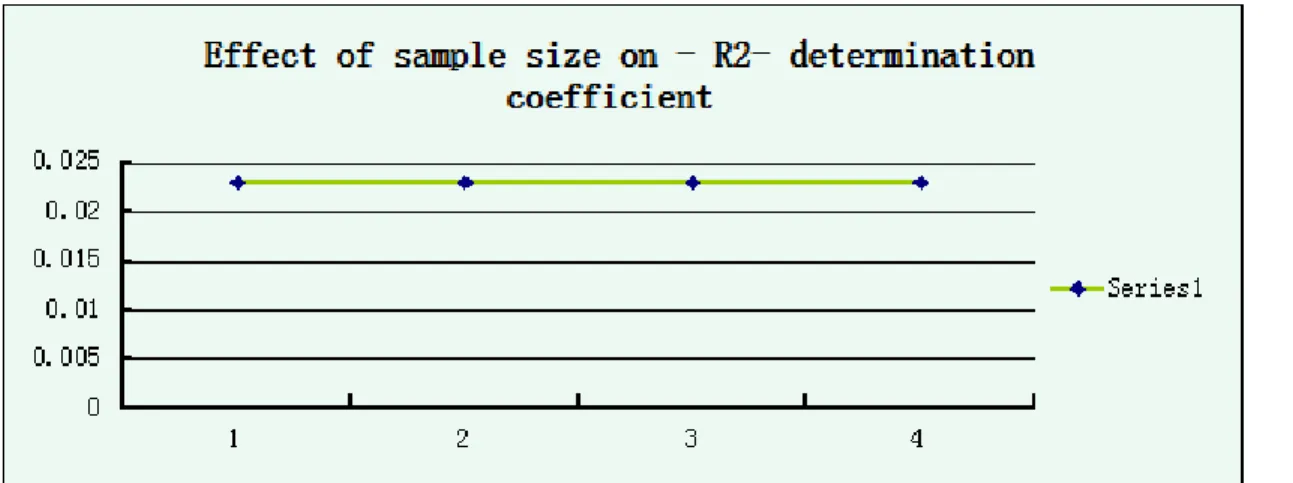
Figure 3: Effect of sample size on determination coefficientFigure 4: Effect of sample size on F value The above given table (2) and figures (3 and 4) show that:
- There is no difference in the values of determination coefficients according to the sample size.
In other words, the value of the determination coefficients is not affected by sample size.
- There is difference in the values of F (ANOVA) of multiple regression according to sample size.
The big sample size yields high value for F. it can be said that the level of F value becomes high if the sample size is bigger. Thus, the null hypothesis “there is no effect of sample size on
(R2) determination coefficient and F value of multiple regression" is rejected.
Third objective: To know the effect of sample size on Beta coefficient of multiple regression
Table No. 3: Effect of sample size on Beta coefficient of regression
Sample Size
Beta Coefficient for First Independent Variable
Levels of Sig.
Beta Coefficient for Second Independent Variable
Levels of Sig.
100 -.236 .153 .145 .377
200 -.236 .041 .145 .208
400 -.236 .004 .145 .073
International Journal of Research in Engineering & Applied Sciences
Email:- [email protected], http://www.euroasiapub.org
117
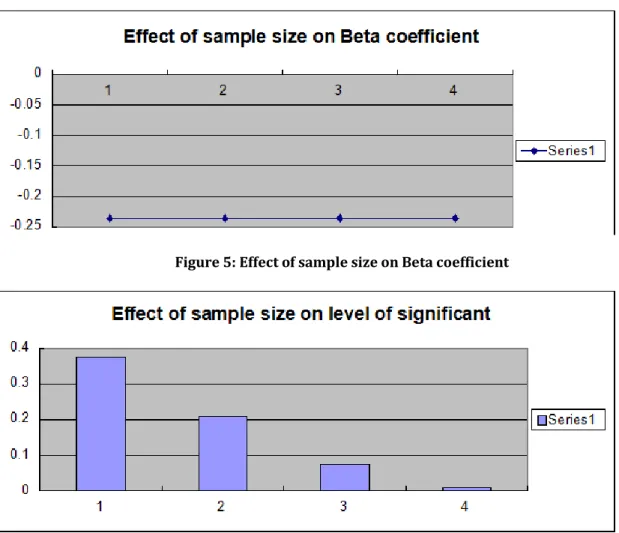
Figure 5: Effect of sample size on Beta coefficientFigure 6: Effect of sample size on level of significance for Betacoefficient
It can be concluded from the above given table (3) and figures (5 and 6) that:
- There is no difference in the values of Beta coefficient for independent variables according
to the sample size. Thus the null hypothesis “there is no effect of sample size on Beta coefficient of regression" is accepted.
- There is difference in the levels of significance for Bate coefficient according to sample size.
The big sample size yields small level of significance, in other words, the level of errors becomes less if the sample size is bigger.
CONCLUSION
1- It can be concluded that the sample size does not affect the value of correlation coefficient
but it has an effect on the level of significance for correlation coefficient.
2- The result revealed that there is no effect of sample size on (R2) determination coefficient
International Journal of Research in Engineering & Applied Sciences
Email:- [email protected], http://www.euroasiapub.org
118
3- It can be concluded that there is no effect of sample size on Beta coefficient for independent
variables in multiple regression.
4- It can be inferred that level of significance depends on the sample size. If the sample size
will be big then the level of significance would be less or vice versa. In other words, the level of errors becomes less if the sample size is large.
REFERENCES
- Al-Sayd, F. (2005). Statistical pyschology and meausing the human mind . Egypt, Cairo: Dar
al-fikr al-araby.
- Audah, A. (2010). Measurement and Evaluation in Teaching Process (2nd ed.). Amman: Dar
Al'amal (hope publishing).
- Beins, B. C., & McCarthy, M. A. (2012). Research methods and statistics. USA, New York: NJ:
Prentice-Hall.
- Bock, R. D. (1972). Estimating item parameters and latent ability when responses are scored
in two or more nominal categories. Psychometrika, 37, 29-51.
- Field, A. (2009). Discovering statistics using SPSS (3rd ed.). UK, London: SAGE Publications.
- Luis M. Lozano. (2008). Effect of the Number of Response Categories on the Reliability and
Validity of Rating Scales. www.eric.com.
- Messick, S. (1994).The Interplay of Evidence and Consequences in the Validation of
Performance Assessment. Educational Researcher , 23,2 13-23
- Pallant. J. (2011). SPSS SURVIVAL MANUAL. A step by step guide to data analysis using SPSS
for Windows (Version 12). www.allenandunwin.com.
- Qasem, M. A. (2013). A comparative study of classical theory (CT) and item response theory
(IRT) in relation to various approaches of evaluating the validity and reliability of research
tools. IOSR Journal of Research & Method in Education (IOSR-JRME), 3(5), 77-81.
- Qasem, M., Almoshigah, T., & Gupta, S. (2014). The effect of number of alternatives
(Two/Three/ Five) on Alpha Cronbach reliability coefficient and also on the validity in
Likert scale. International journal of innovative research &studies,13 (6), 324 – 333.
- Sheskin, D. (2000). Parametric and nonparametric statistical procedures (2nd ed.). USA:
Chapman & Hall/CRC.
- Singh,Y. K. (2006). Fundamental of research methodology and statistics. India, New Delhi: