Journal of Ap plied Food Technolog y
Ho me page : http s:// ejournal 2.undi p.a c.i d /i ndex.php/ ja ft
Estimation of Age Save Pasta Spice for
Dekke Mas Na Niura
with
the Accelerated Shelf Life Test (ASLT) Method Arrhenius Equation
Natalia Putri Erva Simbolon, Anang Mohammad Legowo, Bhakti Etza Setiani*
Department of Food Technology, Faculty of Animal and Agricultural Sciences, Diponegoro University, Indonesia
*Corresponding author ([email protected])
Abstract Received: 19 Jun 2019 Article information:
Accepted:21 Jun 2019
Available online: 21 Juni 2019
Keywords: Dekke mas na niura
shelf life Aw pH TPC
© 2019 Indonesian Food Technologists All rights reserved
This is an open access article under the CC BY-NC-ND license
doi: 10.17728/jaft.5170
Dekke mas na niura is a typical local food of North Sumatra made from carp which does not undergo cooking processes such as frying, steaming, burning, or boiling but is only paraded. This study aimed to estimate the shelf life of pasta spices using the Arrhenius equation model Accelerated Shelf Life Test (ASLT). This research was conducted at the Laboratory of Food Chemistry and Nutrition, Faculty of Animal Husbandry and Agriculture, Diponegoro University, Semarang. The materials used in making spices dekke mas na niura are andaliman, pecan, turmeric, kecombrang / rias, onion, garlic, salt, red chili, lime, kaffir lime, galangal, and peanuts. The method used for making pasta spices is by mixing spices and grinding ingredients until smooth. Spices are stored at 25°C, 30°C, 35°C and 40°C for 24 hours of storage. The Analysis is carried out every 6 hours. The parameters tested were Aw value, pH value, and total bacteria (TPC). The results of the test data are then made linear regression with the making of ordes 0 and orde 1, then from the data, the shelf life calculation is done with the Arrhenius equation. The results showed that the highest Aw, pH, and total bacterial values were at 40°C which were stored for 24 hours. The critical point used in estimating shelf life is total bacterial orde 1. Estimation of shelf life based on total bacteria is 5.6 days (25°C); 7.1 days (30°C); 5.6 days (35°C); and 5.2 days (40°C). Storage of pasta ingredients
dekke mas na niura optimum at 30°C. Overall, the higher the storage temperature and storage time, the shorter the shelf life.
Introduction
Regional food that has long been produced and consumed by the people of the area is also called local food. Local food products are usually closely related to the culture of the local community (Dewi and Nur, 2013). Generally, local foods are made from local areas and are processed traditionally. One of the local foods is
dekke mas na niura from North Sumatra.
Dekke mas na niura is made from the main ingredients of carp (Cyprinus carpio L.) which do not undergo cooking processes such as frying, steaming, burning, or boiling. The processing of dekke mas na niura is only done by soaking carp with herbs, utte jungga acid water (sunde). Utte jungga or often referred to as the kaffir lime Batak people has triterpenoid content and its essential oil can suppress a variety of disease risks especially as anti-bacterial (Sinaga, 2012). Soaking the goldfish is also called marination. Processed goldfish can also be said to be Shasimi of Batak people, but not all Indonesian people know this
cuisine.
Making dekke mas na niura that requires diverse food ingredients and some food can only be obtained in North Sumatra makes people start forgetting. The processing of na niura seasoning into a ready-made pasta spice is a food product that is more practical and has a high economic value, with the presence of pasta na niura spices will make traditional food lift again. The need to determine the shelf life of a product can be an added value in making ready-to-serve or instant pasta spices so that the product can be marketed and have a high selling value.
Materials and methods
Materials
physiological NaCl 0.85%, buffer pH 4 and pH 7, and 70% alcohol for disinfectants. The tools used in making pasta spices dekke mas na niura are blenders, knives, cutting boards, pans, gas stoves, frying spoons, tube pots, and scales. The tools used for analysis included aluminum foil, cotton, incubator, analytical scales, autoclaves, measuring cups, test tubes, petri dish, erlenmeyer flask, measuring cups, pH meters, Aw meters, laminar, and micropipette.
Methods
Making Pasta Spice Dekke mas na niura
The stages of processing spice begin with determining the formulation based on the composition of the spices used (Table 1). Dry ingredients such as candlenut and peanuts are sorted, roasted until fragrant and change slightly brownish, then the roasted beans are skinned with husk. Fresh spices are sorted, peeled, weighed, and washed. After the washing is complete, then do the crafting and put in a blender to be ground together with candlenuts and roasted beans. Spice milling is done until smooth with the addition of lime juice and kaffir lime juice.
Sample Storage and Sampling
Pasta seasoning dekke mas na niura that has been made is put into 34 pots. A sampling at 0 o'clock was carried out by taking 2 pots for Aw, pH, and TPC analysis. A sample of 32 other pots was divided into 4 groups (8 pots each) and stored in an incubator at 25°C, 30°C, 35°C, and 40°C. Sampling were done by taking 2 pots from each incubator at 6, 12, 18, and 24 hours. The samples were analyzed for Aw, pH, and TPC.
Water Activity Analysis (Aw)
The testing of water activity is carried out by the method of Saenab et al. (2010) that has been modified. The sample was weighed as much as 8-12 g in the sample container at Aw meter. The container is tightly closed and left for 30 minutes. The sample is entered in Aw meter, the ON button is pressed, waiting for the number that comes out to be constant and recorded.
PH analysis
PH measurement was carried out by the modified AOAC (1995) method. The sample is placed in the cup as much as half of the cup. The pH meter is turned on and calibrated with a pH 7 buffer and pH 4. After calibration, the tool is ready for use, then punctuate the pH meter in the prepared sample in a container, read and record the pH value indicated on the pH meter display tool layer.
Total Microorganism Analysis (TPC)
The total testing method for microorganisms uses the Total Plate Count (TPC) (SNI 2897: 2008). Seasoning samples were weighed as much as 1 gram then put in physiological NaCl solution 0.85% as broodstock. Dilution is carried out by taking as much as 1 ml of suspense from the brood tube transferred by micropipette into 9 ml of physiological NaCl solution 0.85% to obtain a 10-1 dilution. Dilution is carried out until the dilution rate is 10-6. 15-20 ml Medium Plate Count Agar (PCA) which has been sterilized and lowered in temperature to around 45°C (lukewarm) and
then poured into a sterile petri dish which has 1 ml 10-4, 10-5, and 10- suspense suspensions 6. The cup which contains the sample solution and the PCA media is rotated to form number 8 which aims to make the sample spread perfectly in the petri dish and let it stand until it is solid. Dilution and capturing conditions are carried out in a sterile process. The condensed cup was then incubated at 34°C for 24 hours with the inverted cup position. The calculation of the number of colonies is carried out in each series of dilutions. Calculation of the number of colonies is calculated as follows:
𝑇𝑃𝐶 = 𝑛𝑢𝑚𝑏𝑒𝑟 𝑜𝑓 𝑐𝑜𝑙𝑜𝑛𝑖𝑒𝑠 𝑥 1 𝑑𝑖𝑙𝑢𝑡𝑖𝑜𝑛 𝑓𝑎𝑐𝑡𝑜𝑟
Estimated Shelf Life
Estimation of shelf life is done by the Arrhenius equation model cited in Faridah et al. (2013). The results of the product quality analysis are plotted in a graph of the relationship between the length of storage and the average quality reduction per day called to orde 0. Orde 1 is obtained by changing the analysis data in ln form and plotted in a long storage relationship graph with quality degradation. Based on the data, the linear regression equation is known so that the equation is obtained:
𝑦 = 𝑎𝑥 + 𝑏 Information:
y : the value of product characteristics x : storage time
a : slope, deterioration rate (k)
b : the value of the initial characteristics of the product
The choice of orde used for the Arrhenius equation is based on the largest coefficient of determination (R2). After determining the orde used, then the graph of the relationship ln is made with 1 / T, where k is the rate of change in parameters and T is the temperature of the matrix in Kelvin units. From the graph, the parameter change rate equation will be obtained and used to calculate the product shelf life. Based on the graph of the relationship ln k with 1 / T, the equation will be obtained:
k = k0 e -Ea/RT
the equation above can be calculated the shelf life of products using equations
At – A0 = kt Information:
At : the value of quality A at time t A0 : initial quality value A
k : quality reduction constant t : prediction of shelf life (days)
Estimation calculations can be saved with the following calculator
𝑡 𝑜𝑟𝑑𝑒 0 =𝐴𝑡− 𝐴0 𝑘 𝑡 𝑜𝑟𝑑𝑒 1 =ln (𝐴𝑡− 𝐴0)
𝑘
Results and Discussion
Water activity (aw)
affects the time saved for a food ingredient and the quality of the food. The range of water activity values is 0–1. A high aw value will shorten the shelf life of food, while a low aw value will extend the shelf life of food. aw, the value of pasta ingredients dekke mas na niura
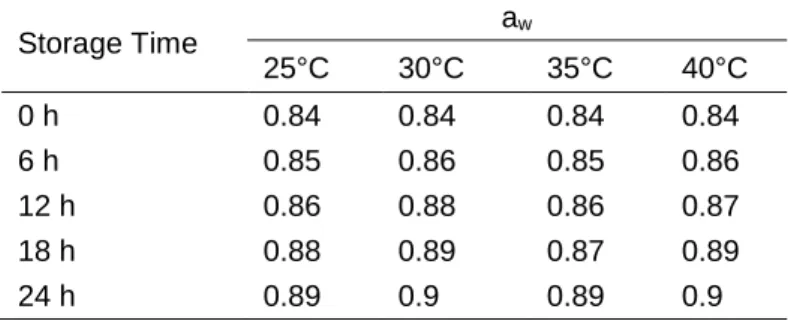
without treatment has a fairly high value of 0.84, where the value is the minimum critical point of microorganisms can grow. Leviana and Paramita (2017) suggest that food with a value of water activity (aw) that is good for the growth of microorganisms varies with each type, namely bacteria at aw value 0.90, yeast value aw 0.8–0.9 and mold value aw 0.6–0.7. aw value is quite high at the beginning can be caused by the paste seasoning dekke mas na niura which has a high water content because the spice has high water content. Research on storage of cingur rujak spices conducted by Sarastuti, et al. (2015) stated that the condition of the initial raw material with lower water content would affect the aw value of the final product produced because the value of the water content is directly proportional to the value of aw. Other factors increase aw value can occur due to hygroscopic properties. Hygroscopic is the ability of a substance to absorb water molecules from its environment. If the relative humidity of the environment is high enough, then the material will absorb a certain amount of water from the environment to adjust to the relative humidity of the environment, so that the value of the water content has increased (Nabila, 2010).
Table 2. Water Activity of Dekke Mas Na Niura Pasta Spice
Storage Time aw
25°C 30°C 35°C 40°C
0 h 0.84 0.84 0.84 0.84
6 h 0.85 0.86 0.85 0.86
12 h 0.86 0.88 0.86 0.87
18 h 0.88 0.89 0.87 0.89
24 h 0.89 0.9 0.89 0.9
Based on Table 2 are then made in graphical form with the x-axis being the length of storage in hours and the y-axis is the aw value for linear equations and determination coefficients (R2) aw orde parameter 0. Value graph aw pasta spice dekke mas na niura orde 0 can be seen in Figure 1. In making a 1st orde plot, the aw value is converted into ln form before plotted with the storage time (Figure 2). From Figure 1 and 2, it can be seen that the greatest R2 value is 0.9868, which is R2 from aw paste seasoning for the orde of 0 orde temperature 40°C so that the calculation of shelf life estimation is a orde 0 plot. linear equation. The value of k is the slope value, which is obtained from the value of an in the equation y = ax + b. the k value is then converted into ln k form and then used to graph the Arrhenius plot between ln k with 1 / T in Kelvin. The Arrhenius graph of the aw parameter can be seen in Figure 3. From Figure 3, the components can be used in the calculation of shelf life. From this graph, we can find the equation ln k. Based on the linear regression equation obtained in Figure 3, a quality reduction equation can be determined as follows:
y = -313.31x - 5.0555
ln k = -313.31 (1 / T) - 5.0555
The value of the slope degree of the line equation is the value of -Ea/R from the Arrhenius equation so that the activation value of the pasta seasoning dekke mas na niura is obtained as follows:
-Ea/R = -313.31K Ea = (-313.31) x 1,986 Ea = 622.23366 cal / mol K
The intercept value is ln k0 from the Arrhenius equation, so the value k0 is obtained which is a constant that is not dependent on temperature. Using Arrhenius's equation is obtained:
ln k0 = -5.0555 k0 = 0.0064
Figure 1. aw Spices Pasta Dekke Mas Na Niura Orde 0
Figure 2. aw Spices Pasta Dekke Mas Na Niura Orde 1
Figure 3. Corelation ln k aw Orde 0 with Temperature
PH
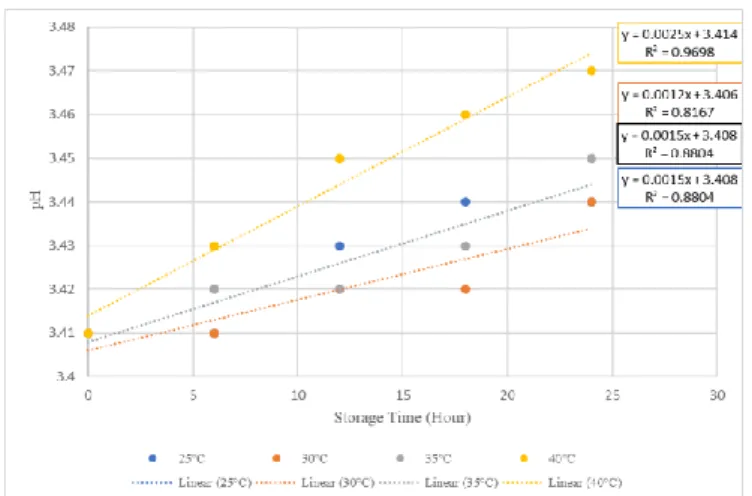
in pH value in spices is influenced by the presence of organic acids in the ingredients. According to Negari (2011), the results of the decomposition of organic acids in foodstuffs are CO2 and H2O, so that the concentration of H+ originating from organic acids becomes reduced, with a reduced concentration of H+ causing pH to rise. The increase in pH value during storage is thought to be due to the occurrence of a fermentation process by microbes that grow during storage. Buckle et al. (1985) in Mamuaja and Helvriana (2017) state that some microorganisms, especially yeast and mold, can break down acids that naturally exist in food or which are added will result in increase pH. The average pH value of pasta spices for fish during storage is at 3.43, where the average value is not in the optimum pH of microorganism growth. The group of microorganisms has an optimum pH to grow, according to Asiah et al. (2018) bacteria grow in the range of pH 6.0–8.0, yeasts between pH 4.5–6.0 and fungi between 3.5–4.0. Based on the graph in Figure 4, the longer the storage carried out, the higher the pH value of the pasta ingredient dekke mas na niura produced
Table 3. pH Value of Dekke mas na niura Pasta Spice
Storage Time pH
25°C 30°C 35°C 40°C
0 h 3.41 3.41 3.41 3.41
6 h 3.41 3.41 3.42 3.43
12 h 3.43 3.42 3.42 3.45
18 h 3.44 3.42 3.43 3.46
24 h 3.44 3.44 3.45 3.47
Value graph pH pasta spice dekke mas na niura orde 0 can be seen in Figure 4.The reaction of damage to pasta seasoning dekke mas na niura based on pH parameters has not been able to know the reaction orde, so it is necessary to make an orde plot 1. Making a plot of orde 1 pH value of the seasoning is converted into ln form before plotting with storage time (Figure 5).
From Figure 4 and 5 , it can be seen that the greatest R2 value is 0.9698, which is R2 from the pH of paste seasoning dekke mas na niura orde 0 at 40°C so that the calculation of shelf life estimation is a 0 orde plot. linear equation. The value of k is the slope value, which is obtained from the value of an in the equation y = ax + b. the k value is then converted into ln k form and then used to graph the Arrhenius plot between ln k with 1/T in Kelvin (Figure 6).
From Figure 6, the components can be used in the calculation of shelf life. From this graph, we can find the equation ln k. Based on the linear regression equation obtained in Figure 6, a quality reduction equation can be determined as follows:
y = -3169.4x + 3.9257 ln k = -3169.4 (1/T) + 3.9257
The value of the slope degree of the line equation is the value of -Ea/R from the Arrhenius equation so that the activation value of the paste seasoning is obtained as follows:
-Ea/R = -3169.4K Ea = (3169.4) x 1,986 Ea = 6294.4284 cal / mol K
The intercept value is ln k0 from the Arrhenius equation,
so the value k0 is obtained which is a constant that is not dependent on temperature. Using Arrhenius's equation is obtained:
ln k0 = 3.9257 k0 = 50.68855
Figure 4. pH Spices Pasta Dekke Mas Na Niura Orde 0
Figure 5. pH Spices Pasta Dekke Mas Na Niura Orde 1
Figure 6. Corelation ln k pHOrde 0 with Temperature
Total Microbes (TPC)
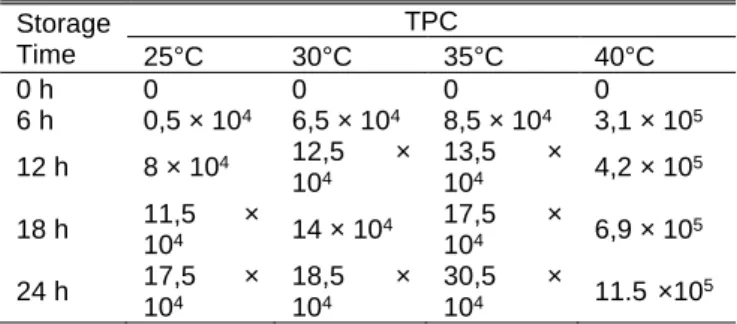
that the number of microbes in a food product will also increase during storage, besides the microbes found in food are thought to originate from various sources such as soil, water, dust, air and the environment where the product is stored. The results of pH analysis on pasta spices dekke mas na niura obtained a range of pH from 3.41-3.47, with the pH value it can be seen that the types of microbes that grow on spices during storage are types of fungi. Asiah et al. (2018) stated the same thing, namely bacteria growing at a range of pH 6.0–8.0, yeast between pH 4.5–6.0 and fungi between 3.5–4.0. Banwart (1989) in Bawinto et al. (2015) suggested that at temperatures of 25–35°C, pH 1.9–9.3 with optimum pH 4.5-6.7, and optimum aw 0.99 Penicillium sp. can grow. Based on the Peraturan Kepala Badan Pengawas Obat dan Makanan No. 16 Tahun 2016 the maximum total plate number on spices and condiments is ready to use pasta (wet), which is 104 colonies/gram.
Table 4. Total Microbes of Dekke mas na niura Pasta Spice
Storage Time
TPC
25°C 30°C 35°C 40°C
0 h 0 0 0 0
6 h 0,5 × 10⁴ 6,5 × 10⁴ 8,5 × 10⁴ 3,1 × 10⁵
12 h 8 × 10⁴ 12,5 ×
104
13,5 ×
104 4,2 × 10⁵
18 h 11,5 ×
104 14 × 104
17,5 ×
104 6,9 × 10⁵
24 h 17,5 ×
104
18,5 ×
104
30,5 ×
104 11.5 ×10
5
Based on Table 4 are then made in graphical form with the x-axis being the length of storage in hours and the y-axis is TPC to find out linear equations and coefficient of determination (R2) TPC orde of 0 (Figure 7).The reaction of damage to pasta spices based on TPC parameters cannot yet be known for its reaction orde, so an orde plot must be made. The following is the value of ln the TPC parameters for each treatment presented in the form of tables in graphs in Figure 8. Based on Figure 7 and 8, linear equations are known for each temperature treatment and the coefficient of determination of the two orders. The R2 value of the two graphs is then compared to determine the order that will be used in the calculation of shelf life, where the value of R2 is the largest that will be used in the next calculation (Figure 9).
From Figure 9 it can be seen that the greatest R2 value is 0.9977, which is R2 from TPC paste seasoning dekke mas na niura first order temperature 25 ° C so that what will be used in the calculation of shelf life estimation is order 1 plot. linear equation. The value of k is the slope value, which is obtained from the value of an in the equation y = ax + b. the k value is then converted into ln k form and then used to graph the Arrhenius plot between ln k with 1 / T in Kelvin (Figure 9). From Illustration 9, the components can be used in the calculation of shelf life. From this graph, we can find the equation ln k. Based on the linear regression equation obtained in Illustration 9, a quality reduction equation can be determined as follows:
y = 305.81x - 6.7231
ln k = 305.81 (1 / T) - 6.7231
The value of the slope degree of the equation of
the line is the value of -Ea / R from the Arrhenius equation. The slope with the general gas (R) is known to be -607.33866 cal/mol K, which means pasta spices dekke mas na nura has an activation energy of -607.33866 cal/mol K. The activation energy obtained from the calculation below:
-Ea/R = 305.81K Ea = (305.81) x 1,986 Ea = -607.33866 cal/mol K
The intercept value is ln k0 from the Arrhenius equation, so the value k0 is obtained which is a constant that is not dependent on temperature. Using Arrhenius's equation is obtained:
ln k0 = -6.7231 k0 = 0.0012
Estimated Shelf Life
Determination of product shelf life using the ASLT method uses parameters that can accelerate the process of product quality degradation, namely total bacteria (TPC) in Table 5. The selection of critical parameters of pasta seasoning is determined by the most influential quality parameters in causing product damage so it is not feasible consumed. The selection of this critical point parameter is because this seasoning does not undergo the cooking process so that it is susceptible to microbes that are harmful to the human body. Based on the Regulations Head National Food and Drug Agency Number 16 Years 2016 the maximum total plate number on spices and condiments is ready to use pasta (wet), which is 104 colonies/gram. The results of the estimation of shelf life of pasta spice dekke mas na niura can be seen in Table 5. Based on the total microbial parameters (TPC) shows that the higher the storage temperature of pasta spices, the shorter the shelf life. Storage of pasta ingredients dekke mas na niura optimum at 30°C. Storage at 30°C has a longer shelf life than other storage temperatures. This occurs because the rate of increase in total microbes is lower than the storage temperature below 30°C and above the storage temperature of 30°C. High microbial growth rates are the cause of the rapid decline in food quality. Herawati (2008) states that increasing the shelf life of food can be done by taking into account the factors that cause damage to quality. Storage of pasta ingredients
dekke mas na niura optimum at 30°C
Table 5. Estimated Shelf Life of Dekke mas na niura
Pasta Spice
Temperature k A0 At ln A0
ln At t (day) 25°C 0.0687 0 104 9.210 5.6
30°C 0.0542 0 104 9.210 7.1
35°C 0.0682 0 104 9.210 5.6
40°C 0.0738 0 104 9.210 5.2
Conclusion
temperatures increases with the length of storage. The value of acidity (pH) of the paste seasoning increases with all storage temperatures. Total microbes (TPC) increase at each storage temperature. Based on total microbial parameters (TPC) with a critical point of 104, it is known that shelf life is 5.6 days at a storage temperature of 25°C, 7.1 days at a storage temperature of 30°C, 5.6 days at a storage temperature of 35°C, and 5.2 days at a storage temperature of 40°C. Storage of pasta ingredients dekke mas na niura optimum at 30°C.
References
AOAC. 1995. Official Methods of Analysis of The Asosiation Official Analytical Chemist. Washington DC. USA.
Asiah, N., Cempaka, L.,David, W. 2018. Practical Guidelines for Estimating the Age of Saving Food Products. UB Press, Jakarta. (In Bahasa Indonesia).
BPOM RI. 2016, Regulation of the Head of RI POM No. 16 of 2013 Microbiological Criteria in Processed Food. RI POM Agency, Jakarta. (In Bahasa Indonesia).
BSN. 2008. SNI 2897:2008. Testing Methods for Microbial Contaminations in Meat, Eggs and Milk and Processed Products. Badan Standar Nasional, Jakarta. (In Bahasa Indonesia). Banwart, GJ. 1989. Basic Food Microbiology.
Second Edition. Chapman and hall. New York. In : Bawinto, A. S., Mongi, E., dan Kaseger, B. E. 2015. Analysis of Water Content, pH, Organoleptics, and Molds on Tuna Products (Thunnus Sp) Asap, in Girian Bawah Village, Bitung City, North Sulawesi. Jurnal Media Teknologi Hasil Perikanan. 3(2): 55-65. (In Bahasa Indonesia).
Buckle, K. A., Edwards, R. A., Fleet, G. H., Wooton, D. M. 1985. Food Science, Translator H. Purnomo and Adiono. UI Jakarta. In : Mamuaja, C. F., dan Helvriana, L. 2017. Characteristics of Tomato Paste with Addition of Citric Acid During Storage. Jurnal Ilmu dan Teknologi Pangan. 5 (1): 17-23. (In Bahasa Indonesia).
Dewi, N., and Nur, A. 2013. Local Food Processing Technology. Balai Pengkajian Teknologi Pertanian, Jambi. (In Bahasa Indonesia). Fardiaz,. S., 1992. Food Microbiology I. Penerbit
Gramedia Pustaka Utama. Jakarta. (In Bahasa Indonesia).
Faridah, D. N., Yasni, S., Suswantinah, A., Aryani, G. W. 2013. Estimated Age Save with the Accelerated Shelf-Testing Method on Instant Bandrek Products and Nutmeg Fruit Syrup (Myristica Fragnans).Jurnal Ilmu Pertanian Indonesia (JIPI). 18 (3): 144-153. (In Bahasa Indonesia). Herawati, H. 2008. Save Age Determination on Food
Products. Jurnal Litbang Pertanian. 27(4): 124-130. (In Bahasa Indonesia).
Leviana, W., and Paramita, V. 2017. The Effect of Temperature on Water Levels and Activities of Water in Materials on Turmeric (Curcuma Longa) with Electrical Oven Dryers. METANA. 13(2): 37-44. (In Bahasa Indonesia).
Nabila, Y. 2010. Pasta Spice Cultivation Fried Chicken
and Quality Changing During The Storage. [Bachelor Thesis]. Institut Pertanian Bogor, Bogor. (In Bahasa Indonesia).
Negari, Y. S. 2011. The Effect of Storage on Quality and Safety of Beverage Powder Products Made from FOS and Estimated Life. [Bachelor Thesis]. Institut Pertanian Bogor, Bogor. (In Bahasa Indonesia).
Saenab, A., E. B. Laconi, Y. Retnani., M. S. Mas'ud. 2010. Evaluate the quality of pellet rations containing shrimp byproducts. Jurnal Ilmu Ternak dan Veteriner. 15(1): 31-39. (In Bahasa Indonesia).
Sarastuti, M., and Yuwono, S. S. 2015. The Effect Of Oven And Heating Time On Rujak Cingur Instant Seasoning’s Characteristics During Storage Jurnal Pangan dan agroindustry. 3(2): 464-475. (In Bahasa Indonesia).
Sinaga, S. R. 2012. Comprative Test of Effectiveness Kaffir Lime (Citrus Hystrix Dc) with 1% Zinc
Pyrithione Against the Growth of