Chapter 18
PROTECTING INTERNET SERVICES
FROM LOW-RATE DOS ATTACKS
Yajuan Tang, Xiapu Luo and Rocky Chang
Abstract Feedback control is an important element in the engineering of stable Internet services. However, feedback channels are vulnerable to vari-ous Internet attacks. This paper shows analytically that the recently proposed low-rate denial-of-service (DoS) attacks can degrade Internet services by generating intermittent false feedback signals. The effective-ness of the attacks is evaluated using a control-theoretic approach for a general feedback control system and detailed analysis for a specific sys-tem. A nonparametric algorithm based on changes in traffic distribution is proposed for detecting attacks.
Keywords: Feedback control, low-rate DoS attacks, detection, countermeasures
1.
Introduction
Feedback control is a fundamental building block for many dependable com-puting systems, network protocols and Internet services that are required to handle dynamic service demands. A classic example is modeling TCP conges-tion control dynamics with an active queue management (AQM) scheme at a router as a feedback control system. Web servers increasingly rely on feed-back controllers to provide stable and scalable performance (see, e.g., [11, 17, 19]). Moreover, feedback control is a central element in emerging autonomic computing and communications systems (see, e.g., [4, 10]).
However, relatively little attention has been paid to the lack of security of feedback control mechanisms. This paper focuses on denial-of-service (DoS) attacks; in particular, low-rate DoS (LRDoS) attacks that send out intermittent pulses of malicious requests to victims. Examples of these attacks include reduction of quality (RoQ) attacks [6, 7] and pulsing denial-of-service (PDoS) attacks [14, 16]. These low-rate attacks are much more flexible than shrew attacks [9], which require a fixed time period between attack pulses. In the rest
of this paper, we do not distinguish between RoQ and PDoS attacks; instead, we refer them to as low-rate DoS (LRDoS) attacks.
LRDoS attacks are particularly effective on feedback control systems. When a system encounters an attack pulse, it is temporarily overloaded. There are two consequences to this overloading: (i) new requests are refused during the attack, because resources are depleted by the malicious requests, and (ii) it takes some time for the system to recover to its normal state using a feedback controller. Many new requests are also turned down during this recovery period. Therefore, a sequence of properly-spaced attack pulses induces intermittent false feedback signals, which could force the server to persistently operate in a low-throughput region.
This paper has two parts. The first part examines the potential effects of LRDoS attacks on feedback-based Internet services. A control-theoretic ap-proach is used to model these services and analyze the performance degradation of a web server under different attack scenarios. The second part of the pa-per presents a new nonparametric algorithm to detect LRDoS attacks based on changes in traffic distribution. Simulation results are used to analyze the attacks and evaluate the detection algorithm.
2.
Related Work
Several researchers have studied LRDoS attacks. Guirguis, et al. [6, 7] originally proposed the RoQ attack, which exploits the transients of adap-tation. They specifically considered the effects on a web server equipped with a feedback-based admission controller. Chan,et al.[1] proposed a related at-tack, which exploits the relative update scheme in computer systems to prevent normal users from joining the service. The procedure for generating the arrival time of the next update is essentially a feedback loop. Luo, et al. [14, 15] analyzed the effects of PDoS attacks on TCP throughput with different AQM schemes and proposed a two-stage detection algorithm.
Sun,et al. [18] presented an LRDoS attack detection scheme based on dy-namic time warping (DTWP), but the scheme incurs high computation com-plexity. Chen and Hwang [2] devised a spectral template matching approach to identify shrew attacks. However, the template is generated from simulation and the test is based on parametric distributions, which may not be represen-tative of real-world environments. Furthermore, the DTWP- and spectrum-based methods may not be able to handle aperiodic LRDoS attacks. Luo and Chang [14] developed a two-stage detection scheme. They also proposed the Vanguard scheme [13] to cover situations where the attack rate is less than or equal to a bandwidth bottleneck that cannot be handled [14]. However, both these schemes require bi-directional data to be effective.
3.
Vulnerabilities to LRDoS Attacks
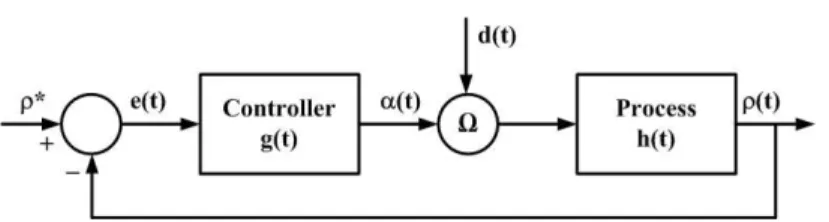
We model feedback-based Internet services as a typical feedback control loop shown in Figure 1. The two major components are the “process” and
Figure 1. Feedback control loop.
the “controller.” The process could represent any Internet service (e.g., email, web services, routing or streaming media) [8]. The output of the processρ(t) is any measurable “process output” (e.g., system utilization or queue length) that is fed back to the controller. α(t) is the “control signal” generated by the controller to move the process output to the desired valueρ∗. The controller is driven by a “control error”e(t) =ρ∗−ρ(t).
On the other hand, the combination of normal requests for services and malicious requests from an LRDoS attack are modeled as a “disturbance input” d(t). Moreover, we useλn(t) to denote the arrival rate of normal requests. And
we model an LRDoS attack as a sequence of Dirac signals: !N
k=1λaδ(t−kτ),
where λa is the attack intensity of each pulse, τ is the time elapsed between
two adjacent attack pulses, andN is the total number of pulses in the attack. Thus, the attack pulses are periodic with periodτ. The input to the process is driven by bothα(t) andd(t) through an operatorΩ. We consider additive [12] and multiplicative [7] operatorsΩin this paper.
In this section, we first use a control-theoretic approach to analyze how an LRDoS attack can degrade the performance of Internet services. Note that the results obtained here apply to any controller and process. In the next section, we will analyze the effect on a web server consisting of a proportional controller, a constant service rate model and a multiplicative operatorΩ.
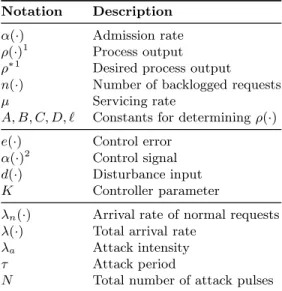
Table 1 summarizes the symbols used in this paper. The upper rows list the parameters associated with the process, some of which are used for the web server in Section 4. The middle rows list the parameters associated with the controller, andK is used for the proportional controller in Section 4. The bottom rows list the parameters for the disturbance inputs.
Due to the lack of space, we will derive the results only for the additive operator Ω; the results for the multiplicative Ω can be derived in a similar manner. Let d(t) = λn(t) +!Nk=1λaδ(t−kτ) = dn(t) +da(t); its Laplace
transform is given by D(s) = L(λn(t)) +λa!Nk=1e−kτs = Dn(s) +Da(s).
Moreover, letG(s) andH(s) be the Laplace transforms of the transfer functions of the controller and the process, respectively. Therefore, the system output for the additiveΩin the s-plane is:
Y(s) = R(s)G(s) +Dn(s) 1 +G(s)H(s) H(s) +
Da(s)
1 +G(s)H(s)H(s), (1) whereY(s) andR(s) are the Laplace transforms ofρ(t) andρ∗, respectively.
Table 1. Notation. Notation Description α(·) Admission rate ρ(·)1 Process output ρ∗1
Desired process output n(·) Number of backlogged requests
µ Servicing rate
A, B, C, D,ℓ Constants for determiningρ(·) e(·) Control error
α(·)2
Control signal d(·) Disturbance input
K Controller parameter
λn(·) Arrival rate of normal requests
λ(·) Total arrival rate
λa Attack intensity
τ Attack period
N Total number of attack pulses
1
We useρ(·) andρ∗
to refer to system utilization in Section 4. 2
We useα(·) to refer to admission rate in Section 4.
In an attack-free environment, the feedback control loop enables the process output ρ(t) to converge to ρ∗. Consequently, the entire system could attain
the best performance according to its design. However, Theorem 1 shows that an LRDoS attack impedes this convergence by introducing oscillations to the outputρ(t). This is an undesirable phenomenon for Internet services, because the oscillations result in performance degradation and unstable services. More-over, Corollary 2 shows thate(t), which affects the control signalα(t), will also fluctuate periodically, and its amplitude is modulated by the attack intensity. Therefore,e(t) cannot converge to zero as long as attack pulses are present. In other words, the attacker could inflict different scales of damage by tuning the attack intensity.
Theorem 1
Under an LRDoS attack, the system output comprises a responsecaused by the normal requests and an additional oscillating component due to the attack: ρ(t)∼ρn(t) +λa!Nk=1f(t−kτ).
Proof 1
We prove the theorem for an additive Ω. By taking an inverseLaplace transform of Equation 1,ρ(t)comprises an attack-free component and an attack-induced component: ρ(t) =ρn(t) +ρa(t). Moreover,
ρa(t) =L−1 " λa!Nk=1e−kτs 1 +G(s)H(s)H(s) # =λa N $ k=1 f(t−kτ). (2)
It is not difficult to see thatf(t) =L−1( H(s)
1+G(s)H(s))is the system output excited
by δ(t) when ρ∗ = 0, because L(δ(t)) = 1. Moreover, being a stable system, ρn(t)converges to a steady state. Therefore, the trajectory of ρ(t)is a stable, periodic function.
Corollary 2
Under an LRDoS attack, e(t) oscillates in the time domainand its magnitude is proportional to the intensity of the pulse e(t)∼ en(t)−
λa!N
k=1f(t−kτ), where en(t)is the error caused by the normal requests and f(·)is a function introduced by the attack.
Proof 2
We prove the corollary for an additiveΩ. SinceE(s) =R(s)−Y(s),we have E(s) = En(s)−Ea(s). From Equation 2, ea(t) = λa!N
k=1f(t− kτ). Moreover, being a stable system, en(t) = L−1(En(s)) vanishes as t →
∞. Therefore, the attack introduces an oscillation to the error signal with an amplitude proportional to the attack intensity.
4.
LRDoS Attack on a Web Server
Having established the general results in the previous section, we examine a specific feedback-based Internet service – a web server. First, we describe the service model and analyze the service degradation caused by a single attack pulse. Next, we consider a sequence of attack pulses and analyze the service degradation for various attack periods.
The service model under consideration follows Figure 1 with the following components. First, the utilization (ρ(t)) is employed as the system output; the utilization is a piecewise linear function of n(t) (see Equation 5). The controller is a PI controller with parameter K, which takes in ρ∗−ρ(t) and generates an admission rate (α(t)) as the control signal. Therefore, the rate of the admitted requests is given by λ(t)α(t); the unadmitted requests are dropped. As a result, the state vector of the service model comprisesα(t),ρ(t) andn(t); their evolution and relationships are summarized below:
˙ α(t) =K(ρ∗−ρ(t)), α(t)∈[0,1] (3) ˙ n(t) =λ(t)α(t)−µ, n(t)∈[0,+∞) (4) ρ(t) = " An(t) +B ifn(t)<ℓ Cn(t) +D ifn(t)≥ℓ , ρ(t)∈[0,1] (5) Note that this service model is the same as the one in [7], except that it uses a constantµand a continuous-time model, both of which are essential for analytical tractability. In the rest of the paper, we assume a constant rate for normal requests, i.e.,λn(t) =λn.
4.1
Analysis of a Single Attack Pulse
Suppose that an attack pulse arrives att= 0 when the system is in the steady state and its state vector is [α0,ρ0, n0]. The system will evolve through three
0 100 200 300 400 500 0 0.2 0.4 0.6 0.8 1 time α (t) or ρ (t) α(t) ρ(t) η1 η2 η3
Figure 2. Effect of one attack pulse att= 0 onα(t) andρ(t) (A= 0.00267,B= 0.2, C= 0.024, D=−1.4,ℓ= 75,K= 0.01,µ= 90,ρ∗= 0.7 (from [7])).
different stages before reaching the same state after the attack: saturation, recovery I and recovery II. The durations of these three stages are denoted by η1,η2andη3, respectively. The two recovery stages are due to the two piecewise
linear relationships betweenρ(t) andn(t).
Saturation Stage: As soon as the first attack pulse arrives, the system enters into a saturation stage in which we assume that the aggregated arrival rate results in a 100% utilization (i.e., ρ(t) = 1). The utilization stays at 100% throughout this period becausen(t)> µ. Since ρ(t) = 1, according to Equa-tion 3, the admission rate decreases linearly as shown in Figure 2. Therefore, the state evolution during this stage is characterized byρ(t) = 1, ˙α(t) =K(ρ∗−1) and ˙n(t) =λnα(t)−µ.
This stage ends when all the pending requests have been processed, i.e., the total number of processed requests is equal to the total number of admitted requests. Therefore, we can obtain η1 by solving λaα0+!η
1
0 λnα(t)dt = η1µ
with the initial conditions [α0,ρ0, n0], where α0 = α(0−) = α(0+), n+0 =
(λn+λa)α0+n−0 (this is due to the arrival of the attack pulse att= 0), and
ρ0=ρ(0+) = 1: η1= (λnα0−µ) + " (λnα0−µ)2−2λnK(ρ∗−1)((λn+λa)α0+n0) λnK(1−ρ∗) . (6)
Recovery Stage I:At the beginning of this recovery stage, we haven(η1−) =
n(η+1) =λnα(η+1),α(η
−
1) =α(η +
1) =α0+K(ρ∗−1)η1andρ(η1+) =Aλnα(η1+)+
B. Since the utilization is now below the desired level, both the admission rate and utilization increase in this stage. Their evolutions are given by ρ(t) =
Aλnα(t) +B, α˙(t) =K(ρ∗−ρ(t)) and ˙n(t) =λnα(t)−µ. Since this stage ends
when n(t) = ℓ, we can obtain η2 by solving ρ(η2) = Aℓ+B with the initial
conditions (α(η+1),ρ(η1+),λnα(η1)): η2= 1 AλnK lnAλnα(η1) +B−ρ ∗ Aℓ+B−ρ∗ . (7)
Recovery Stage II:The two recovery stages differ only in their parameters and initial conditions. The initial conditions for the second recovery stage are: α(η2−) = α(η2+) = λℓ, ρ(η
−
2) = ρ(η+2) = Aℓ+B, and n(η2−) = ˙n(η+2) =
λnα(η2+)−µ. This stage ends when the utilization reaches the desired value.
Therefore, we can obtainη3 by solving ρ(η3) =ρ∗ with the initial conditions
(α(η2+),ρ(η2+),λnα(η2)): η3= 1 CλnKln Cλnα(η2) +D−ρ∗ bρ∗−ρ∗ , where b≈1andα(η2) = ℓ λ. (8)
4.2
Analysis of Multiple Attack Pulses
When there are multiple attack pulses, different degrees of damage are pro-duced for different attack periods. This section considers four different choices ofτ (only one choice was examined in [7]). Figure 3 illustrates how an attack launched att= 0 degrades the admission rates for the four cases. In all four cases there is a relatively long saturation period at the beginning of the attack (this period is more noticeable for smaller values ofτ). After that, the admis-sion rates converge to oscillating patterns, similar to what we have discussed in Section 3. Moreover, the oscillating periods and the peaks of the admission rates increase withτ.
Case 1 (0 <τ ≤ η1): As in the single pulse case, the admission rate drops
linearly (i.e., ˙α=K(ρ∗−1)). During this declining period more attack pulses
arrive at the victim. However, they do not cause further damage, because the admission rate is already very low. Again, as in the single pulse case, the system eventually serves all the pending requests and the recovery stage starts. However, another attack pulse arrives before the system can restore the admission rate to the normal pre-attack level. As a result, the admission rate drops linearly again. But this time, the system recovers much faster because the admission rate is already at a very low value when the attack pulse arrives. Consequently, the admission rate converges to an oscillation pattern with a small peak value.
Case 2 (η1 <τ ≤η1+η2): As in Case 1, the admission rate drops linearly
in the beginning and the additional attack pulses arriving during this period do not cause further damage. When the recovery stage first starts, the next attack pulse, say thekthpulse, arrives when the admission rate has not yet been
restored (i.e.,α((k−1)τ)<α0). Thisα((k−1)τ) induces a shorterη1for the
next attack period becauseη1is an increasing function with respect to the initial
admission rate (i.e.,∂α0∂η1 >0). Consequently, the time to recover before the next pulse arrival, which is given bykτ−η1, is longer. Unfortunately, the admission
rate still cannot climb back to α0. To see why, suppose that at t =kτ− the
admission rate is large enough thatα(kτ−) = α((k−1)τ−). Therefore, when
the next attack pulse arrives, the same number of attack requests is accepted, which forces the system to oscillate again. As a result, the admission rate converges to an oscillating pattern with a peak value less thanα0.
0 200 400 600 800 1000 0 0.2 0.4 0.6 0.8 1 time α (t) (a) Case 1: 0<τ≤η1. 0 200 400 600 800 1000 0 0.2 0.4 0.6 0.8 1 time α (t) (b) Case 2: η1<τ≤η1+η2. 0 200 400 600 800 1000 0 0.2 0.4 0.6 0.8 1 time α (t) (c) Case 3: η1+η2<τ≤η1+η2+η3. 0 200 400 600 800 1000 0 0.2 0.4 0.6 0.8 1 time α (t) (d) Case 4: η1+η2+η3<τ.
Figure 3. Effects of the attack period on the admission rate (four cases).
Case 3 (η1+η2<τ≤η1+η2+η3): The evolution of the system state is similar
to that in Case 2, except that there is an additional recovery part governed by parametersC andD. The details are, therefore, omitted.
Case 4 (τ > η1+η2+η3): In this case, the system state always returns to
the steady state before the next pulse arrives. Since this case has already been analyzed in [7], we do not discuss it again.
This proves that the system state converges in all four cases. We have derived the maximal and minimal values ofα(t) after convergence, denoted by αmax and αmin, respectively. However, due to a lack of space, we present the expressions forαmax andαmin without proof:
αmax= e−AλnKτ Aλn (Ay+Aλnαmax+B−ρ∗)e A ρ∗ −1y+ρ ∗−B Aλn . (9) αmin=K(ρ∗−1)η1+αmax, (10) wherey=−(λnαmax−µ)− ! (λnαmax−µ)2−2λnK(ρ∗−1)(λn+λa)αmax. Note that αmax−αmin measures the magnitude of the oscillations, and as shown in Figure 3, the magnitude increases withτ.
5.
Detecting LRDoS Attacks
This section describes a new anomaly-based detection scheme for LRDoS attacks. The approach is based on the fact that high-intensity request bursts in an attack disturb the distribution of the arrival rates of normal requests. The detection scheme, therefore, has two components: (i) modeling the distribution using a histogram, and (ii) using a nonparametric outlier detection algorithm to determine whether there is a change in the histogram (assumed to be due to an LRDoS attack). A similar outlier detection approach has been proposed in [5]. However, it differs from our histogram approach in that it uses a clustering technique to group samples under various resolutions.
Suppose that xi, i∈ Z, are request rate samples. For every window ofW samples, say{xm−W+1, . . . , xm}, our detection algorithm determines whether
the latest samplexm has disturbed the distribution. This is accomplished by using a histogram to model the distribution. A histogram consists of a set of equally-spaced intervals of sample values each of which is called a “bin;” the total number of bins is called the “bin resolution.” Given a set of samples, the histogram plots the number of samples falling into each bin (“bin size”). An at-tack is detected when changes are seen in the histogram for{xm−W+1, . . . , xm}
compared with the histogram for{xm−W+1, . . . , xm−1}.
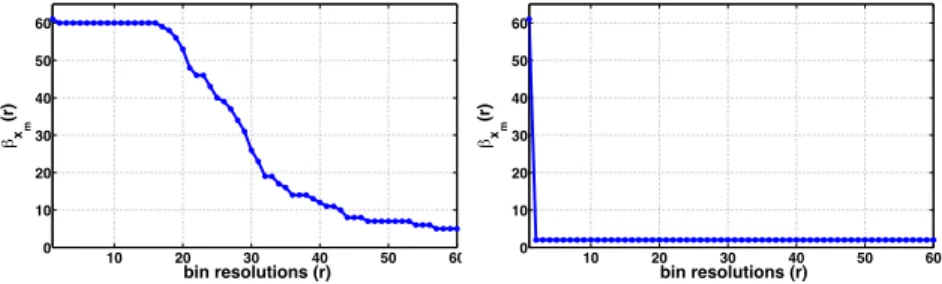
Determining the proper bin resolution is the main drawback of the histogram approach. The issue is resolved by applying the detection strategy to a range of bin resolutions. We first letβxm(r) be the size of the bin that contains the
samplexm when the bin resolution is r. Figure 4 plots the values of βxm(r)
forr ∈ [1,60] obtained from simulation experiments for normal requests and malicious requests. Note that the βxm(r) values for normal requests decrease
more gradually from 60 (whenr= 1) to 1 (whenr= 60). On the other hand, theβxm(r) values for malicious requests drop drastically fromr= 1 to r= 2,
because xm, a sample from the attack pulse, is an outlier compared with the normal request samples. Therefore, the attack can be detected by measuring the changes in βxm(r) values as r increases. For this purpose, we define a
cumulative ratio forxm:
R(xm) = W−1 ! r=1 βxm(r) βxm(r+ 1) . (11)
To see how the statistic in Equation 11 is used to detect an attack, let Rn(xm) (orRa(xm)) be the value ofR(xm) whenxmis a sample from normal (or attack) traffic. If the attack intensity is high enough, the sample xmfrom the attack traffic will most likely be the first sample that is separated from other samples when r is increased beyond one. In the most extreme case, βxm(1) = W and βxm(r) = 1, r > 1; therefore, Ra(xm) = 2W −2. On
the other hand, suppose that xm is from normal traffic. Then, if the normal traffic intensity is uniformly distributed, βxm(r) =
1 r. Therefore, Rn(xm) = "W−1 r=1 r +1 r < "W−1 r=1 r +r r = 2(W −1) =Ra(xm).
10 20 30 40 50 60 0 10 20 30 40 50 60 bin resolutions (r) βx m (r)
(a)xmis a sample from normal requests.
10 20 30 40 50 60 0 10 20 30 40 50 60 bin resolutions (r) βx m (r)
(b)xmis a sample from malicious requests. Figure 4. Change inxm’s bin size when the bin resolution is increased from 1 to 60.
However, to deal with the fact that the normal traffic distribution is usually heavy tailed, we introduce appropriate weights to the ratios in Equation 11 by assigning a higher weight to aβxm(r) that has a higher traffic intensity:
R(xm) = W−1 ! r=1 " βxm(r) βxm(r+ 1) # # # # ¯ xn(r+ 1)−x¯ ¯ x # # # # $ , (12)
where ¯xn(r) is the mean of the samples inxm’s bin and ¯xis the mean of allW
samples. Moreover, ifxm is from normal traffic, ¯xn(r) should not be too far away from ¯x. Ifxm is from attack traffic, ¯xn(r) is much closer toxmbecause of the intensity of the attack traffic.
Therefore, theR(xm) values for a normal traffic sample and an attack traffic sample are revised as follows:
Ra(xm) = (2W −2)# #x¯n¯−¯x x # #≈(2W −2) # #λa¯−x¯ x # #. (13) Rn(xm) =%W−1 r=1 & r+1 r # # # ¯ xn(r)−x¯ ¯ x # # # ' <(2W−2)# #¯xnx¯−x¯ # #=Ra(xm). (14) The final step is to choose a thresholdθsuch that the detection outcome is positive if R(xm) ≥θ. The threshold θ is determined as follows. Denoteσx
as the standard deviation of the firstW −1 samples in the detection window: σx=
(
1 W−1
%m−1
i=m−W+1(xi−x¯)2.Note that ifxm is from attack traffic, then
¯
xm−x >¯ σx; if xm is from normal traffic, ¯xm −x¯ ≈ σx. Also, we have
%W−1
r=2 1r< W−1. Taking these into consideration, we setθ= (2W−2)σx/x¯.
To handle the burstiness in normal traffic, we introduce a weight wd to the threshold value: θ= (2W −2)wdσx/x¯.
6.
Simulation Results
This section evaluates the performance of the detection algorithm for dif-ferent values of wd. MATLAB simulation results are used to assess attack capabilities as well as detection performance. The simulation experiments use
0 50 100 150 200 250 300 350 400 450 500 550 0 10 20 30 40 50 60 τ φ λ a=1000 λa=1200 λa=1500
(a) Attack capability in terms ofφ.
0 50 100 150 200 250 300 350 400 450 500 550 0.6 0.7 0.8 0.91 1.1 1.2 1.3 1.4 1.5 1.6 1.7 τ ψ λa=1000 λa=1200 λa=1500
(b) Attack capability in terms ofψ.
Figure 5. Capability of LRDoS attacks for different values ofτ andλa.
the same parameters as before: A= 0.00267,B = 0.2,C= 0.024,D =−1.4,
ℓ= 75,K= 0.01,µ= 90, andρ∗= 0.7.
Attack Capability: In Section 4, we analyzed the effects of τ on the system output and admission rate of a victim system. Here we use simulations to further quantify the effects. We also study the effects for different values ofλa. First, we define two metrics that characterize the capability of LRDoS attacks: (i) the percent of normal requests dropped due to an attack (denoted byφ), and (ii) the number of normal requests dropped due to an attack perλa (denoted byψ). Therefore, φ= !T 0 (αc−α(t))λndt !T 0 αcλndt ×100 and ψ= !T 0 (αc−α(t))λndt Nλa ,
where T is the observation period (all N attack pulses arrive during T), and
αc is the admission rate when the system is in the steady state and not under attack. Therefore,φmeasures the absolute service degradation. On the other hand, ψ measures the attack effectiveness in terms of the amount of service degradation caused by one attack request.
Figure 5 presents the φ andψ values for attacks withλa = 1000,1200 and 1500 requests per second, andτ ∈[20,500] seconds. For the threeλa values, it is easy to verify that the range ofτ covers the four cases discussed in Section 4. Figures 5(a) and 5(b) show that φ increases with λa while ψ decreases with
λa. Furthermore, for a given value ofλa, φdecreases withτ whileψincreases with τ. Moreover, as τ → ∞, φ → 0, because this is similar to the case of one attack pulse being encountered over a very long observation period. On the other hand,ψ converges to a value below 2, which is the maximal service degradation in terms ofψ.
Figure 6 presents the values of αmax andαmin obtained from simulations; it also includes the analytical results from Equations 9 and 10 for comparison. Note that the simulation results closely match the analytical results. Also, bothαmax andαmin are increasing functions ofτ, which can be validated by
100 200 300 400 500 600 0.5 0.6 0.7 0.8 0.9 τ αmax Analytical αmax (λa=1000) Simulation αmax (λa=1000) Analytical αmax (λa=1200) Simulation αmax (λa=1200) Analytical αmax (λa=1500) Simulation αmax (λa=1500)
(a)αmaxfor different values ofτandλa.
0 100 200 300 400 500 600 0.3 0.4 0.5 0.6 0.7 τ αmin Analytical α min (λa=1000) Simulation αmin (λa=1000) Analytical αmin (λa=1200) Simulation αmin (λa=1200) Analytical αmin (λa=1500) Simulation α min (λa=1500)
(b)αminfor different values ofτandλa.
Figure 6. Analytical and simulation results forαmaxandαmin.
computing the derivatives of Equations 9 and 10. Furthermore,αmaxandαmin
eventually reach plateaus, which indicates that the range of τ corresponds to Case 4 in Section 4.2. Finally, theαmaxvalues for the threeλa values converge
to the same value, but the αmin values do not—a higher λa gives a lower αmin. In other words, a higher attack intensity increases the magnitude of the
oscillations.
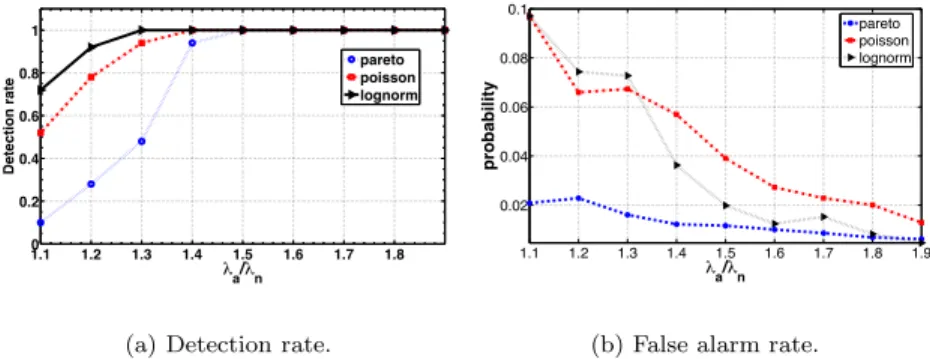
Detection Performance: To evaluate the performance of our detection
al-gorithm, normal traffic was generated using log-normal, Pareto and Poisson distributions. For the log-normal and Pareto distributions, the location pa-rameter was set to 4.6027 and 91.6667, respectively, and the scale parameter to 0.0707 and 12, respectively. For the Poisson distribution, the rate was set to 100. These parameter values yielded mean arrival rates of 100 requests per second for all three distributions. Also, samples for the request arrival rates were computed every second.
Figures 7(a) and 7(b) show the simulation results for the detection rates and false alarm rates, respectively. The detection rate increases with λa
λn for
all three distributions. Also, all the attacks can be detected (i.e., detection rate is 1) when λa
λn is around 1.5. Moreover, the detection algorithm achieves
the highest detection rate for the log-normal distribution before the detection rate reaches 1.0. Note that the variance of the log-normal distribution is ap-proximately 50; this shows that the detection algorithm works well even under bursty normal traffic. The false alarm rate also improves (decreases) with λa
λn.
The false alarm rates for the log-normal and Pareto distributions exhibit simi-lar decreasing trends, whereas the rate for the Poisson distribution is at a low (albeit decreasing) level.
7.
Conclusions
Low-rate DoS (LRDoS) attacks can significantly degrade feedback-based In-ternet services. By sending intermittent attack pulses, these attacks induce victim systems to generate false feedback signals, which cause them to decrease
1.1 1.2 1.3 1.4 1.5 1.6 1.7 1.8 0 0.2 0.4 0.6 0.8 1 λa/λn Detection rate pareto poisson lognorm
(a) Detection rate.
1.1 1.2 1.3 1.4 1.5 1.6 1.7 1.8 1.9 0.02 0.04 0.06 0.08 0.1 λa/λn probability pareto poisson lognorm
(b) False alarm rate.
Figure 7. Performance of the new detection algorithm for values of λa
λn.
their request acceptance rates. The nonparametric algorithm presented in this paper analyzes changes in traffic distribution to detect attacks. Extensive sim-ulation results demonstrate that the algorithm is very effective at detecting LRDoS attacks.
Our current research is investigating strategies for optimizing LRDoS attacks and improving detection capabilities. We are also experimenting with several TCP variants, especially those targeting Linux systems (e.g., Veno, Hybla, Westwood+).
Acknowledgements
This work was partially supported under Project No. PolyU 5080/02E from the Research Grant Council of the Hong Kong Special Administrative Region, China, and by a grant from the Cisco University Research Program Fund.
References
[1] M. Chan, E. Chang, L. Lu and S. Ngiam, Effect of malicious
synchro-nization, inApplied Cryptography and Network Security (LNCS 3989), J.
Zhou, M. Yung and F. Bao (Eds.), Springer, Berlin-Heidelberg, Germany, pp. 114–129, 2006.
[2] Y. Chen and K. Hwang, Collaborative detection and filtering of shrew
DDoS attacks using spectral analysis,Journal of Parallel and Distributed
Computing, vol. 66(9), pp. 1137–1151, 2006.
[3] Y. Diao, J. Hellerstein, S. Parekh, R. Griffith, G. Kaiser and D. Phung,
Self-managing systems: A control theory foundation, Proceedings of the
Twelfth IEEE International Conference and Workshops on the Engineering of Computer-Based Systems, pp. 441-448, 2005.
[4] Y. Diao, S. Parekh, R. Griffith, G. Kaiser, D. Phung and J. Hellerstein,
A control theory foundation for self-managing computing systems, IEEE
Journal on Selected Areas of Communications, vol. 23(12), pp. 2213–2222, 2005.
[5] H. Fan, O. Za¨ıane, A. Foss and J. Wu, A nonparametric outlier detection
for effectively discovering top n outliers from engineering data, in
Ad-vances in Knowledge Discovery and Data Mining (LNCS 3918), W. Ng, M. Kitsuregawa, J. Li and K. Chang (Eds.), Springer, Berlin-Heidelberg, Germany, pp. 557–566, 2006.
[6] M. Guirguis, A. Bestavros and I. Matta, Exploiting the transients of
adap-tation for RoQ attacks on Internet resources, Proceedings of the Twelfth
IEEE International Conference on Network Protocols, pp. 184–195, 2004. [7] M. Guirguis, A. Bestavros, I. Matta and Y. Zhang, Reduction of quality
(RoQ) attacks on Internet end-systems,Proceedings of the Twenty-Fourth
Annual Joint Conference of the IEEE Computer and Communications So-cieties, vol. 2, pp. 1362–1372, 2005.
[8] J. Hellerstein, Y. Diao, S. Parekh and D. Tilbury, Feedback Control of
Computing Systems, John Wiley, New York, 2004.
[9] A. Kuzmanovic and E. Knightly, Low-rate TCP-targeted denial-of-service
attacks: The shrew vs. the mice and elephants,Proceedings of the
Confer-ence on Applications, Technologies, Architectures and Protocols for Com-puter Communications, pp. 75–86, 2003.
[10] R. Lotlika, R. Vatsavai, M. Mohania and S. Chakravarthy, Policy schedule
advisor for performance management, Proceedings of the Second
Interna-tional Conference on Autonomic Computing, pp. 183–192, 2005.
[11] Y. Lu, T. Abdelzaher, C. Lu, L. Sha and X. Liu, Feedback control with queueing-theoretic prediction for relative delay guarantees in web servers,
Proceedings of the Ninth IEEE Real-Time and Embedded Technology and Applications Symposium, pp. 208–217, 2003.
[12] C. Lu, J. Stankovic, G. Tao and S. Son, Feedback control real-time
schedul-ing: Framework, modeling and algorithms,Journal of Real-Time Systems,
vol. 23(1-2), pp. 85–126, 2002.
[13] X. Luo, E. Chan and R. Chang, Vanguard: A new detection scheme for a
class of TCP-targeted denial-of-service attacks, Proceedings of the Tenth
IEEE/IFIP Network Operations and Management Symposium, pp. 507– 518, 2006.
[14] X. Luo and R. Chang, On a new class of pulsing denial-of-service
at-tacks and the defense, Proceedings of the Twelfth Annual Network and
Distributed System Security Symposium, 2005.
[15] X. Luo and R. Chang, Optimizing the pulsing denial-of-service attacks,
Proceedings of the International Conference on Dependable Systems and Networks, pp. 582–591, 2005.
[16] X. Luo, R. Chang and E. Chan, Performance analysis of TCP/AQM un-der denial-of-service attacks,Proceedings of the Thirteenth IEEE Interna-tional Symposium on Modeling, Analysis and Simulation of Computer and
Telecommunication Systems, pp. 97–104, 2005.
[17] A. Robertsson, B. Wittenmark, M. Kihl and M. Andersson, Design and evaluation of load control in web-server systems,Proceedings of the
Amer-ican Control Conference, vol. 3(30), pp. 1980–1985, 2004.
[18] H. Sun, J. Lui and D. Yau, Defending against low-rate TCP attacks: Dy-namic detection and protection,Proceedings of the Twelfth IEEE
Interna-tional Conference on Network Protocols, pp. 196–205, 2004.
[19] M. Welsh and D. Culler, Adaptive overload control for busy Internet servers,Proceedings of the Fourth USENIX Symposium on Internet
Tech-nologies and Systems, p. 4, 2003.
[20] R. Zhang, C. Lu, T. Abdelzaher and J. Stankovic, Controlware: A middle-ware architecture for feedback control of softmiddle-ware performance,Proceedings of the Twenty-Second International Conference on Distributed Computing
![Figure 2. Effect of one attack pulse at t = 0 on α(t) and ρ(t) (A = 0.00267, B = 0.2, C = 0.024, D = −1.4, ℓ = 75, K = 0.01, µ = 90, ρ ∗ = 0.7 (from [7])).](https://thumb-us.123doks.com/thumbv2/123dok_us/8706592.2356727/6.918.303.614.162.357/figure-effect-attack-pulse-α-ρ-b-ℓ.webp)