There is a few of design concepts of the 200 kW capacity propeller engine test bench presented in the paper. Modes and frequencies of vibrations of each design concept are presented. It is done in order to choose the best structural solution for real vibration characteristics of the airplane engine-propeller unit.
Keywords: propeller engine test bench, propeller vibration, digital modelling, CAD, con-struction
1. Introduction
The paper concerns the prototype of a propeller engine test bench stand designed for durability tests of airplane piston engines of 150-250 kW power range (Ostapski, 2011b, 2008). The technical data of the prototype engines to be tested on the bench have been adopted. It is obvious that at the beginning of the design process there is no information about the vibration spectrum of the propeller shaft, which is at the production process at that time. The basic 3D model of test bench constructional variants are presented in the article. Modes and frequencies of free vibrations are defined in ANSYS environment for both the loaded and unloaded structure and for various design variants. The estimated vibration frequency range for the propeller shaft varies from
f = 22 to f = 360 Hz. In such a case, there is no easy way for rational test bench construction to be completely “untuned” to the vibration forcing load. This is the reason for introducing the basic model and few its modifications. After first engine tests, it should be possible to separate natural vibrations of the bench and high amplitude vibrations of the engine.
2. Basic model of the propeller engine test bench
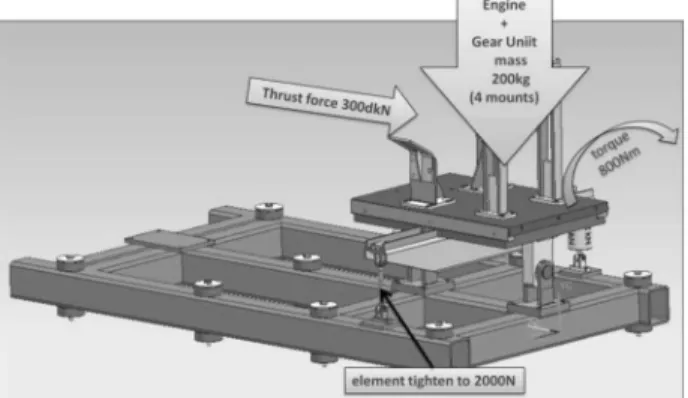
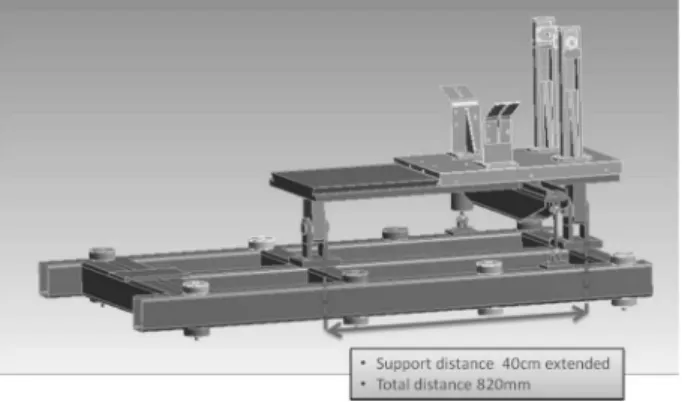
The design of the test bench should provide stable fixing of the airplane engine together with a speed reduction unit and the propeller. The measurement of torque is to be done by making use of a pendulous fixing of the main platform and a strain gauge load cell mounted to the extension arm. The measurement of the thrust force is to be done by the strain gauge load cell placed between the platform extension arm and the axial regulation of the support platform. The engine mounting platform consists of the base and support that allow for an axial movement and measurement of the thrust force simultaneously with measuring the reaction torque. The engine and reducing gear assembly are mounted on four rubber cushions. The basic 3D model is presented in Fig. 1. The FEM (finite element method) model (Rakowski and Kacprzyk, 1993) and the network is presented in Fig. 2. The test bench model with the engine of nominal load
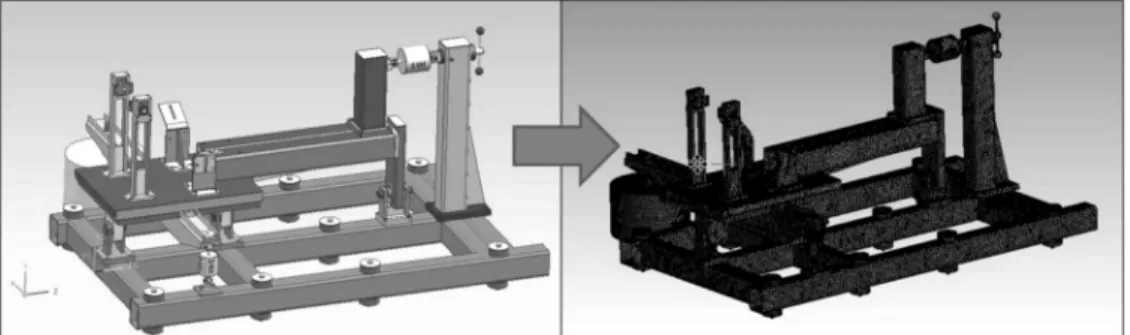
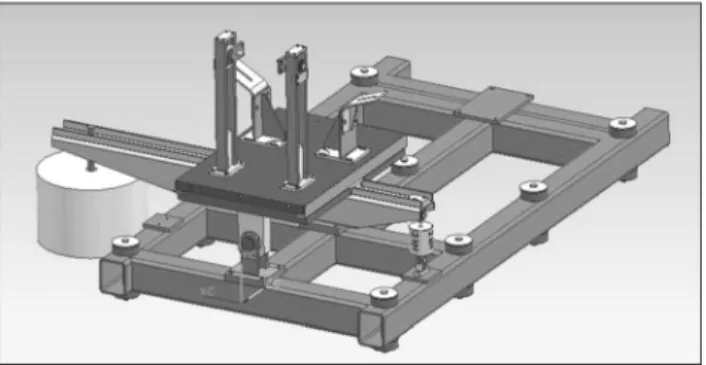
Fig. 1. 3D basic test bench model
Fig. 2. FEM model of the test bench consisting of 100 000 nodes and 250 000 elements
Fig. 3. Mechanical load from the engine at nominal torque, 800 Nm
3. Natural frequencies of the propeller engine test bench
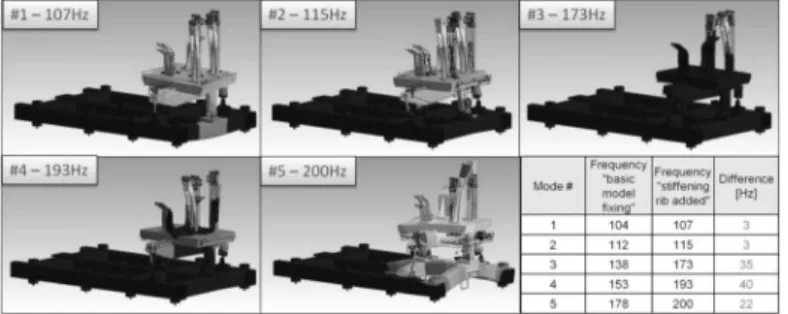
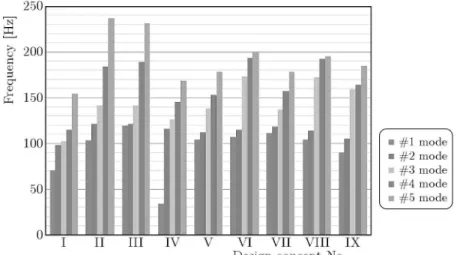
The modes and frequencies of the basic model are presented in Fig. 4. The remaining nine other design variations are presented in Figs. 5-24. The main construction difference is partial or more complex structural rigidity of the bench variations. It is due to adding extra ribs, support members, variable distance between the platform supporting members, and by adding an inertial damper or tension bolts. It results in strong influence on the natural vibration frequencies comparing to the basic model. The results are presented in Fig. 10.
The decrease in the natural vibration of the loaded test bench is minimal for the basic model, as presented in Fig. 4. The decrease is by 1 Hz. The exceptional difference is the third vibration mode,which differs by 5 Hz .
Fig. 5. Design concept No. I
Fig. 6. Natural frequencies of design concept I
The additional ribs of the reducing gear support and the additional stiffening member in the platform extension arm resulted in an increase the vibration frequency by 30 Hz average, see Fig. 6.
The additional frame stiffening resulted in a 12 Hz frequency increase in the first vibration mode, see Fig. 10.
Variant No. III is the basic model with an extra mass hanged as shown in Fig. 11. The first five vibration modes are vibrations of this mass. Next modes are construction vibrations which are significantly lower than in previous variants I and II, especially for the 6th mode.
In variant IV (Fig. 11) the extension arm and support (with the thrust force measurement unit) are disassembled. Nothing has changed in comparison to results of model III. But while loaded, the frequencies of vibration modes 7-10 (Fig. 10) significantly increased.
There is practically no change in the 6th vibration mode frequency, while the first five modes are strictly related to the extra mass added.
The equivalent mass has been replaced by a tensioning bolt, see Fig. 12. The values of the first three vibration modes are similar to those of models I and II. But the frequencies of the 4th and 5th mode are lower by 40 and 50 Hz, see Fig. 10.
Fig. 7. Design concept No. II
Fig. 8. Design concept No. II – natural frequencies, no load
Fig. 9. FEM model, design concept No. III, 250 000 elements
Fig. 11. Design concept No. IV (simplified No. III)
Fig. 12. Design concept No. V
Fig. 13. Design concept No. VI
Fig. 15. Design concept No. VI – natural frequencies, nominal load
The additional ribs on the reducing gear fixing side (Fig. 7) resulted in an increase in the vibration frequency by few Hz for the first two vibration modes, and up to 25-35 Hz for higher modes comparing to variant V, see Fig. 15.
The stiffening of the frame with ribs at the platform support fixings (Fig. 16) resulted in an increase by a few Hz of the first two vibration modes (Fig. 18). Three higher mode frequencies decreased by 25-30 Hz comparing to variant VI.
Fig. 16. Design concept No. VII
Fig. 17. Design concept No. VII – natural frequencies, no load
Fig. 19. Design concept No. VIII (design concept No. VI with an enlarged support distance)
Fig. 20. Design concept No. VIII – natural frequencies, no load
The increasing distance of the platform supporting members (Fig. 19) has no influence on the first mode vibration frequency and minimal influence on the second mode. But frequencies of the 3rd and 4th vibration modes moved by more than 30 Hz toward higher values. The 5th mode frequency increased by 17 Hz (Fig. 21).
Fig. 21. Design concept No. VIII – natural frequencies, nominal load
Fig. 23. Design concept No. IX – natural frequencies, no load
Fig. 24. Design concept No. IX – natural frequencies, nominal load
4. Conclusion
The presented design variations except for No. III and IV have significantly higher (by at least 30-40 Hz) natural vibration frequencies compared to the basic test bench model. For the first torsional vibration mode: in the basic model and variants I, II, V, VI. For the first transverse vibration mode – in models VII, VIII. In models III, IV, the first five vibration modes of very low frequency are vibrations of the additional mass.
The test bench is dedicated for the prototype engine of N = 200 kW, turbocharged with indirect fuel injection with the working range: n= 2800-5400 rpm (Ostapski, 2008).
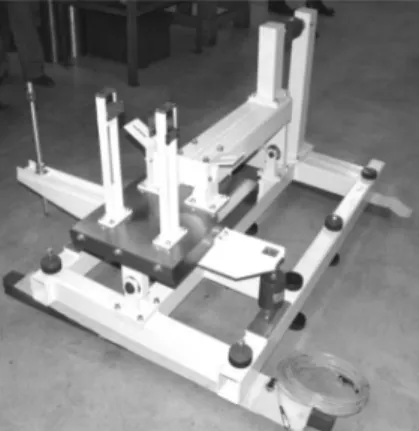
Fig. 26. The engine test bench ready for a practical test
This range has been estimated according to the previous experiences in the research of multi cylinder airplane engines (Ostapski and Ponder, 2004; Ostapski 2011a). The most important are the first four vibration modes of the 4th cylinder as well as the first four vibration modes of the propeller shaft. The mentioned range should be extended downwards for measurements of the engine with one nonworking cylinder. For the presumed working speed range andgear ratio of the reducing geari= 2.1, the frequency range should be 22-360 Hz. The first harmonics of the propeller shaft for speed n = 2800 rpm is f1 = n/60 = 46.67 Hz, the fourth for speed
n = 5400 rpm is f4 = 4n/60 = 360 Hz. The first “propeller” harmonic frequency is: f1s =
n/60i = 2800/(2.1·60) = 22.2 Hz and the fourth one is f4s= 4·f1s= 88.8 Hz. Accordingly, for the “take off” engine speed, the first harmonic frequency of the propeller shaft is f1s = 5400/(2.1 ·60) = 42.85 Hz and the fourth is f4s= 4·f1s = 171.4 Hz. Half speed frequencies may also appear. Various torsional rigidity of engine crankshafts, reducing gear, propeller shaft assembly, various values of gas pressure inside the cylinder and the propeller characteristic curve have significant influence on the vibration spectrum. It is very likely that torsional vibrations of the drive train with significant amplitudes will appear at the frequency rangef = 22-360 Hz. For a particular engine, it will be also function of the rotation speed, load, and the combustion process control parameters. Analysis of simulation of vibration modes made on the test bench model using the FEM method shows difficulties with the “out-tuning”(avoiding mechanical resonance at all natural frequencies) of the test bench and engine torsional vibration frequencies in the operational range of the unit. The presented design variants (Fig. 19) may be a good way for “out-tuning” the test bench vibration frequencies of maximum amplitudes after first practical tests of the airplane drive assembly.
References
1. Ostapski W., 2008, New generation, high output (200kW), multifuel, environmental friendly, aircraft reciprocating engine – design and development (in Polish), Development project report number 6ZR62008C/07057
2. Ostapski W., 2011a, Analysis of thermo-mechanical response in an aircraft piston en-gine by analytical, FEM, and test-stand investigations, Journal of Thermal Stresses, 34, 285-312