VALIDATION OF THE COMPAS RISK
ASSESSMENT CLASSIFICATION INSTRUMENT
Prepared for the
Broward Sheriff’s Office
Department of Community Control
September 2010
Prepared by: Thomas Blomberg William Bales Karen Mann Ryan Meldrum Joe NedelecCenter for Criminology and Public Policy Research College of Criminology and Criminal Justice
Florida State University Tallahassee, Florida
Table of Contents
Literature Review: Risk Assessment Tools in Criminal Justice 1
Introduction 1
Recent History of Risk Assessment in Criminal Justice 2
Risk Assessment and Pretrial Decision-making 4
Research on the Validity of Risk Assessment Tools 6
Pretrial Risk Assessment Tools 8
COMPAS Risk Assessment Tool and Validation Studies 10
The COMPAS System 13
COMPAS Instrument Scales 14
Use of COMPAS in Broward County 15
Risk Classification in BSO Jails 18
Validation of the COMPAS Instrument 18
Validation Methodology 19
Data Sources 19
The COMPAS Validation Dataset 21
Analytic Techniques 24
Validation Sample Population: Demographic Characteristics 26
COMPAS Validation: Results and Findings 31
Introduction 31
COMPAS and Recidivism: Rearrest for Any Offense 32
COMPAS and Recidivism: Rearrest for Any Offense by Sex 37
COMPAS and Recidivism: Rearrest for Any Offense by Age Groups 39
COMPAS and Recidivism: Rearrest for Any Offense by Race/Ethnicity 42
COMPAS and Recidivism: Rearrest for Any Offense by Offense Type 45
COMPAS and Violence: Rearrest for a Violent Crime 48
COMPAS and Violence: Rearrest for a Violent Crime by Sex 53
COMPAS and Violence: Rearrest for a Violent Offense by
Race/Ethnicity 59
COMPAS and Violence: Rearrest for a Violent Offense by Offense
Type 62
COMPAS and Failure to Appear (FTA) 66
COMPAS and FTA: Offenders Who Failed to Appear by Sex 70
COMPAS and FTA: Offenders Who Failed to Appear by Age Groups 73
COMPAS and FTA: Offenders Who Failed to Appear by
Race/Ethnicity 76
COMPAS and FTA: Offenders Who Failed to Appear by Offense Type 79
COMPAS’s Individual Scores and Thresholds: Validating the Ten
Risk Assessment Scores 82
COMPAS Risk Scores and Recidivism: Rearrest for Any Offense 83
COMPAS Risk Scores and Violence: Rearrest for a Violent Crime 85
COMPAS Risk Scores and Failure to Appear 87
Summary and Conclusions 89
LITERURE REVIEW:
Risk Assessment Tools in Criminal Justice
Introduction
Risk assessments of offenders and offender classifications are important tools for judges, jail and prison administrators, and pretrial service departments. Within the field of criminal justice, risk assessments and offender classifications are utilized in a number of ways, including pretrial decision-making regarding detention/release and bail setting, determining the conditions of community supervision for individuals on probation and parole, and the proper placement of offenders in state and federal prisons with
appropriate levels of security. With the advent of the information age and computer technology, risk assessment has undergone a significant transformation from a process that was based on subjective evaluations made by judicial officers to one that is largely objective in nature, based on theoretically informed, standardized statistical methods.
The purpose of this review is to provide an overview of the use and evolution of risk assessment tools in the field of criminal justice, with particular attention given to risk assessment in the context of pretrial decision-making. It begins by providing an account of the recent history of risk assessment within the field of criminal justice, tracing its development from the middle of the twentieth century to its current state at the beginning of the twenty-first century. Next, attention is given to the use of risk assessment tools in the context of pretrial decision-making. Following this, an overview of the research pertaining to the predictive validity of risk assessment tools will be presented, including previous assessments of the COMPAS instrument.
Recent History of Risk Assessment in Criminal Justice
A number of researchers have commented on and provided reviews of the development of risk assessment within the field of criminal justice over the last 50 years (e.g. Andrews, Bonta, and Wormith, 2006; Brennan, Dieterich, and Ehret, 2009;
Campbell, French, and Gendreau, 2009; Fass, Heilbrun, Dematteo, and Fretz, 2008). According to researchers in this area of research there are four major “generations” of risk assessment. First generation risk assessment and offender classification, which arose during the middle of the twentieth century, was based on unstructured clinical judgments of risk that were prone to error and bias and lacked statistical calculations of risk
(Campbell et al., 2009; Grove, Zald, Lebow, Snitz, & Nelson, 2000). In other words, decisions pertaining to bail setting and the choice to detain an arrestee or release
defendants on recognizance pending trial were based on “best guess” assessments made by judicial officers of the risk a particular person posed to the community.
In light of the limitations of relying solely on human judgment to assess risk, second generation risk assessment tools made use of additive point scales (Austin, 1983; Gottfredson, 1987; Hoffman, 1994) comprised of items relating to such things as criminal history and mental illness diagnoses (Campbell et al., 2009). Thus, these second
generation tools provided the early foundations for more standardized risk assessment tools that were to follow by incorporating into the risk assessment process quantifiable measures of risk. Despite this important advancement, second generation tools were criticized on the grounds that they were largely devoid of theory, and the relative importance of factors (the weights assigned to different factors) included in such risk
assessment tools was still established by professional consensus rather than through statistical methods (Brennan et al., 2009).
The advent of third generation risk assessment tools improved upon second generation tools by not only making use of standardized, quantitative risk calculations, but also by incorporating theoretically driven factors, particularly those pertaining to social learning theory (Andrews et al., 2006; Brennan et al., 2009). In addition, whereas second generation risk assessment tools only emphasized the need to predict risk, third generation tools also sought to identify criminogenic needs that could be targeted for change as a means of reducing risk (Andrews et al., 2006; Bonta, 2002). Nonetheless, though, third generation tools were criticized for being too theoretically narrow and failing to address such things as gender sensitivity (Andrews et al., 2006; Brennan et al., 2009).
The current generation of risk assessment instruments, termed fourth generation, address a number of the issues with older generation risk assessment tools, and moreover, are specifically designed to be integrated into not only the process of risk management, but also the selection of intervention modes and targets for treatment, as well as the assessment of rehabilitation progress (Andrews and Bonta, 2007; Andrews et al., 2006). Examples of these fourth generation instruments, according to Campbell and colleagues (2009; see also Fass et al., 2008) include the Level of Service/Case Management
Inventory (LS/CMI; Andrews, Bonta, and Wormith, 2004), the Violence Risk Scale (VRS; Wong and Gordon, 2006); the Correctional Offender Management Profile for Alternative Sanctions (COMPAS, Brennan and Oliver, 2000), and the Correctional
Assessment and Intervention System (CAIS, National Council on Crime and Delinquency, 2004).
In contrast to third generation tools, which were largely theoretically guided by social learning theory, fourth generation tools are multi-theoretical in content. Moreover, many of the fourth generation tools are uniquely calibrated to take into account the gender of the offender. As a result, fourth generation risk assessment tools have the potential to be the best risk assessment tools currently available for criminal justice practitioners. They provide significant improvements over earlier risk assessment tools by not only incorporating gender-specific calibrations, but also by incorporating multi-theoretical factors that can be used to assess risk and establish individualized need for multiple processes within the criminal justice system.
Risk Assessment and Pretrial Decision-making
Pretrial decision-making involves a fundamental tension between the court’s desire to protect citizens from dangerous criminals, ensure that accused individuals are judged before the law, and minimize the amount of pretrial punishment meted out to legally innocent defendants (Clark and Henry, 1997). Whether a defendant is released in the pretrial stage of a case and the setting of the bail amount depend primarily on two considerations: the perceived safety risk that the defendant poses to the community (the potential to commit another offense while awaiting trial) and the perceived likelihood that the defendant will return for future court appearances.
In the past, the exercise of judicial discretion has long been at the heart of the pretrial release/detention decision (Gottfredson and Gottfredson, 1990; Walker, 1993).
However, the effects of judicial officers’ exercise of discretion in this area has begun to be questioned (Mahoney, Beaudin, Carver, et al., 2001), as pretrial release decisions are often made with incomplete information (Albonetti, 1989). An example of the potential consequences that can occur is evidenced by recent research on pretrial decision-making, which indicates that there are significant racial and ethnic disparities in pretrial release decisions and outcomes (Demuth, 2003).
In response to these issues, the use of objective guidelines or criteria (i.e.
standardized risk assessment tools) for pretrial decision-making has been recommended by, among others, the American Bar Association (2002) and the National Association of Pretrial Services (2004). By providing reliable information to courts, pretrial programs can enhance the ability of judicial officers to make fair, equitable, and effective pretrial release/detention decisions (Mahoney et al., 2001), and the use of standardized risk assessment tools such as the LS/CMI, COMPAS, and CAIS can enhance this process. Empirically and theoretically based risk assessment tools can not only serve to minimize subjective personal biases that exist in pretrial decision-making, but can also help to improve the placement of individuals for treatment and public safety, protect courts against legal scrutiny, and improve the allocation of resources (Andrews and Bonta, 2007; Latessa and Allen, 2003).
A similar observation was made by VanNostrand (2003), who stated that by efficiently assessing and releasing defendants who pose little danger to the public or are likely to comply with court dates, the process upholds and affirms the arrestee’s
constitutional protections and minimizes the infringement of their day-to-day lives. This is particularly important, as research finds that defendants who are not released at the
pretrial stage are more likely to become disconnected from family, friends, health providers, and post adjudication employment opportunities (Irwin, 1985; LaFree, 1985). Furthermore, for jails, releasing low-risk arrestees frees previously occupied bed space in a jail system that is nearing capacity.
Despite the recommendation by several organizations involved with the pretrial process to make use of objective risk assessment tools for pretrial decision-making, the most recent survey of pretrial services programs by the U.S. Department of Justice (Clark and Henry, 2003) found that less than one in four pretrial programs rely exclusively on objective criteria when making decisions such as the setting of bail. In light of research indicating that objective risk assessment tools are better predictors of failure to appear and re-arrest than the use of subjective risk assessment strategies (Grove et al., 2000; Levin, 2008), the finding that a minority of pretrial services programs utilize purely objective risk assessment strategies is a major policy concern. It should be noted, however, that since the time that the study by Clark and Henry (2003) was conducted, it is possible that the use of objective risk assessment instruments has increased.
Research on the Validity of Risk Assessment Tools
A review of the empirical literature on risk assessment tools documents two important findings that are of central importance to the evaluation of the COMPAS risk assessment tool for pretrial decision-making in Broward County. First, a recent meta-analysis of 88 studies that examined the predictive validity of various risk assessment instruments and methodologies indicated that fourth generation risk assessment tools produced the strongest predictive estimates for violent recidivism (Campbell et al., 2009).
Given the earlier discussions pertaining to the benefits accrued from using fourth generation risk assessment methodologies rather than earlier generation risk assessment instruments, this should not be too unexpected, but is important to note. At the same time, it must be emphasized that the study by Campbell and colleagues (2009) only evaluated tools based on the outcome of recidivism and not pretrial decision-making.
The fact that the meta-analysis by Campbell et al. (2009) was limited to the predictive validity of risk assessment tools using recidivism as the outcome leads to the second observation to be made upon a review of the empirical risk assessment research. Specifically, in contrast to the vast number of studies that have examined the use of risk assessment tools for predicting recidivism, there have been few multi-site, racially diverse, empirically validated pretrial assessments for use in the United States
(Lowencamp, Lemke, and Latessa, 2008). A similar observation was made in a 2001 NIJ Report (Mahoney et al., 2001), finding that, with the exception of research on pretrial release guidelines, there has been very little empirically grounded research on pretrial release/detention decision-making practices and outcomes since the mid 1980s. Levin (2008) suggests several reasons as to why there are so few studies that examine pretrial decision-making. In particular, Levin notes that there is: limited information on
defendants kept in a standardized manner across counties, a lack of centralized
accounting of pretrial supervision practices, and a lack of in-house analytical capability among most pretrial agencies. With these considerations in mind, the following section reviews findings from recent studies of pretrial risk assessment instruments.
Pretrial Risk Assessment Tools
The first pretrial screening program was created by the Vera Institute in 1961, and was known as the Manhattan Bail Project (Lowencamp et al., 2008). Factors incorporated into this early risk assessment included: defendant ties to the community, employment status, education, and prior criminal record. Since that time, pretrial risk assessment tools, as with the larger class of risk assessment tools discussed earlier, have grown in
complexity, with regard to both the factors included in the instruments as well as the statistical methodologies employed. For example, in 2003 the Urban Institute Justice Policy Center developed and validated a risk assessment tool for defendants in Washington, D.C. (Winterfield, Coggeshall, and Harrell, 2003). The instrument was comprised of 22 items in two separate subscales: one used to predict the risk of offending on release, the other to predict failure to appear. The results of the study found that criminal history, current criminal charge, and drug involvement/testing were significant predictors of both outcomes.
As an additional illustration, VanNostrand (2003) developed a risk assessment tool for pretrial defendants in Virginia that included nine different risk factors: charge type, pending charges, outstanding warrants, criminal history, prior failure to appear, prior violent convictions, length at current residence, employment, and drug abuse. VanNostrand (2003) used this information to create a risk factor scale from 0-10. Using these scores, VanNostrand found a significant relationship between an individual’s risk factor score and a combined outcome measure of failure to appear/new arrest. The findings of the study were quite revealing, and provided evidence of the predictive
zero failed to appear or were re-arrested, whereas 62% of individuals with a risk factor score of seven did so.
In one of the most current and complex risk assessment tools developed specifically for pretrial decision-making, Lowencamp et al. (2008) validated a pretrial screening tool that included a number of theoretical constructs to predict both failure to appear and new offenses on release pending sentencing. Demonstrating the general trend in risk assessment tools to increase in complexity and incorporate a wide variety of empirically and theoretically relevant factors, the tool developed by Lowencamp et al. (2008) included 63 items covering eight different theoretical risk and need domains. These included criminal history, pretrial supervision, drug/alcohol use, employment, residence/transportation, mental health, antisocial personality characteristics, and a scale measuring criminal associates. The results of the validation study found that the overall pretrial assessment score was found to be significantly correlated with both failure to appear and new arrest.
Together, these studies demonstrate that, as with risk assessment tools used to predict other criminal justice outcomes such as recidivism, the risk assessment instruments recently developed to predict pretrial defendant outcomes have grown in sophistication. They not only have incorporated factors from a variety of life
circumstances and criminological theories, but often create unique risk scores for failure to appear and new arrests separately. The information in this section and previous sections provides a foundation for discussing the COMPAS risk assessment tool and the studies that have evaluated it predictive validity. As will become evident, the factors included and the outcomes considered by the COMPAS closely resemble, and in some
cases go beyond, the factors that have been included in the risk assessment tools discussed earlier. Another added benefit of providing information on studies that have examined the predictive validity of the COMPAS system is that these studies compare the validity of the COMPAS to other fourth generation risk assessment tools.
COMPAS Risk Assessment Tool and Validation Studies
According to Andrews et al. (2006), the COMPAS is one of the best known fourth generation risk assessment instruments currently being utilized. As with other fourth generation risk assessment instruments, the COMPAS can be used to predict a variety of outcomes, and provides separate estimates for violence, recidivism, failure to appear, and community failure. Also similar to other fourth-generation tools, the COMPAS is both guided by theory (e.g. social learning theory, low self-control theory, strain theory, and social control theory) and provides gender specific calibrations.
When a comparison is made between the factors that the COMPAS takes into account and those included in other previously discussed pretrial risk assessment tools, the COMPAS not only includes the factors that appear in other instruments, it exceeds them by taking into account social isolation, leisure time, and family criminality. In total, the COMPAS includes 15 different factors, each of which is measured using multiple-item scales. Approximately one-third of the information incorporated into the COMPAS instrument is collected from official records, one-third from self-report questions that are answered by defendants/inmates, and one-third from an interview with the
In support of the validity of the COMPAS, peer-reviewed research conducted by both the researchers who developed the COMPAS (i.e. Brennan et al., 2009) and others within the field of criminal justice (e.g. Fass et al., 2008) provides evidence that the COMPAS tool has as much predictive validity as other major risk assessment instruments currently being used (e.g. LSI-R). It is particularly important to point out that in cases in which risk assessment instruments have been developed by for-profit companies that external validation of risk assessment tools is critical. The research cited above provides this need. Even in the case in which the COMPAS developers provided an evaluation of the predictive validity of the tool, the article went through an external, anonymous peer review to ensure quality in the analyses that were presented.
Although the available literature on the validity of the COMPAS legitimates its use, it is equally important to keep in mind that there appears to be no empirical literature validating its use for predicting pretrial failure to appear or re-arrest awaiting trial.
Although the literature provides evidence that, in general, the COMPAS is a sound risk assessment tool, it is nonetheless important to empirically validate the instrument in particular settings at particular times for particular purposes. Given that it is unlikely for a single instrument to have universal applicability, research suggests that an adopted
assessment should be piloted and validated on the jurisdiction implementing the tool, since the instrument or its classification scales may not be valid for the agency’s specific purpose (Gottfredson and Moriarty, 2006.). The validation being conducted by Florida State University on behalf of Broward County (as well as the current evaluation being carried out by the COMPAS developers in other locations) provides a crucial step in this
direction by providing information on the predictive validity of the COMPAS in the context of pretrial decisions and outcomes.
THE COMPAS SYSTEM
The COMPAS (Correctional Offender Management Profiling for Alternative Sanctions) is a statistically-based client assessment, classification, and case management system developed by the Northpointe Institute for Public Management. It is designed to assess key risk and need factors in correctional populations by utilizing information obtained through official records, standardized interviews with clients, and self-report questionnaire information provided by clients. In addition, the COMPAS provides decision-making support for criminal justice practitioners when placing clients into the community. Currently, the COMPAS system is being used by a number of correctional systems across the country to inform the decision-making process regarding pretrial release, probation, community corrections, institutional programming, reentry, and parole. To respond to the diverse needs of correctional systems, separate software
packages are available to take into account differences in risk levels and varying needs of young clients (COMPAS Youth) and female clients (COMPAS Women). COMPAS, as currently utilized in the Broward Sheriff’s Office, does not include unique calibrations for males or females.
The COMPAS system, which is fully web-based and Microsoft Windows
compliant, is tremendously flexible and allows for the customization of the risk and needs assessment instrument, providing users the ability to choose which aspects of the
COMPAS instrument are to be measured for the management of particular clients. The following section provides an overview of the different factors that are included in the risk and needs assessment instrument that makes up the core part of the COMPAS system.
COMPAS Instrument Scales
In order to make decisions regarding the risk potential and needs of individual clients, the COMPAS instrument is composed of 22 different scales that empirical research has identified as predictive of future behavior. The information that comprises each scale is obtained via self-report/interviews with clients and from official records. The 22 scales are grouped into five main categories, each of which contains multiple scales. Users have the ability to include all or a combination of the scales as needed. The following section provides an overview of the five assessment categories that compose the COMPAS instrument.
Criminal Involvement
The criminal involvement category is composed of four scales: criminal
involvement, history of non-compliance, history of violence, and current violence. Information for the criminal involvement category is collected from official records and records pertaining to current charges.
Relationships/Lifestyle
The relationships/lifestyle category is composed of five scales: criminal
associates/peers, criminal opportunity, leisure and recreation, social isolation, and substance abuse. The information for these scales is provided by inmates via interviews with correctional systems staff members and/or self-reports.
Personality/Attitudes
The personality/attitudes category is composed of six scales: criminal personality,
negative social cognitions, criminal thinking observation, criminal thinking self-report, anger/violence, and a cognitive behavior scale. The information for these scales is
provided by inmates via interviews with correctional systems staff members and/or self-reports.
Family
The family category is composed of two scales: family criminality and
socialization failure. The information for these scales is provided by inmates via interviews with correctional systems staff members and/or self-reports.
Social Exclusion
The social exclusion category is composed of five scales: financial problems,
vocational/educational profile, social environment, residential instability, and social adjustment problems. The information for these scales is provided by inmates via interviews with correctional systems staff members and/or self-reports.
USE of COMPAS in BROWARD COUNTY
Administration of the COMPAS instrument in the Broward County Sheriff’s Office (BSO) began in May 2008 and is currently being utilized by three entities within BSO’s Department of Community Control: (1) Pretrial Services Division (PSD), (2) the Day Reporting and Reentry Division (DRRD), and (3) the Probation Division of the Broward County Sheriff’s Office. In these three Divisions, COMPAS is used to perform a risk assessment for the purpose of determining the appropriate level of supervision for each client. Also, in Probation and DRRD, COMPAS is used to perform a needs assessment to determine social service referrals for the client. The assessment of the COMPAS instrument being conducted by FSU only applies to the COMPAS risk assessment performed by the Pretrial Services Division to provide information to the
court for the initial determination of pretrial release or incarceration. Specific to the Pretrial Services Division, risk assessment and administration of the COMPAS instrument is conducted at the time of arrest for the majority of clients on the first appearance hearing docket or post magistrate with advanced notice by the court.
COMPAS is administered at the main jail location for the first appearance hearing. After first appearance hearing and a trial division judge is assigned, the COMPAS instrument is administered in the main pretrial offices and subsequently taken to the courtroom when given advanced notice of the bond hearing. There are forty trial division judges that could possible call for this. The Risk Assessment Unit of the Pretrial Services Division utilizes a number of COMPAS instrument scales to aid in pretrial release decisions: criminal involvement, history of non-compliance, history of violence, current violence, residential instability, substance abuse, education, and vocational. Approximately half of this information is entered into the COMPAS system using official data reports. The remainder of the information is collected through the standardized interview procedure with clients by Risk Assessment Unit staff.
At the time of this assessment, BSO devoted approximately sixteen staff members to conduct COMPAS interviews. Each interview takes approximately twenty minutes to complete including the inmate interview, and criminal and driving record tasks.
Information that clients provide but cannot verify is checked by staff post-interview. Staff work in three shifts weekdays and weekends, and interviews are conducted at 10:30 a.m., 11:30 p.m., 2:30 a.m., and 4:00 a.m. daily. Through discussions with BSO officials, a number of impediments were identified that limit the number of clients for which COMPAS can be administered and, therefore, on which there is available COMPAS data:
shift changes; jail lockdowns; physical limitations; physical space (the jail was not
designed to accommodate this purpose and therefore all inmates require a deputy to guard and move the inmate for security purposes); offenders may be impaired, violent, or otherwise unable to respond to questions; jail bookings are conducted at four locations (the main jail and three satellite booking facilities); Pretrial staffing is sufficient to cover the main jail only; and jail personnel turnover. Additionally, certain individuals are excluded from COMPAS administration: clients with severe medical and mental health issues who are transported to another jail for care, some females who are transported to the female jail, clients who refuse to be interviewed, individuals with very low bond amounts who are likely to bond out, and individuals who are given notices to appear (NTA) and released by the booking desk prior to First Appearance Hearings.
According to the Department of Community Control’s protocol, clients of the Pretrial Services Division are assigned specific supervision requirements based upon decisions made by Judge John Hurley, which are guided, in part, by the risk scores assigned to clients based on the COMPAS instrument. While the COMPAS instrument has been administered to clients since May 2008, Judge Hurley was appointed as the First Appearance Judge and began receiving COMPAS risk scores in March, 2009 and it is difficult to determine the degree to which the judge relies upon or utilizes the COMPAS scores for judicial pretrial decision making.
Risk Classification in BSO Jails
Using the information collected through client interviews and official records, the COMPAS system provides risk levels for three outcomes: risk of violence, risk of
recidivism, and risk of failure to appear, with possible scores ranging from one to ten. The scores are coded such that higher values represent a greater potential for a client to present a risk to the community and/or less likely to adhere to the requirements set forth by probation or reentry departments. Specific to the Pretrial Services Division of Broward County, clients who have a combined risk score from one to five (combining three scores) are required to report “in person” every other month and call in weekly; clients with a combined score between six and seven are required to make multiple contacts on a weekly basis with a case management specialist and must also report “in person” once per month and call in two times per week; clients with a combined score between eight and ten are recommended for placement on electronic monitoring.
Validation of the COMPAS Instrument
The subsequent sections of this report include: details of the methodology used to validate the COMPAS instrument in its ability to predict future recidivism, future
violence, and failing to appear at court hearings; report the outcomes of the analysis; and summarize the findings.
VALIDATION METHODOLOGY
The methodology section of this report provides the following information: a description of the data sources for the COMPAS risk assessment validation, a description of the techniques employed to construct the research dataset from multiple sources of data, a list of the variables included in the analysis, and a description of the analytic techniques employed.
Data Sources
The data used to conduct the validation study of the COMPAS risk assessment instrument was extracted from the Broward Sheriff’s Office (BSO) Jail Management System (JMS). The FSU research team worked closely with information technology staff with the BSO to gain a thorough understanding of the data available in the JMS and to develop a request identifying the jail population and process data to be extracted from the JMS. Based on these discussions, FSU submitted requests for the data described below.
1. Booking Data - All jail booking records from January 2009 through June 22, 2010 (the date the data was extracted) was obtained. This file included 223,045 records that contained the first, middle, and last name of the arrestee, a variety of demographic characteristics, date of booking, charging
information, bond amount, and other relevant measures. Additionally, the JMS identification number (JMS Number) was provided, which is a unique number assigned to each unique booking event and the Offender Control Number, which is a unique number assigned to each new arrestee and included in records associated with all subsequent booking events for the
same individual. The booking file contains a record for each arrest charge for each JMS Number. Using the JMS Number, the records in this file were subsequently unduplicated to obtain one record per booking event; after unduplicating the file, it contained 94,253 records.
2. Release Data - Release records for all offenders released from jail between January 2009 and June 22, 2010 (the date that the data was extracted) were provided to the FSU Team. This release file contains the same information as the booking file but also includes the date of jail release and the type of release.
3. COMPAS Data – Data relating to COMPAS risk assessments conducted by pretrial personnel are stored in the JMS. Data on all COMPAS risk
assessments conducted in calendar year 2009 were extracted by BSO’s
information technology staff, which included 28,224 records. For each unique COMPAS assessment identification number, the data supplied includes three records, a record for each of the three classifications of risk: recidivism, violence, and failure to appear. FSU created a dataset that resulted in one record per unique COMPAS assessment identification number and included separate variables for each data element related to the three COMPAS risk assessment categories. This resulted in a dataset with 9,408 records. These data included variables such as first, middle and last name; offender
demographic characteristics; date of the COMPAS assessment; risk score from 1 to 10 for each of the three risk categories; and risk score range (low (1–4), medium (5–7) or high (8–10) for each risk category.
4. Failure to Appear (FTA) Data – From the JMS, the BSO extracted a dataset of all FTA events that occurred between January 1, 2009 and July 30, 2010. The July 30, 2010 data. This dataset contained 26,733 records and the data
elements include the FTA date; first, middle and last name; and date of birth. An important caveat with regard to the FTA data is that the data files did not allow FSU to determine if the court hearing for which the FTA occurred was linked to the offense which caused the offender to be included in the dataset. In other words, the FTA could be for a court hearing that was related to a separate offense that occurred prior to the offense for which the offender was included in the booking data set (and, subsequently, included in the current study).
The COMPAS Validation Dataset
The process to build the comprehensive dataset necessary to validate the
COMPAS risk classification instrument required is described in this section. First, all jail bookings that occurred in 2009 were selected. Second, this file was matched to the jail release file using the JMS number to capture the first jail release subsequent to the booking date. Third, this file was matched to the COMPAS data file. The latter data file does not include the JMS number, therefore, it was necessary to use offenders’ names, dates of birth, booking dates, and COMPAS assessment dates to match records in the booking/release dataset to the COMPAS dataset. Various combinations of first name, last name, DOB, and booking date in varying degrees of proximity to the COMPAS assessment dates were examined to determine that best algorithm to ensure accurate
matches across the two data sources. Specifically, if the last and first names matched in both files, or the last name and date of birth matched, and the COMPAS assessment date was within 31 days of the booking date, the records were considered to be matched and included. This file of matched records was then matched with the FTA dataset based on the criteria that the last and first names matched in both files or the last name and date of birth matched. Additionally, only FTA records in which the date of the FTA occurred subsequent to the offender’s jail release date were retained. This resulted in a final file for analysis purposes of 5,575 cases. The FTA dates for offenders included in this sample of cases occur post release from jail pretrial. However, this does not necessarily mean that the FTA was related to the charge or offense that led the offender to be included in this study. The FTA occurred subsequent to the offender’s jail release date but the court appearance for which the offender failed to appear may be related to an offense and arrest that occurred prior to the arrest represented in the booking file for this study.
The next step was to build two types of recidivism measures and a FTA measure: (1) whether offenders released from jail pretrial in 2009 were arrested for a subsequent crime, (2) whether offenders were arrested for a subsequent act of violence; or (3)
whether offenders failed to appear for a scheduled court appearance using predetermined periods of follow up (i.e., one month, two months, three months, six months, nine
months, and twelve months post release). An arrest for violence was defined based on the charge description in the booking data and included murder, manslaughter, sex offenses, robbery, assault, battery, or other crimes in which the description indicates a person was harmed or under the threat of bodily injury. When validating the capacity of
the COMPAS instrument to predict future behavior, it is important to ensure that the cases under examination have the same amount of time post release. That is one of the reasons why multiple follow-up periods were selected (i.e., one, two, three, six, nine, and twelve months). All cases considered in the one-month follow-up group were out of jail at least one month. And all cases in the three-month follow-up group were out of jail at least three months, and so on through the twelve-month group. These groups are not
mutually exclusive—cases may be counted in more than one category if the offender was
out of jail for at least that length of time and recidivated in the latter category. For example, offenders in the six-month up group are also in the three-month follow-up grofollow-up (because the offenders were out of jail for at least six months which
encompasses three months also but did not recidivate until the sixth month). Therefore, offenders in the twelve-month group may also be included in each of the shorter follow-up grofollow-ups. The following bulleted statements reflect the number of cases for each follow-up period:
One-month follow-up period n = 5,575
Two-month follow-up period n = 5,575
Three-month follow-up period n = 5,575
Six-month follow-up period n = 5,264
Nine-month follow-up period n = 3,993
Twelve-month follow-up period n = 2,518
The numbers in the six-month, nine-month, and twelve-month follow-up periods are not less because these offenders had fewer months post release to recidivate, the numbers are
reduced because offenders recidivated or failed to appear in court prior to six months, nine months, or twelve months.
Analytic Techniques
The analytic techniques used to validate the predictive accuracy of the COMPAS risk classification instrument were threefold. First, crosstabular analysis was conducted to generate the percentage of cases within each risk classification level (low, medium, and high) by each outcome measure (recidivism, violence, and FTA) within each follow-up period ( one month, two months, three months, six months, nine months, and twelve months). The next step involved calculating the differences in the percentages of
offenders who in each cell—by risk classification level (low, medium, high) by outcome measure (recidivism, violence, FTA) by follow-up period (various number of months). Finally, the analysis examined the percentage difference at each threshold—the cut-off point that distinguishes some as low risk compared to medium risk and medium risk compared to high risk.
Validating the predictive accuracy of the COMPAS risk classification instrument involved analyzing the percentage of offenders which COMPAS predicted would
recidivate, commit violence, or fail to appear for court compared with the actual number of offenders who recidivated, was arrested for the commission of a violent offense, and failed to appear for court across the six follow-up periods. Further, the analysis included comparing the differences in the percentage of actual outcomes (offenders who behaved as predicted) between risk level categories (i.e., low and medium; medium and high; low and high). This data is descriptive and provides a view of the predictive accuracy of
low/medium risk offenders compared with medium/high risk offenders, as well as low/high risk offenders. The prior empirical literature does not specifically address this analytic technique; however, it provides an additional piece of descriptive data to identify the percent difference in COMPAS’s predictive accuracy between risk categories.
Because this step is more exploratory, there is no directional expectation regarding the percent difference between low/medium risk and medium/high risk. That said, it would seem most desirable for the direction to reflect either a constant—the percentage
difference for low/medium similar to medium/high; or a greater percentage difference as the risk level increases (low/medium less than medium/high).
In addition, the analysis examined the percentage difference of actual outcomes (percentage of offenders who recidivated, committed violence, or failed to appear) at the thresholds between the three risk levels (low, medium, and high). This step generates insight into the rationale for the thresholds or cut-off points between low and medium risk and medium and high risk. If no statistically significant differences were found at the established thresholds, it would indicate that, perhaps, there are not meaningful differences between someone classified as low risk versus medium risk or medium risk versus high risk. The lack of statistically significant differences at the thresholds is particularly importance when an offender scores near the cusp of a level. The offender may score at the high end of medium risk or at the low end of high risk—which could result in a meaningful difference in release decisions. The thresholds between risk levels are important distinctions to make when assessing the risk level of offenders that result in pretrial personnel making recommendations to the judiciary. These distinctions can
provide further credibility to the instrument or undermine the integrity of its predictive capacity.
Validation Sample Population: Demographic Characteristics
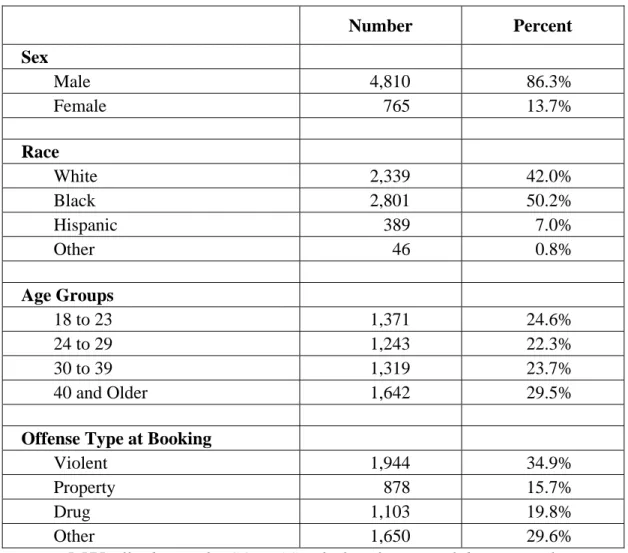
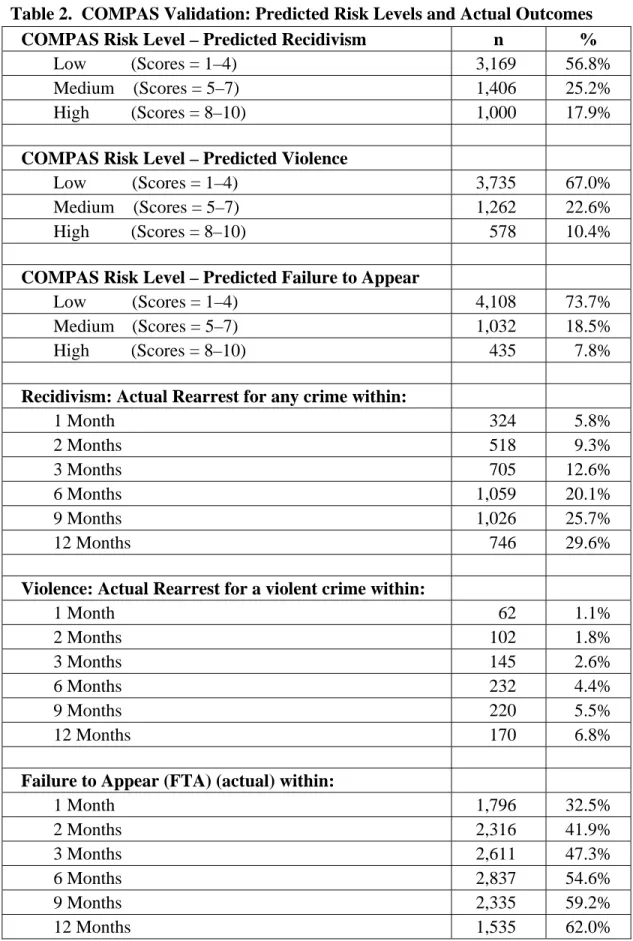
Tables 1 and 2 provide a snapshot of the characteristics of the sample of the 5,575 offenders that were included in the COMPAS risk classification validation. Table 1 presents the demographic characteristics of the offenders in the sample and Table 2 presents the number of offenders that COMPAS deemed to be low risk, medium risk, and high risk; Table 2 also presents the outcomes of the offenders (actual recidivism,
violence, FTA) by the six follow-up periods. As displayed in Table 1, the sample of offenders is comprised of 86.3 percent males (4,810) and 13.7 percent females (765). The relatively low number of females included in the sample represents the fact that females are underrepresented in the jail population as a whole and, therefore, would likely be underrepresented in this study. This will become a factor in the analysis when cross-tabulations are calculated that divide females by risk classification (low, medium, high) and by follow-up period (number of months). There will be cells where the number of females is insufficient to infer conclusions about the outcomes. In those cases, a symbol (g) is utilized to indicate that status. The race/ethnicity composition is 42 percent white, 50.2 percent black, and 7 percent Hispanic.
The sample of offenders was categorized into four age groups: 18 to 23 years (24.6%), 24 to 29 years (22.3%), 30 to 39 years (23.7%), and 40 and older (29.5%). The youngest offender in the sample was 18 years of age and the oldest was 76 years of age. The ranges for the four age groups were determined to allow for sufficient numbers in
each grouping for the purpose of the analysis. Table 1 also identifies the number of offenders who were booked for violent offenses, property offenses, drug offenses, and other offenses (traffic, probation violations, municipal/city ordinance violations, etc.). If multiple charges existed, the data represents the most serious charge for which the offender was booked. The two largest categories are offenders who committed violent offenses (34.9%) and those who committed “other” types of offenses (29.6%). Property offenses were committed by 15.7 percent of the sample and drug offenses were
committed by 19.8 percent of the sample population.
Table 1. COMPAS Validation Sample: Demographic Characteristics
Number Percent Sex Male 4,810 86.3% Female 765 13.7% Race White 2,339 42.0% Black 2,801 50.2% Hispanic 389 7.0% Other 46 0.8% Age Groups 18 to 23 1,371 24.6% 24 to 29 1,243 22.3% 30 to 39 1,319 23.7% 40 and Older 1,642 29.5%
Offense Type at Booking
Violent 1,944 34.9%
Property 878 15.7%
Drug 1,103 19.8%
Other 1,650 29.6%
Table 2 presents the results of the COMPAS risk classification by the risk categories: recidivism, violence, and FTA. For the category of recidivism (rearrest for any offense), the data presented in Table 2 indicate that more than half of the
5,575offenders that COMPAS was administered on scored in the low risk level for each
of the three risk categories of outcomes (recidivism, violence, FTA). COMPAS’s risk
levels are delineated on a scale of one through ten: low includes scores between one and four, medium includes scores between five and seven, and high includes scores between eight and ten.
In the recidivism category, there were 3,169 (56.8%) offenders who scored in the
low range, while 25.2 percent (n=1406) scored in the medium risk level and 17.9 percent (n=1000) scored in the high risk level. In the category of violence, 67 percent (n=3,735)
scored in the low range, 22.6 percent (1,262) scored in the medium range, and 10.4 percent (578) scored in the high range. In the category of FTA, the vast majority of the
offenders scored in the low range (73.7% or 4,108 offenders) while 18.5 percent
(n=1,032) scored in the medium range, and 7.8 percent (n=435) scored in the high range. The follow-up period with the longest duration is 12 months. As previously mentioned, the follow-up periods are not mutually exclusive; therefore, offenders in the twelve-month or nine-month follow-up periods may also be included in the shorter follow-up periods. When examining actual outcomes of the offenders who had COMPAS scores, 29.6 percent of the 5,575 offenders were rearrested for any type of
offense after being released from jail within 12 months. At shorter post-release periods,
the recidivism dropped: 5.8 percent (324) were rearrested within one month and 20.1 percent (1,059) were rearrested within six months.
When examining the second outcome category, violence, the number of offenders who were rearrested post release for a violence offense was low: 6.8 percent (n=1,746) were rearrested for a violent offense within 12 months post release, 4.4 percent (n=232) were rearrested for a violent offense within six months post release, and 1.1 percent (n=62) were rearrested for a violent offense within one month.
The final outcome category, FTA, indicates that 62.0 percent (n=1,535) of the offenders failed to appear for a court appearance within 12 months post release while 54.6 percent (n=2,837) failed to appear in court within six months post release and 32.5 percent (n=1,796) failed to appear in court within one month post release. These
incidents of failing to appear for court may or may not be related to the offense on record in the bookings file—in other words, the court appearance for which the offender failed to show may not be related to the current booking offense that selected the offender for this study. The court appearance tracked in this study may be related to a previous offense. The three categories of risk that COMPAS assesses are delineated below.
Recidivism scored 1 through 10 resulting in a low, medium, or high risk level. In this validation study, this is measured as rearrest for any offense post
release from jail pretrial.
Violence scored 1 through 10 resulting in a low, medium, or high risk level. In this validation study, this is measured as rearrest for a violent offense post release from jail pretrial.
Failture to Appear scored 1 through 10 resulting in a low, medium, or high risk level. In this validation study, this is measured as failing to appear for a court appearance post release from jail pretrial.
Table 2. COMPAS Validation: Predicted Risk Levels and Actual Outcomes
COMPAS Risk Level – Predicted Recidivism n %
Low (Scores = 1–4) 3,169 56.8%
Medium (Scores = 5–7) 1,406 25.2%
High (Scores = 8–10) 1,000 17.9%
COMPAS Risk Level – Predicted Violence
Low (Scores = 1–4) 3,735 67.0%
Medium (Scores = 5–7) 1,262 22.6%
High (Scores = 8–10) 578 10.4%
COMPAS Risk Level – Predicted Failure to Appear
Low (Scores = 1–4) 4,108 73.7%
Medium (Scores = 5–7) 1,032 18.5%
High (Scores = 8–10) 435 7.8%
Recidivism: Actual Rearrest for any crime within:
1 Month 324 5.8% 2 Months 518 9.3% 3 Months 705 12.6% 6 Months 1,059 20.1% 9 Months 1,026 25.7% 12 Months 746 29.6%
Violence: Actual Rearrest for a violent crime within:
1 Month 62 1.1% 2 Months 102 1.8% 3 Months 145 2.6% 6 Months 232 4.4% 9 Months 220 5.5% 12 Months 170 6.8%
Failure to Appear (FTA) (actual) within:
1 Month 1,796 32.5% 2 Months 2,316 41.9% 3 Months 2,611 47.3% 6 Months 2,837 54.6% 9 Months 2,335 59.2% 12 Months 1,535 62.0%
COMPAS VALIDATION: RESULTS and FINDINGS
Introduction
The findings of the COMPAS risk assessment validation include three criteria: recidivism (for any offense), violence (rearrest/recidivism for a violent offense), and FTA. For the purpose of this validation, each of the three criteria is further specified into five levels of detail: (1) total sample of offenders upon which COMPAS was
administered (between January 1, 2009 through December 31, 2009), (2) all offenders by gender, (3) all offenders by age, (4) all offenders by race/ethnicity, and (5) all offenders by offense type—each level of detail will include a table and a chart.
Tables 3 through 17 contain data addressing the accuracy of the COMPAS risk assessment instrument in its ability to assess the likelihood that offenders will recidivate upon their release pretrial. These tables display data relating to the research question: Do inmates that COMPAS identified as having higher probabilities of future recidivism post release from jail (pretrial) actually recidivate at higher rates than offenders that COMPAS identifies as having a lower likelihood of recidivism? The figures demonstrate the percentage of jail inmates released pretrial who were rearrested for any type of crime within one-, two-, three-, six-, nine-, and twelve-month periods across COMPAS’ three levels of the recidivism risk category (low, medium, and high). The percentages quantify the accuracy of the COMPAS risk assessment instrument in predicting actual post-release offending. It is possible that the predictive accuracy of the COMPAS risk assessment instrument varies by the length of the follow-up period. Therefore, the tables present recidivism data in the six follow-up periods listed above. However, for purposes of the
narrative, only three follow-up periods will be discussed: immediate (one-month follow up), intermediate (six-month follow up), and long term (twelve-month follow up).
Additional indicators of the accuracy of the COMPAS risk assessment instrument presented in the three main tables (displaying all offenders as a group) include the
differences in the likelihood of arrest between offenders assessed as low risk versus medium risk, medium risk versus high risk, and low risk versus high risk based on the COMPAS risk scores. Narrative explanations are presented for these measures to highlight trends and noteworthy deviations—which may or may not specifically include the aforementioned one-month, six-month, and twelve-month follow-up periods.
Table 3 and Charts 1 and 2 present data for recidivism (any type of offense); Table 4 and Chart 3 present data for recidivism (any type of offense) by gender; Table 5 and Chart 4 present data for recidivism (any type of offense) by age groups; Table 6 and Chart 5 present data for recidivism (any type of offense) by race/ethnicity classification; and Table 7 and Chart 6 present data for recidivism by the type of new offense committed (most serious if more than one offense was committed). The tables and charts provide graphic illustrations of the same data; therefore, narrative explanations of the charts are not included to prevent redundant explanations.
COMPAS and Recidivism: Rearrest for Any Offense
Overall, regardless of the length of the follow-up period post release, the data consistently demonstrate that offenders assessed by COMPAS as having a higher risk of recidivism were, in fact, more likely to recidivate. As presented in Table 3 and Charts 1 and 2, within the first month after pretrial jail release, 13.2% of offenders identified as having a high risk of recidivating did so compared to 7.5% of offenders identified as
medium-risk and 2.7% for low-risk offenders. Within six months after release, 42.1% of the offenders identified as having a high risk of recidivating actually recidivated
compared to 25.3% recidivism for medium-risk offenders and 11.3% for low-risk offenders. Examining offenders over a 12-month period post release indicates a greater
predictive power of the COMPAS risk assessment instrument with 61.0% of the high-risk
offenders recidivating compared to 38.4% for those assessed as medium risk and 18.1% for those assessed as low risk.
As described in this section’s introduction, Table 3 also displays data comparing the relative differences between each COMPAS risk classification level (low to medium, medium to high, low to high). These comparisons represent the predictive accuracy of the COMPAS risk classification categories when comparing actual recidivism levels across offenders assessed as “low risk” versus “medium risk,” “medium risk” versus “high risk,” and “low risk versus high risk.” These comparisons address the research question: Does identifying an offender as low risk versus medium risk provide a similar level of predictive accuracy of recidivism compared with offenders assessed as medium risk versus high risk? The data indicate that this does not occur when comparing the differences between low risk and medium risk versus medium risk and high risk. However, the predictive accuracy of these categories increased as the duration of the follow-up period lengthened. In each follow-up period, the difference between low risk and medium risk and medium risk and high risk is not significant; however, the
difference between low risk and high risk is significant. Specifically, the differences in
actual recidivism levels between released offenders assessed as low risk relative to offenders assessed as medium risk and offenders assessed as medium risk compared with
offenders assessed as high risk are relatively minimal, regardless of the length of the follow-up period. However, the differences in the likelihood of recidivism between the two extreme categories—low-risk offenders and high-risk offenders—are significant. In summary, these findings indicate that while the COMPAS risk assessment instrument is
very predictive of actual recidivism among offenders released from jail, it is particularly
Table 3. Recidivism: Percentage of Offenders Rearrested for Any Offense by
COMPAS Risk LevelsØ
Recidivism by COMPAS Risk
Level
Differences Between Recidivism Across COMPAS Risk Levels
Follow-up Period Low
Risk Medium Risk High Risk Low to Medium Medium to High Low to High 1 Month: Recidivism 2.7% 7.5% 13.2% No Recidivism 97.3% 92.5% 86.8% 4.8% 5.7% 10.5% Number of Cases 3,169 1,406 1,000 2 Months: Recidivism 4.8% 11.4% 21.0% No Recidivism 95.2% 88.6% 79.0% 6.6% 9.6% 16.2% Number of Cases 3,169 1,406 1,000 3 Months: Recidivism 6.5% 16.2% 27.2% No Recidivism 93.5% 83.8% 72.8% 9.7% 11.0% 20.7% Number of Cases 3,169 1,406 1,000 6 Months: Recidivism 11.3% 25.3% 42.1% No Recidivism 88.7% 74.7% 57.9% 14.0% 16.8% 30.8% Number of Cases 3,029 1,323 912 9 Months: Recidivism 15.3% 32.2% 52.1% No Recidivism 84.7% 67.8% 47.9% 16.9% 19.9% 36.8% Number of Cases 2,333 989 671 12 Months: Recidivism 18.1% 38.4% 61.0% No Recidivism 81.9% 61.6% 39.0% 20.3% 22.6% 42.9% Number of Cases 1,523 605 390
Chart 1. Recidivism: Rearrest for Any Offense by COMPAS Risk Levels
Recidivism: Rearrest for Any Offense by COMPAS Risk Levels
13.2% 21.0% 27.2% 42.1% 52.1% 61.0% 18.1% 15.3% 6.5% 11.3% 2.7% 4.8% 16.2% 25.3% 32.2% 11.4% 7.5% 38.4% 0% 10% 20% 30% 40% 50% 60% 70%
1 mo 2 mos 3 mos 6 mos 9 mos 12 mos
Follow-up Period for Recidivism
P e rcen t R eci d iv a te d
Low Medium High
Chart 2. Recidivism: Differences Between COMPAS Risk Levels
Recidivism: Differences Between COMPAS Risk Levels
22.6% 10.5% 16.2% 20.7% 30.8% 36.8% 42.9% 6.6% 9.7% 14.0% 16.9% 20.3% 4.8% 9.6% 5.7% 11.0% 16.8% 19.9% 0% 5% 10% 15% 20% 25% 30% 35% 40% 45% 50%
1 mo 2 mos 3 mos 6 mos 9 mos 12 mos
Follow-up Period for Recidivism (any crime)
Pe rc en t C ha nge
COMPAS and Recidivism: Rearrest for Any Offense by Sex
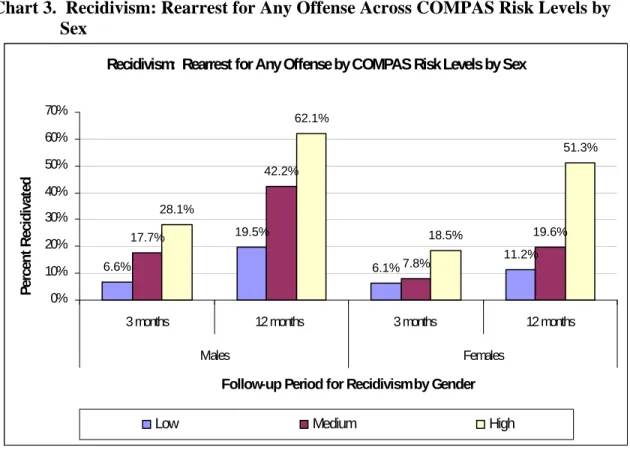
Table 4 and Chart 3 address the research: Are there differences in the predictive accuracy of the COMPAS risk assessment instrument for recidivism males and females released from jail pretrial?
As the risk level identified by the COMPAS instrument increases, the likelihood of actual recidivism increases, regardless of the offender’s gender within each of the six follow-up periods—indicating accuracy in COMPAS’s ability to predict risk.
Males have significantly higher levels of recidivism relative to females
regardless of the length of the follow-up period or the level of risk assessed by COMPAS.
When comparing the differences in the percentage of low-risk offenders who recidivated with medium-risk offenders who recidivated, COMPAS has stronger predictive accuracy when predicting recidivism risk levels for males rather than females.
Table 4. Recidivism: Percentage of Offenders Rearrested for Any Offense Across COMPAS Risk Levels by SexØ
Recidivism by COMPAS Risk Level
Follow-up Period Low Risk Medium Risk High Risk
1 Month: Males 2.8% 7.8% 13.8% Females 2.7% 5.5% 7.8% 2 Months: Males 4.9% 12.3% 21.4% Females 4.7% 6.5% 12.6% 3 Months: Males 6.6% 17.7% 28.1% Females 6.1% 7.8% 18.5% 6 Months: Males 11.7% 27.6% 44.1% Females 8.8% 12.7% 25.5% 9 Months: Males 16.1% 35.1% 53.8% Females 10.6% 16.5% 40.3% 12 Months: Males 19.5% 42.2% 62.1% Females 11.2% 19.6% 51.3%
Chart 3. Recidivism: Rearrest for Any Offense Across COMPAS Risk Levels by Sex
Recidivism: Rearrest for Any Offense by COMPAS Risk Levels by Sex
6.6% 19.5% 6.1% 11.2% 17.7% 42.2% 7.8% 19.6% 28.1% 62.1% 18.5% 51.3% 0% 10% 20% 30% 40% 50% 60% 70%
3 months 12 months 3 months 12 months
Males Females
Follow-up Period for Recidivism by Gender
Pe rcen t R ecid ivat ed
Low Medium High
COMPAS and Recidivism: Rearrest for Any Crime by Age Groups
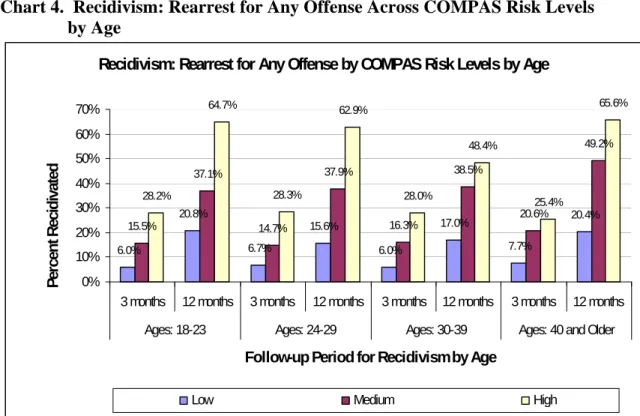
Table 5 and Chart 4 address the research question: Are there differences in the predictive accuracy of the COMPAS risk assessment system for recidivism across four offender age groups (18–23 years, 24–29 years, 30–39 years, and 40 years and older)?
As the risk level identified by the COMPAS instrument increases, the likelihood of actual recidivism increases, regardless of the offender's age grouping within each of the six follow-up periods.
Among offenders classified as medium risk by COMPAS, those 40 years of age or older exhibit higher recidivism rates in all of the six follow-up periods. Otherwise, there is no pattern that indicates that age is a factor in the
The predictive accuracy of COMPAS for recidivism is relatively consistent across the four offender age categories. An exception to this finding is among offenders 30 to 39 years of age for the long-term follow-up period of 12 months. The difference in recidivism rate for that age group increases by 31.4% (17.0% to 48.4%) from low to high risk compared with increases of 43.9% (20.8% to 64.7%) for the 18 to 23 age group, 47.3% (15.6% to 62.9%) for the 24 to 29 age group, and 45.2% (20.4% to 65.6%) for the 40 or older age group.
Table 5. Recidivism: Percentage of Offenders Rearrested for Any Offense Across COMPAS Risk Levels Age GroupingØ
Recidivism by COMPAS Risk Level
Follow-up Period Low Risk Medium Risk High Risk
1 Month:
18-23 years 2.6% 7.5% 13.2%
24-29 years 2.2% 5.1% 13.8%
30-39 years 2.5% 7.8% 14.9%
40 years and over 3.4% 9.8% 11.4%
2 Months:
18-23 years 4.7% 11.0% 21.8%
24-29 years 5.3% 9.3% 20.2%
30-39 years 4.4% 11.7% 22.3%
40 years and over 5.5% 15.9% 18.4%
3 Months:
18-23 years 6.0% 15.5% 28.2%
24-29 years 6.7% 14.7% 28.3%
30-39 years 6.0% 16.3% 28.0%
40 years and over 7.7% 20.6% 25.4%
6 Months:
18-23 years 12.8% 25.7% 43.6%
24-29 years 11.1% 24.1% 42.8%
30-39 years 10.5% 25.4% 42.1%
40 years and over 12.5% 29.1% 39.6%
9 Months:
18-23 years 18.1% 30.5% 55.7%
24-29 years 14.4% 31.8% 53.3%
30-39 years 13.5% 32.9% 48.0%
40 years and over 17.5% 38.2% 51.4%
12 Months:
18-23 years 20.8% 37.1% 64.7%
24-29 years 15.6% 37.9% 62.9%
30-39 years 17.0% 38.5% 48.4%
40 years and over 20.4% 49.2% 65.6%
Chart 4. Recidivism: Rearrest for Any Offense Across COMPAS Risk Levels
by Age
Recidivism: Rearrest for Any Offense by COMPAS Risk Levels by Age
6.0% 20.8% 6.7% 15.6% 6.0% 17.0% 7.7% 20.4% 15.5% 37.1% 14.7% 37.9% 16.3% 38.5% 20.6% 49.2% 28.2% 64.7% 28.3% 62.9% 28.0% 48.4% 25.4% 65.6% 0% 10% 20% 30% 40% 50% 60% 70%
3 months 12 months 3 months 12 months 3 months 12 months 3 months 12 months Ages: 18-23 Ages: 24-29 Ages: 30-39 Ages: 40 and Older
Follow-up Period for Recidivism by Age
Pe rc en t Reci di va te d
Low Medium High
COMPAS and Recidivism: Rearrest for Any Crime by Race/Ethnicity
Table 6 and Chart 5 address the research question: Are there differences in the predictive accuracy of the COMPAS risk assessment instrument for recidivism across racial/ethnic groups (white, black, and Hispanics) released from jail pretrial?
As the risk level identified by COMPAS increases, the likelihood of actual recidivism increases, regardless of the offender’s race or ethnicity within each of the six follow-up periods.
Comparing recidivism rates within the COMPAS risk level categories and the six follow-up periods for whites, blacks and Hispanics indicates no
demonstrable pattern or significant differences in the likelihood of recidivism across the racial/ethnic groups.
The predictive accuracy of COMPAS is equivalent across whites, black and Hispanic offenders in the immediate follow-up period (one month) and is slightly greater for black offenders in the intermediate (six months) and long-term (12 months) follow-up periods. Specifically, the analysis for the intermediate follow-up period shows that 10.3% of black offenders assessed by COMPAS as low risk recidivated compared to 43.3% of the black
offenders COMPAS assessed as high risk, for a difference of 33.0%. By comparison, the difference was 26.7% for white offenders with 12.1% in the low-risk level recidivating compared to 38.8% in the high-risk level.
Comparable findings emerge when examining the differences within the long-term follow-up period (12 months).
Table 6. Recidivism: Percentage of Offenders Rearrested for Any Offense Across COMPAS Risk Levels by Race/EthnicityØ
Recidivism by COMPAS Risk Level
Follow-up Period Low Risk Medium Risk High Risk
1 Month: White 3.3% 7.9% 12.8% Black 2.0% 7.8% 13.4% Hispanic 3.4% 2.2% 13.3% 2 Months: White 5.5% 10.8% 22.2% Black 4.0% 12.1% 20.0% Hispanic 4.8% 8.8% 16.7% 3 Months: White 7.5% 16.2% 27.4% Black 5.5% 16.1% 27.1% Hispanic 5.6% 12.1% 26.7% 6 Months: White 12.1% 24.2% 38.8% Black 10.3% 26.5% 43.3% Hispanic 10.9% 21.4% 44.8% g 9 Months: White 16.3% 31.8% 48.6% Black 14.6% 33.5% 53.8% g Hispanic 12.1% 21.2% 52.6% 12 Months: White 18.8% 38.7% 58.5% Black 18.2% 38.9% 62.7% Hispanic 13.0% 29.8% 46.7% g
Ø Recidivate/Recidivism is defined as rearrest for any offense.
Chart 5. Recidivism: Rearrest for Any Offense Across COMPAS Risk Levels by Race/Ethnicity
Recidivism: Rearrest for Any Offense by COMPAS Risk Levels by Race/Ethnicity 7.5% 18.8% 5.5% 18.2% 5.6% 13.0% 16.2% 38.7% 16.1% 38.9% 12.1% 29.8% 27.4% 58.5% 27.1% 62.7% 26.7% 46.7% 0% 10% 20% 30% 40% 50% 60% 70%
3 months 12 months 3 months 12 months 3 months 12 months
White Black Hispanic
Follow-up Period for Recidivism by Race/Ethnicity
Pe rc en t Re ci di va te d
Low Medium High
COMPAS and Recidivism: Rearrest for Any Offense by Offense Type
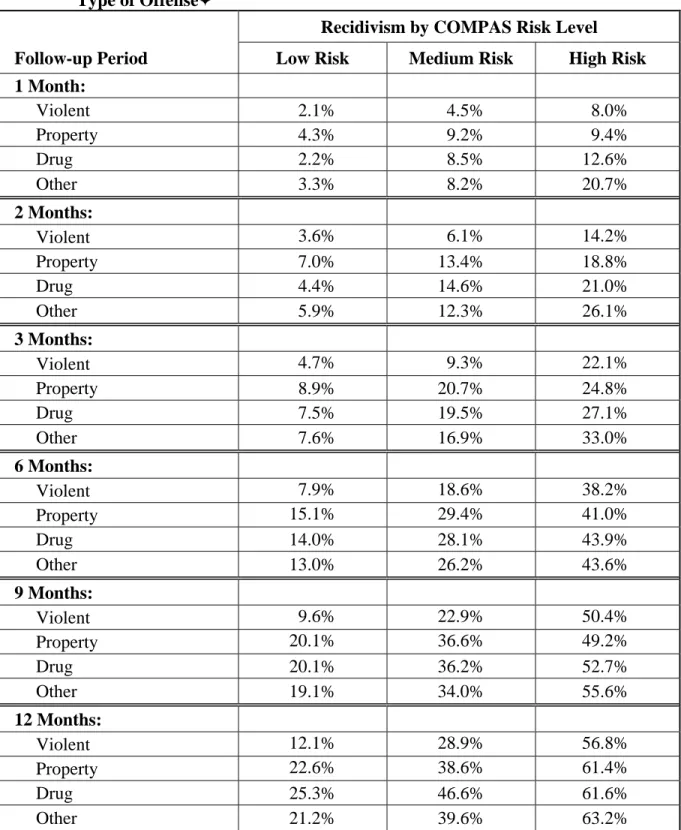
Table 7 and Chart 6 address the research question: Are there differences in the predictive accuracy of the COMPAS risk assessment for offenders released from jail pretrial by offense type (original offense)? The offenses were categorized into four categories to simplify the analysis: violent, property, drug, and other.
As the risk level identified by the COMPAS instrument increases, the likelihood of actual recidivism increases, regardless of the type of crime initially committed within each of the six follow-up periods.
Violent offenders consistently have lower recidivism rates than those arrested for property, drug, or other crimes regardless of the length of the follow-up period or the COMPAS risk level. Drug and property offenders generally