Evaluation of Transmission Tariff Methods in
Restructured Power Markets
Hyde M. Merrill, Fellow, IEEE, Nelson Bacalao, Ramón Nadira, and Carlos A. Dortolina, Senior Member, IEEE
Abstract: This paper compares two methodologies to assign to the users that portion of the regulatory Authorized Income of a Transmission Company, that is not covered by the income generated by the use of Locational Marginal Prices (Transmission Surplus) plus the connection charges. This uncovered portion is known as the “Complementary Charges”, which can be negative but are usually positive and large.
The main methodologies compared for the calculation of the Complementary Charges are Nodal-Use and Nodal-Distance. Both methodologies produce different prices for different nodes in the system (hence the name Nodal). However the first methodology relies on load flows and power distribution factors, while the second uses physical location information. The comparison of the methodologies is based on the level of compliance with six selected tariff objectives.
I. INTRODUCTION
he electric power transmission service is, given today’s technology, a natural monopoly, due to the cost of the required investments, strong economies of scale and most importantly due to “use of land” constraints. The solution adopted by most governments to this situation is to make the
transmission service a regulated monopoly, subject to
concession and regulated tariffs.
The regulated tariff system is normally designed to allow the Transmission Companies to collect an “Authorized Income” designed such as it covers the company’s authorized fixed and variable costs plus a reasonable profit. This Authorized Income can be based on actual costs, as in Rate of Return Regulation or on pre-defined efficient operation, maintenance, administrative and investment costs (Price Cap Regulation). In this last case the Authorized Income is also called “total efficient income”.. The Transmission Companies can collect its Authorized Income from different sources. In this paper we shall assume that, the “Transmission Surplus”, that is the income generated by buying and selling power at Locational Marginal Prices, will be assigned to the transmission company. Additionally, the design includes the concept of “connection charges”, which are
H. M. Merrill, is with Merrill Energy, LLC., Schenectady, NY 12305 (email: [email protected])
N. Bacalao is with Stone & Webster Consultants Inc., Houston, TX 77077, USA (email: [email protected])
R. Nadira is with Stone & Webster Consultants Inc., Houston, TX 77077, USA (email: [email protected])
C. A. Dortolina is with Stone & Webster Consultants Inc., Houston, TX 77077, USA (email: [email protected])
payments to be made by both the consumers and the generators to compensate for those assets are clearly their responsibility Since the sum of the Transmission Surplus and the Connection Charges will not match the Authorized Income, there are two broad ways to compensate for the difference. The first one contemplates a scaling the Transmission Surplus and the second, favored by as most authors, contemplates the addition of a third term the “Complementary Charges” as follows: Complementary Charges = Authorized Income – Transmission
Surplus – Total Connection Charges (1)
This paper compares two methodologies to assign
Complementary Charges to the various Agents that make use of the transmission system (distribution companies, generators and large loads).
II. TARIFF OBJECTIVES
The methodologies are compared in terms of their compliance with the following tariff objectives:
Objective 1: Tariff Stability
This objective favors transmission tariffs that are stable and predictable. Stable Tariffs allows the agents to make better investment decisions as it reduces the uncertainty on the projects competitive position and likely operation costs.
Objective 2: Non Discrimination.
New users should not face bigger charges than existing users or vice-versa. Similarly new users nor should have undue barriers to entry. This objective facilitates the expansion of generation and transmission systems which, in developing countries, is very important to assure the appropriate satisfaction of the demand. The main element is achieving this objective is by the elimination of Preferential Rights of existing users, so that new efficient generators can displace older ones. However the non-discrimination principle also seeks to minimize the impact on the existing agents of the entry of another.
Objective 3: Appropriate Remuneration for the Transmission
Companies.
The tariffs should allow complete recovery of the Transmission Company (s) Authorized Income.
Objective 4: Energy Transmission Efficiency Incentive.
The tariffs should provide appropriate signals to promote the most economical location of generation and large industrial loads. The tariff should inform the users the cost imposed to the
T
system, allowing them to make decisions on the placement of new loads, the retirement of inefficient and obsolete generators and the optimal location of new power plants.
Objective 5: Simplicity of Rates (Easy to Apply).
The charges should be conceptually simple and transparent and must allow all users to estimate the expected payments. Therefore, every Agent should understand the rationality of the methodology.
Objective 6: Rates must be Consistent with the Other Charges
Faced by the Users.
The transmission tariff design should be consistent, in as much as possible, with other fuels’ transportation charges, to promote right decisions on the location of generation facilities.
III. COMPLEMENTARY CHARGES
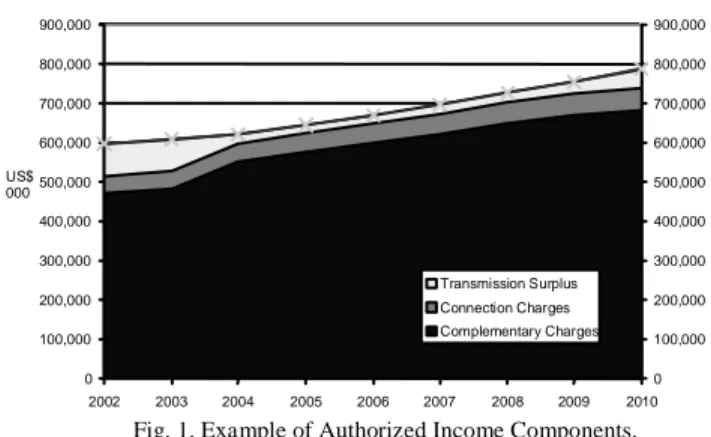
Complementary Charges may be, according to our estimates, a
very important component for the collection of the
Transmission Company’s Authorized Income. Figure 1 shows the projected structure of revenues recovery for a system in a developing country (Venezuela). From that Figure it can be observed that by 2004, the Transmission Surplus becomes the smallest income component, being the complementary charges the most important. For the years 2002 and 2003 there is severe congestion in the system, which rises the Transmission Surplus. Four methods will be evaluated for the collection of the Complementary Charges:
• Long Term Marginal Cost (“LTMC”)
• Nodal-Use (N-U),
• Nodal-Distance (N-D) and
• Nodal-Electric Distance (N-Z).
These four methods are described below.
0 100,000 200,000 300,000 400,000 500,000 600,000 700,000 800,000 900,000 2002 2003 2004 2005 2006 2007 2008 2009 2010 US$ 000 0 100,000 200,000 300,000 400,000 500,000 600,000 700,000 800,000 900,000 Transmission Surplus Connection Charges Complementary Charges
Fig. 1. Example of Authorized Income Components. LTMC Method
In this methodology, the rates reflect the participation of the node in the long-term marginal cost for the transmission system, or costs of expansion.
The LTMC approach has attractive features in terms of costs recovery and economic efficiency. The method considers the existence of transmission “paths or rights of way” along which transmission capacity can be added and it assumes that the
expansion can be approached as a “continuous” instead of a “discrete” problem (i.e., transmission capacity can be added as a continuos function). Based on these simplifying assumptions, the method solves the optimization problem of meeting the demand growth in each node at minimum cost, by the use of local generation and grid expansions. The derivative of the cost to the load is the node’s Long Term Marginal Cost (LTMC).Similarly, from the generation point of view, the long-term marginal cost represents the cost to produce and transmit an additional MW in the generation nodes.
The tariffs at each node are determined as the difference between the node’s LTMC and the corresponding short tem marginal cost (or Locational Marginal Cost).
Further details on the theory behind this method can be found in reference [3].
Nodal-Use (N-U) Method
In this methodology, the rates are made proportional to the effective “use” that each agent makes of the system. This “use” is estimated by considering that each agent that increases the flow in a line should pay a portion of its cost, according to the following formula: r i k k m k k d
i
I
f
F
_ 1)
/
(
)
(
=
×
π
∑
= (2)Where πd(i) is the “use” charge at demand node “i” in
$/MW,
F
kr_i is the contribution to the flow in line “k” of a 1 MW injection in the reference bus “r” and a 1 MW draw at demand bus “i” (also know as the Power Participation Factor),Ik is the line “k” required income (capital and O&M costs
recovery less associated transmission surplus),
f
kis the linecapacity and m is the number of lines in the system. Note that one problem with this method is that it requires the definition of
the transfer capacity
f
k, which in general is determined bycontingencies and function of the conditions in the network. Further, since the lines rarely are loaded to their maximum capacity, in order to collect 100% of the required income, it is necessary to add an additional term to the charges in equation (2), which is generally a postage stamp-type charge. Also in this method the cost are allocated 50% / 50% between the generation and load.
Nodal-Distance (N-D) Method
This is a nodal-type method where the use of the system is defined in terms of the real physical distance (calculated using a straight line) between the load and the generating stations. This method takes into account the fact one can not properly associate a generator with a specific load by the calculation of a “Weighted Average Distance” as follows:
The Weighted Average Distance for every generation node “g”
between that generation node to all loads in the system, using the corresponding yearly energy consumption as the weight. For every demand node “d” the method is the same as for the generation nodes, but in this case the distance to all generators is weighted by the net capacity connected to each node.
Although it is not strictly necessary, in order to facilitate the comparison with the previous methods, it was deemed convenient to split the recovery of the Complementary Charges (CC) between the demand and generation, according to a factor
“α” / “1-α”, say 50%/50%. Therefore the tariff for each
demand node “d” (in $/MWh) is given by: ) * ( * * ) ( 1 α = π
∑
=WD D CC WD i n j j j i d (3)Where Djis the annual energy consumption at node “i” and “n”
is the total number of demand nodes in the system.
For the generation nodes “g” this method defines the tariffs in $/MW/year as: )) 1 ( * ( * * ) ( 1 α − = π
∑
= WD G CC WD i m j j j g g (4)Where Gjis the net generation capacity at node “i” and “m” is
the total number of generation nodes in the system.
To take into account the effect of the topology, the method uses a topology factor (generally between 100% and 150%) to modify the distances and recognize terrain types (i.e., plain, intermediate and mountainous terrain),
Finally, for regions that are somehow isolated and therefore, do not use the totality of the transmission system, the method considers a subset of distances to allocate the costs.
Nodal-Electric Distance (N-Z) Method
This is another nodal-type of method, similar to the previous, except that in this case instead of physical distances, electrical distances (impedances) are used to define the use of the system. The comparison of the electrical angles in the buses eliminates the need of a manual adjustment to recognize that local power stations only use part of the transmission system. The cost of the system reflects topological considerations (mountainous, intermediate and plain).
IV. COMPARISON OF METHODOLOGIES
The four methodologies described above are compared in this section of the paper based on the tariff objectives enunciated earlier. Base case will be the Venezuelan system, as shown in Figure 2. Where arrows indicate large load centers and circles large generation sources. This system peak demand is about 12,000 MW and hydroelectric plants in the southeast part of the country produce 70% of the electric energy. There are other
important generation centers in the central part of the country and to smaller extent in the west.
Volatility: This objective is maybe the most important, since
somehow it is related with the rest of the objectives. The main impediment to the private investment is the volatility of the charges, therefore the methods should offer stable signals that facilitate the decision making process.
Fig. 2. Generation and Demand nodes in the Venezuelan system.
-120.00 -100.00 -80.00 -60.00 -40.00 -20.00 0.00 20.00 40.00 60.00
Southeast Northeast Central West Southwest Reference
Demand Nodes %o f V a ri a ti o n LTMC N-U N-D N-Z
Fig. 3. Transmission Rates for the Demand Nodes.
-50.00 -40.00 -30.00 -20.00 -10.00 0.00 10.00 20.00 30.00 40.00 50.00
Southeast Northeast Central West Southwest Reference
Generating Nodes %o f V a ri a ti o n LTMC N-U N-D N-Z
Figures 3 and 4 show the percentage change in the rates for the demand and generation at several nodes in the system, given the changes in system conditions between years 2002 and 2005 Larger changes are associated with greater volatility.
As can be observed in Figures 3 and 4, it is possible to classify
the LTMC and N-Z methods as volatile. These two
methodologies will not be analyzed for the next objectives, considering the importance of stable charges.
Non Discrimination: This principle basically advocates for the
elimination of preferential rights to both existing and new users. This way a new generator that economically displaces another can use the existing grid without of having to fund an
expansion. Similarly, if an expansion is required to
accommodate new generators (that will attend new demand), then the cost of this expansion is added to the Transmission Company’s Authorized Income and it is recovered through all agents, instead of charging it to the new entrants.
Both methods (the N-D and the N-U) are in compliance with the considerations above, which are basically of regulatory nature. However the non-discrimination principle also seeks to minimize the impact on the existing agents of the entry of another. In this case the methods differ as illustrated by the two examples below.
In the first case we will consider the effect of a transmission expansion due to the entry of a new generator distant to the load and in the second will consider only the entry of a new generator, without changes to the transmission system.
In the first case, while the transmission expansion does not modify the physical distance among the agents, it does increase in absolute terms the Authorized Income. Therefore, under the N-D method, all agents see an increase of both the numerator (CC term) and the denominator (weighted distances times net capacity) in formula (3). Therefore given that the generator is remote it is likely that the increase in cost is will at least be partially compensated by the entry. However in as much that it is not, all agents will see an increase in their costs, particularly those generators farther away from the loads.
The N-U method, on the other hand recognizes that the expansion benefits the agents in different proportions, through the analysis of participation factors, and in general the agents that pay more are those whose also “use” more of such expansion. However, that portion of the expansion that does not translate into an increase in use is transferred equally to all users by an increase in the postage stamp charge.
For the second case, which considers new generation near the major load centers, there are two distinct scenarios. Under the first scenario the local generation increase is larger than the local load growth, hence it changes the use of the transmission system, by displacing distant generation. In this case:
• With the N-U method there are changes in the way the
Complementary Charge is allocated between the market participants. Since distant generation is using less of the
transmission system, it covers less of the system cost and the balance has to be recovered through the postage stamp charge. Given that this charge is allocated equally among all users, some generators might see an important increase in their costs, particularly the local ones.
• The N-D method distributes the Complementary Charge
among all the generators in function of their “Weighted Average Distances” to the load. Therefore the entry of a new generator without an increase in the transmission investment translates in a reduction in the transmission costs for all generators.
In case that the load growth is greater than the generation addition, then the use of the transmission system increases and the methods have the following behavior:
• In the N-U given that the use of the system increases, then
the recovery through “use” increases and the postage stamp charge decreases, therefore local generators will see a reduction in their costs, while the distant generators will see an increase through the usage term.
• The N-D method distributes the costs among all the
generators in function of the new load/generation–distance relationship for all the agents and therefore, the existing generators and loads reduce their individual payments when new generators and load are added to the system.
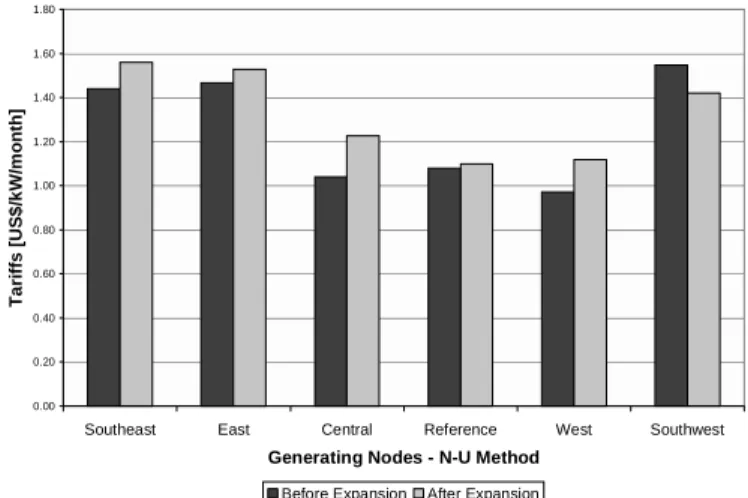
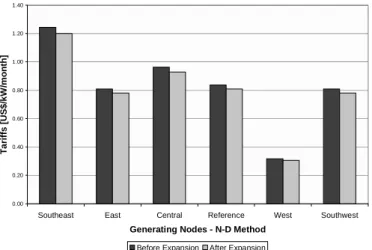
Figures 5 and 6 show how the transmission tariffs are affected with new generation capacity in the Venezuelan central region, according the N-U and N-D methods. In these figures it can be observed that as expected with the N-U method the cost rise in some nodes (particularly in those closer to the addition) and it is reduced in others. The N-D method lowers the costs throughout the system.
0.00 0.20 0.40 0.60 0.80 1.00 1.20 1.40 1.60 1.80
Southeast East Central Reference West Southwest
Generating Nodes - N-U Method
Ta ri ff s [U S$ /k W/m ont h]
Before Expansion After Expansion
Fig. 5. N-U Method. Transmission Rates with new Generation. Recovery of the Authorized Income: Both methods evaluated
allow for the recovery of the complementary charge, once this is calculated as the difference between the Authorized Income and both the transmission surplus and connection charge. However the N-U method does not “intrinsically” recover the totality of the required income and it requires the addition of
postage stamp term to achieve full recovery. This term can be as large as 30% of the total. Under the same conditions, the N-D method always recovers the exact desired amount for the complementary charges 0.00 0.20 0.40 0.60 0.80 1.00 1.20 1.40
Southeast East Central Reference West Southwest
Generating Nodes - N-D Method
Ta ri ff s [U S $ /k W /m ont h]
Before Expansion After Expansion
Fig. 6. N-D Method. Transmission Rates with new Generation. Energy Transmission Efficiency Incentive: The efficiency in
the energy transmission can be characterized under two perspectives: (i) management of congested and lightly loaded lines, and (ii) production of economic signals. The topic of economic signals will be analyzed with more detail in below, and therefore this section deals with line loading
By its distributed nature, a transmission system can be heavily congested in some areas, that is loaded to capacity, while in other there could still be surplus capacity. Therefore:
• The tariffs should reflect the transmission restrictions, and.
• The tariff mechanism should allow for the recovery of the
cost of lightly or partially loaded lines.
The “Transmission Surplus” (income produced by the use of Locational Marginal Costs) is in our opinion the most important factor for the recovery of costs of congested lines and this applies to both methods. However, since the N-U method assigns the income requirement of the lines to those users that, according to the participation factors, are responsible for its loading, then this method seems to be better suited to price congestion than the N-D method. However this argument presumes that one can properly assess the line’s capacity (which is function of the system condition) and that the participation factors are valid (they change with changes in the topology).
For the cost recovery of partially loaded lines, it does not seem to be fair to charge those agents that use a fraction of the capacity of a line all its associated costs, since this additional capacity improve system reliability. However, those agents that are far from their counterparts (generation or load centers), benefit more from this increase in reserve than those that are close to them. In the case of the N-U method, the postage stamp charge assign the costs associated with the reserve equally to all users and the distance issue does not enter into consideration. The N-D method, however, by its definition recognizes that
those agents that are more distant benefit more with the increase in reliability and are assigned a greater proportion of the costs.
Economic Signals: Both methods are based on nodal rates
which creates a tariff structure reflective of the costs users impose on the transmission system and allows these users to make investment/retirement decisions based in such tariffs. The strength of these signals, however, varies according to the methods and this is measured in Table 1 below. In evaluating this table the following characteristic of the system should be considered.
Demand Location: As indicated before there is a very large hydroelectric source in the southeast part of the country and some important generation in the central part of the country. Therefore Southeast is best place to install loads from a transmission point of view. This is followed by the Central and East nodes, without a clear preference, and the West node. Finally the Southwest node is the worst location for a load. Generation Location: Generation is the flip side of the load, the Southwest node is the best place to install new generation, closely followed by the West node, then the Central and East nodes (without a clear preference) and the Southeast node is the worst place to install new generation.
Analyzing Table 1 it is possible to observe that the N-U method produces tariffs for the demand in line with the system characteristics discussed above. On the other hand, for the generation, this method produces some unexpected results as the Southwest node has highest tariff, while this node is short in generation. The rest of the nodes have rates as expected. The N-D method, as can be observed in Table 1, produces rates for both the generation and demand, which are substantially in line with the system knowledge outlined above. For example, in table 1 it can be observed that the Southeast node has, as expected, the lowest rates for demands and the highest for new generation. Conversely, the Southwest node has the highest rates for demand and the second lowest for new generation. Finally, by its definition, the LTMC is the benchmark for economic signals. This method produces tariffs that have a similar behavior as those produced by the N-D method, including the fact that for generation the Southwest node is more expensive than the West node (see table 1).
TABLE 1.
COMPARISON OF ECONOMICSIGNALS.
Generating Nodes Rank [1] 2002 2005 2002 2005 2002 2005 Southeast 4 1.15 1.07 1.24 1.04 1.20 1.05 East 3 0.78 0.81 0.82 0.68 0.88 0.47 Central 3 0.99 0.96 0.96 0.80 0.39 0.98 Reference 3 1.09 0.92 0.84 0.70 1.24 0.00 West 2 0.58 0.63 0.32 0.26 0.19 0.19 Southwest 1 1.47 1.57 0.81 0.68 0.33 0.40 LTMC Method US$/kW/month N-U Method N-D Method
Demand Nodes Rank [1] 2002 2005 2002 2005 2002 2005 Southeast 1 1.36 1.36 1.34 1.30 1.49 1.52 East 2 1.70 1.63 2.22 1.91 1.96 2.15 Central 2 1.80 1.73 2.47 2.10 2.38 2.31 Reference 2 2.69 2.33 3.22 2.75 2.79 2.50 West 3 4.30 4.10 4.50 3.87 4.02 3.61 Southwest 4 5.67 4.98 5.97 5.20 4.73 3.42 [1] Intuitive Ranking
N-U Method N-D Method LTMC Method US$/MWh
Simplicity and Transparency: To properly calculate the
power participation factors and transmission limits required by the N-U method, it is necessary to know the system’s condition. Therefore as these conditions can have wide variations, particularly in heavily hydroelectric systems, there could be wide variations in calculated rates. As it is clearly impractical
to have transmission rates that change by the hour,
approximations are made by calculating a probability-weighted average. However, these simplifications compromise the accuracy of the results and given the complexity of the calculations, there is a high probability that an independent analysis will produce different results.
The N-D method can be implemented in a spreadsheet. The involved calculations include the determination of the distances among all load-generation node pairs, which is relatively simple and transparent. The results obtained from independent evaluations will very likely reach the same solutions.
Consistency between Transmission Rates and Fuel (Natural Gas) Rates: The T-D method is reflective of the costs incurred
and it is free of cross-subsidies, as it does not require a postage-stamp charge. Therefore, provided that the fuel transportation costs are also free of cross-subsidies, consistency is guaranteed. The N-U method can potentially be in miss-alignment with the fuel transportation cost, as it requires a postage stamp charge. However, given that this charge is generally small, the N-U method should also produce consistent charges with fuel.
V. CONCLUSIONS
This paper presented different methods to assign the
Complementary Charges (that is the difference between the Transmission Company’s Authorized Income and that collected by means of Locational Marginal Costs and Connection Charges) to the different users of a transmission system.. Six tariff objectives were recommended to guide the evaluation of the methods presented. These objectives are oriented to encourage private investment, prevent discrimination, properly
remunerate the transmission activity, send appropriate
incentives to the agents, establish simple and transparent rates, and achieve consistency with the other fuel transportation costs. Base on the analysis in this paper it is possible to discard two of the methods proposed (impedance and LTMC). The two remaining methods (N-U and N-D) have virtues that make them both advisable, depending on the criteria evaluated. However, one element that inclines the scale towards the N-D method, is
its simplicity, aspect that is of great importance in the moment of establishing the Wholesale Electricity Market. Additionally, the N-D method appears to provide the best economic signals of all the studied methods, being this an important element to consider.
VI. REFERENCES
[1] Schweppe, F.C., M.C. Caramanis, R.D. Tabors, and R.E. Bohn, “Spot Pricing of Electricity,” Kluwer Academic Publishers, Boston, 1988. [2] Schweppe, F.C., R.E. Bohn, and M.C. Caramanis, “Wheeling Rates: An
Economic-Engineering Foundation,” TR 85-005 Report, Massachusetts Institute of Technology, Cambridge, 1985.
[3] PSRI-deBarr, “Cálculo de los Cargos por Uso del Sistema de Transmisión,” Course prepared for Fundelec, Venezuela, 1999.
VII. BIOGRAPHIES
Hyde M. Merrill (F) is an Electrical Engineering graduate of the University of Utah and MIT (PhD 1972). He was with the American Electric Power Company for 7 years, spent a year as a visiting assistant professor at MIT, and worked for nearly 2 decades at Power Technologies, Inc. He founded Merrill Energy L.L.C. in 1998 to provide advance capabilities in risk analysis and strategic planning to all stakeholders in modern and traditional power markets. Nelson Bacalao received an Electrical Engineering degree (Cum Laude) from Universidad Simón Bolívar (USB), Caracas, Venezuela, the MSc. from Rensselaer Polytechnic Institute (RPI), Troy, NY, the PhD from University of British Columbia, Canada, and the MBA from the Instituto de Estudios Superiores de Administración (IESA), Caracas, Venezuela. He is currently Executive Consultant in the Project Finance Services Practice at Stone & Webster Consultants, Inc.
Ramón Nadira received an Electrical Engineering degree (Summa Cum Laude) from USB, Caracas, Venezuela, and the MSc. and the PhD degrees, both from Case Western Research University, Cleveland, Ohio. He is currently Vice-President in the Project Finance Services Practice at Stone & Webster Consultants, Inc.
Carlos A. Dortolina (SM) received an Electrical Engineering degree from USB, Caracas, Venezuela, the MSEPE from RPI, Troy, NY, and the MBA in Economics from Universidad Católica Andrés Bello, Caracas, Venezuela. He is currently a Senior Consultant in the Project Finance Services Practice at Stone & Webster Consultants, Inc.