An Expanded Genome-Wide Association Study
of Type 2 Diabetes in Europeans
Robert A. Scott,
1Laura J. Scott,
2Reedik Mägi,
3Letizia Marullo,
4Kyle J. Gaulton,
5,6Marika Kaakinen,
7Natalia Pervjakova,
3Tune H. Pers,
8,9,10,11Andrew D. Johnson,
12John D. Eicher,
12Anne U. Jackson,
2Teresa Ferreira,
5Yeji Lee,
2Clement Ma,
2Valgerdur Steinthorsdottir,
13Gudmar Thorleifsson,
13Lu Qi,
14,15,16Natalie R. Van Zuydam,
5,17Anubha Mahajan,
5Han Chen,
18,19Peter Almgren,
20Ben F. Voight,
21,22,23Harald Grallert,
24,25,26Martina Müller-Nurasyid,
27,28,29,30Janina S. Ried,
27Nigel W. Rayner,
5,31,32Neil Robertson,
5,31Lennart C. Karssen,
33,34Elisabeth M. van Leeuwen,
33Sara M. Willems,
1,33Christian Fuchsberger,
2Phoenix Kwan,
2Tanya M. Teslovich,
2Pritam Chanda,
35Man Li,
36Yingchang Lu,
37,38Christian Dina,
39Dorothee Thuillier,
40,41Loic Yengo,
40,41Longda Jiang,
7Thomas Sparso,
10Hans A. Kestler,
42,43Himanshu Chheda,
44Lewin Eisele,
45Stefan Gustafsson,
46Mattias Frånberg,
47,48,49Rona J. Strawbridge,
47Rafn Benediktsson,
50,51Astradur B. Hreidarsson,
51Augustine Kong,
13Gunnar Sigurðsson,
51,52Nicola D. Kerrison,
1Jian
’
an Luan,
1Liming Liang,
14,53Thomas Meitinger,
30,54,55Michael Roden,
26,56,57Barbara Thorand,
25,26Tõnu Esko,
3,8,58Evelin Mihailov,
3Caroline Fox,
59,60Ching-Ti Liu,
61Denis Rybin,
62Bo Isomaa,
63,64Valeriya Lyssenko,
20Tiinamaija Tuomi,
63,65David J. Couper,
66James S. Pankow,
67Niels Grarup,
10Christian T. Have,
10Marit E. Jørgensen,
68Torben Jørgensen,
69,70,71Allan Linneberg,
69,72,73Marilyn C. Cornelis,
74Rob M. van Dam,
15,75David J. Hunter,
14,15,16,76Peter Kraft,
14,53,76Qi Sun,
15,16Sarah Edkins,
32Katharine R. Owen,
31,77John R.B. Perry,
1Andrew R. Wood,
78Eleftheria Zeggini,
32Juan Tajes-Fernandes,
5Goncalo R. Abecasis,
2Lori L. Bonnycastle,
79Peter S. Chines,
79Heather M. Stringham,
2Heikki A. Koistinen,
80,81,82Leena Kinnunen,
80,81,82Bengt Sennblad,
47,48Thomas W. Mühleisen,
83,84Markus M. Nöthen,
83,84Sonali Pechlivanis,
45Damiano Baldassarre,
85,86Karl Gertow,
47Steve E. Humphries,
87Elena Tremoli,
85,86Norman Klopp,
24,88Julia Meyer,
27Gerald Steinbach,
89Roman Wennauer,
90Johan G. Eriksson,
63,91,92,93Satu Männistö,
91Leena Peltonen,
32,44,91,94†Emmi Tikkanen,
44,95Guillaume Charpentier,
96Elodie Eury,
41Stéphane Lobbens,
41Bruna Gigante,
97Karin Leander,
97Olga McLeod,
47Erwin P. Bottinger,
37Omri Gottesman,
37Douglas Ruderfer,
98Matthias Blüher,
99,100Peter Kovacs,
99,100Anke Tonjes,
99,100Nisa M. Maruthur,
36,101,102Chiara Scapoli,
4Raimund Erbel,
45Karl-Heinz Jöckel,
45Susanne Moebus,
45Ulf de Faire,
97Anders Hamsten,
47Michael Stumvoll,
99,100Panagiotis Deloukas,
32,103Peter J. Donnelly,
5,104Timothy M. Frayling,
78Andrew T. Hattersley,
105Samuli Ripatti,
32,44,95,106Veikko Salomaa,
80Nancy L. Pedersen,
107Bernhard O. Boehm,
108,109Richard N. Bergman,
110Francis S. Collins,
79Karen L. Mohlke,
111Jaakko Tuomilehto,
91,112,113,114Torben Hansen,
10,115Oluf Pedersen,
10Inês Barroso,
32,116Lars Lannfelt,
117Erik Ingelsson,
46,118Lars Lind,
119Cecilia M. Lindgren,
5,94Stephane Cauchi,
40Philippe Froguel,
7,40,41Ruth J.F. Loos,
37,38,120Beverley Balkau,
121,122Heiner Boeing,
123Paul W. Franks,
124,125Aurelio Barricarte Gurrea,
126,127,128Domenico Palli,
129Yvonne T. van der Schouw,
130David Altshuler,
94,131,132,133,134,135Leif C. Groop,
20,44Claudia Langenberg,
1Nicholas J. Wareham,
1Eric Sijbrands,
90Cornelia M. van Duijn,
33,136Jose C. Florez,
8,132,137James B. Meigs,
8,132,138Eric Boerwinkle,
139,140Christian Gieger,
24,25Konstantin Strauch,
27,29Andres Metspalu,
3,141Andrew D. Morris,
142Colin N.A. Palmer,
17,143Frank B. Hu,
14,15,16Unnur Thorsteinsdottir,
13,50Kari Stefansson,
13,50Josée Dupuis,
59,61Andrew P. Morris,
3,5,144,145Michael Boehnke,
2Mark I. McCarthy,
5,31,77and Inga Prokopenko,
5,7,31for the DIAbetes Genetics Replication And
Meta-analysis (DIAGRAM) Consortium
Diabetes 2017;66:2888–2902 | https://doi.org/10.2337/db16-1253
To characterize type 2 diabetes (T2D)-associated
var-iation across the allele frequency spectrum, we
conduc-ted a meta-analysis of genome-wide association data
from 26,676 T2D case and 132,532 control subjects of
European ancestry after imputation using the 1000
Ge-nomes multiethnic reference panel. Promising association
signals were followed up in additional data sets (of 14,545
or 7,397 T2D case and 38,994 or 71,604 control subjects).
We identi
fi
ed 13 novel T2D-associated loci (
P
<
5
3
10
28),
including variants near the
GLP2R
,
GIP
, and
HLA-DQA1
genes. Our analysis brought the total number of
indepen-dent T2D associations to 128 distinct signals at 113 loci.
Despite substantially increased sample size and more
complete coverage of low-frequency variation, all novel
associations were driven by common single nucleotide
variants. Credible sets of potentially causal variants were
generally larger than those based on imputation with
ear-lier reference panels, consistent with resolution of
caus-al signcaus-als to common risk haplotypes. Strati
fi
cation of
T2D-associated loci based on T2D-related quantitative
trait associations revealed tissue-speci
fi
c enrichment of
regulatory annotations in pancreatic islet enhancers
for loci in
fl
uencing insulin secretion and in adipocytes,
monocytes, and hepatocytes for insulin action
–
associated
loci. These
fi
ndings highlight the predominant role
played by common variants of modest effect and the
diversity of biological mechanisms influencing T2D
pathophysiology.
1MRC Epidemiology Unit, University of Cambridge, Cambridge, U.K.
2Department of Biostatistics and Center for Statistical Genetics, University of
Michigan, Ann Arbor, MI
3Estonian Genome Center, University of Tartu, Tartu, Estonia
4Department of Life Sciences and Biotechnology, University of Ferrara, Ferrara,
Italy
5Wellcome Trust Centre for Human Genetics, University of Oxford, Oxford, U.K. 6Department of Genetics, Stanford University, Stanford, CA
7Department of Genomics of Common Disease, Imperial College London, London,
U.K.
8Program in Medical and Population Genetics, Broad Institute of MIT and Harvard,
Cambridge, MA
9Division of Endocrinology and Center for Basic and Translational Obesity
Re-search, Boston Children’s Hospital, Boston, MA
10Novo Nordisk Foundation Center for Basic Metabolic Research, Faculty of
Health and Medical Sciences, University of Copenhagen, Copenhagen, Denmark
11Department of Epidemiology Research, Statens Serum Institut, Copenhagen,
Denmark
12Framingham Heart Study, Population Sciences Branch, Division of Intramural
Research, National Heart, Lung, and Blood Institute, Framingham, MA
13deCODE genetics, Amgen, Inc., Reykjavik, Iceland
14Department of Epidemiology, Harvard T.H. Chan School of Public Health, Boston, MA 15Department of Nutrition, Harvard T.H. Chan School of Public Health, Boston, MA 16Channing Division of Network Medicine, Department of Medicine, Brigham and
Women’s Hospital and Harvard Medical School, Boston, MA
17Pat Macpherson Centre for Pharmacogenetics and Pharmacogenomics and
Biomedical Research Institute, Ninewells Hospital, University of Dundee, Dun-dee, U.K.
18Human Genetics Center and Department of Epidemiology, Human Genetics &
Environmental Sciences, School of Public Health, The University of Texas Health Science Center at Houston, Houston, TX
19Center for Precision Health, School Biomedical Informatics, and School of Public
Health, The University of Texas Health Science Center at Houston, Houston, TX
20Lund University Diabetes Centre and Department of Clinical Sciences Malmö,
University Hospital Scania, Lund University, Malmö, Sweden
21Department of Pharmacology, Perelman School of Medicine, University of
Penn-sylvania, Philadelphia, PA
22Department of Genetics, Perelman School of Medicine, University of Pennsylvania,
Philadelphia, PA
23Institute of Translational Medicine and Therapeutics, Perelman School of
Medi-cine, University of Pennsylvania, Philadelphia, PA
24Research Unit of Molecular Epidemiology, Helmholtz Zentrum München, German
Research Center for Environmental Health, Neuherberg, Germany
25Institute of Epidemiology II, Helmholtz Zentrum München, German Research
Center for Environmental Health, Neuherberg, Germany
26German Center for Diabetes Research, Neuherberg, Germany
27Institute of Genetic Epidemiology, Helmholtz Zentrum München, German Research
Center for Environmental Health, Neuherberg, Germany
28Department of Medicine I, University Hospital Grosshadern,
Ludwig-Maximilians-Universität, Munich, Germany
29Genetic Epidemiology, Institute of Medical Informatics, Biometry and
Epidemiol-ogy, Ludwig-Maximilians-Universität, Munich, Germany
30Munich Heart Alliance, German Centre for Cardiovascular Disease, Munich, Germany 31Oxford Centre for Diabetes, Endocrinology and Metabolism, University of Oxford,
Oxford, U.K.
32Wellcome Trust Sanger Institute, Hinxton, U.K.
33Department of Epidemiology, Erasmus University Medical Center, Rotterdam, the
Netherlands
34PolyOmica,’s-Hertogenbosch, the Netherlands
35High Throughput Biology Center, Johns Hopkins University School of Medicine,
Baltimore, MD
36Department of Epidemiology, Johns Hopkins Bloomberg School of Public Health,
Baltimore, MD
37The Charles Bronfman Institute for Personalized Medicine, Icahn School of
Med-icine at Mount Sinai, New York, NY
38The Genetics of Obesity and Related Metabolic Traits Program, Icahn School of
Medicine at Mount Sinai, New York, NY
39l’institut du thorax, INSERM, CNRS, Centre Hospitalier Universitaire de Nantes,
Université de Nantes, Nantes, France
40Lille Institute of Biology, European Genomics Institute of Diabetes, Lille, France 41CNRS UMR 8199, European Genomic Institute for Diabetes (EGID), Institut Pasteur
de Lille, University of Lille, Lille, France
42Leibniz Institute on Aging, Fritz Lipmann Institute, Jena, Germany 43Institute of Medical Systems Biology, Ulm University, Ulm, Germany
44Institute for Molecular Medicine Finland, University of Helsinki, Helsinki, Finland 45Institute for Medical Informatics, Biometry and Epidemiology, University Hospital of
Essen, Essen, Germany
46Molecular Epidemiology, Department of Medical Sciences, and Science for Life
Laboratory, Uppsala University, Uppsala, Sweden
47Cardiovascular Medicine Unit, Department of Medicine Solna, Karolinska Institutet,
Stockholm, Sweden
48Science for Life Laboratory, Stockholm, Sweden
49Department for Numerical Analysis and Computer Science, Stockholm University,
Stockholm, Sweden
50Faculty of Medicine, University of Iceland, Reykjavik, Iceland 51Landspítali University Hospital, Reykjavik, Iceland 52Icelandic Heart Association, Kópavogur, Iceland
Type 2 diabetes (T2D) has rapidly increased in prevalence
in recent years and represents a major component of the
global disease burden (1). Previous efforts to use
genome-wide association studies (GWAS) to characterize the genetic
component of T2D risk have largely focused on common
variants (minor allele frequency [MAF]
.
5%). These studies
have identi
fi
ed close to 100 loci, almost all of them
cur-rently de
fi
ned by common alleles associated with
mod-est (typically 5–20%) increases in T2D risk (2–6). Direct
sequencing of whole genomes or exomes offers the most
comprehensive approach for extending discovery efforts to
the detection of low-frequency (0.5%
,
MAF
,
5%) and
rare (MAF
,
0.5%) risk and protective alleles, some of
which might have greater impact on individual
predisposi-tion. However, extensive sequencing has thus far been
lim-ited to relatively small sample sizes (at most, a few thousand
cases), restricting power to detect rarer risk alleles even if they
are of large effect (7–9). Although evidence of rare variant
associations has been detected in some candidate gene
stud-ies (10,11), the largest study to date, involving exome
se-quencing in
;13,000 subjects, found little trace of rare
variant association effects (9).
56Department of Endocrinology and Diabetology, Medical Faculty, Heinrich-Heine
Uni-versity, Düsseldorf, Germany
57Institute for Clinical Diabetology, German Diabetes Center, Leibniz Institute for
Di-abetes Research at Heinrich-Heine University Düsseldorf, Düsseldorf, Germany
58Division of Genetics and Endocrinology, Boston Children’s Hospital, Boston, MA 59Framingham Heart Study, National Heart, Lung, and Blood Institute,
Framing-ham, MA
60Division of Endocrinology, Diabetes and Hypertension, Brigham and Women’s
Hospital and Harvard Medical School, Boston, MA
61Department of Biostatistics, Boston University School of Public Health, Boston, MA 62Data Coordinating Center, Boston University School of Public Health, Boston, MA 63Folkhälsan Research Center, Helsinki, Finland
64Department of Social Services and Health Care, Jakobstad, Finland
65Department of Medicine, Helsinki University Hospital, University of Helsinki,
Hel-sinki, Finland
66Collaborative Studies Coordinating Center, Department of Biostatistics, University
of North Carolina at Chapel Hill, Chapel Hill, NC
67Division of Epidemiology & Community Health, University of Minnesota,
Minne-apolis, MN
68Steno Diabetes Center, Gentofte, Denmark
69Research Centre for Prevention and Health, Capital Region of Denmark,
Copen-hagen, Denmark
70Faculty of Health and Medical Sciences, University of Copenhagen, Copenhagen,
Denmark
71Faculty of Medicine, Aalborg University, Aalborg, Denmark
72Rigshospitalet, Copenhagen University Hospital, Copenhagen, Denmark 73Department of Clinical Medicine, Faculty of Health and Medical Sciences,
Univer-sity of Copenhagen, Denmark
74Department of Preventive Medicine, Northwestern University Feinberg School of
Medicine, Chicago, IL
75Saw Swee Hock School of Public Health, National University of Singapore,
Sin-gapore, Singapore
76Program in Genetic Epidemiology and Statistical Genetics, Harvard T.H. Chan
School of Public Health, Boston, MA
77National Institute for Health Research Oxford Biomedical Research Centre,
Churchill Hospital, Oxford, U.K.
78Genetics of Complex Traits, University of Exeter Medical School, University of
Exeter, Exeter, U.K.
79National Human Genome Research Institute, National Institutes of Health,
Be-thesda, MD
80Department of Health, National Institute for Health and Welfare, Helsinki, Finland 81Endocrinology, Department of Medicine and Abdominal Center, University of
Helsinki and Helsinki University Central Hospital, Helsinki, Finland
82Minerva Foundation Institute for Medical Research, Biomedicum Helsinki 2U,
Helsinki, Finland
83Institute of Human Genetics, University of Bonn, Bonn, Germany
84Department of Genomics, Life & Brain Center, University of Bonn, Bonn, Germany 85Centro Cardiologico Monzino, Istituto di Ricovero e Cura a Carattere Scientifico,
Milan, Italy
86Dipartimento di Scienze Farmacologiche e Biomolecolari, Università di Milano,
Milan, Italy
87Cardiovascular Genetics, BHF Laboratories, Institute Cardiovascular Sciences,
University College London, London, U.K.
88Hannover Unified Biobank, Hannover Medical School, Hannover, Germany 89Department of Clinical Chemistry and Central Laboratory, University of Ulm, Ulm,
Germany
90Department of Internal Medicine, Erasmus University Medical Center, Rotterdam,
the Netherlands
91Department of Chronic Disease Prevention, National Institute for Health and
Welfare, Helsinki, Finland
92Department of General Practice and Primary Health Care, University of Helsinki,
Helsinki, Finland
93Unit of General Practice, Helsinki University Central Hospital, Helsinki, Finland 94Broad Institute of MIT and Harvard, Cambridge, MA
95Department of Public Health, Hjelt Institute, University of Helsinki, Helsinki,
Finland
96Endocrinology-Diabetology Unit, Corbeil-Essonnes Hospital,
Corbeil-Es-sonnes, France
97Division of Cardiovascular Epidemiology, Institute of Environmental
Medi-cine, Karolinska Institutet, Stockholm, Sweden
98Division of Psychiatric Genomics, Department of Psychiatry, Icahn School
of Medicine at Mount Sinai, New York, NY
99IFB AdiposityDiseases, University of Leipzig, Leipzig, Germany 100Department of Medicine, University of Leipzig, Leipzig, Germany 101Division of General Internal Medicine, Department of Medicine, Johns
Hopkins Bloomberg School of Medicine, Baltimore, MD
102The Welch Center for Prevention, Epidemiology and Clinical Research,
Johns Hopkins University, Baltimore, MD
103William Harvey Research Institute, Barts and The London School of
Med-icine and Dentistry, Queen Mary University London, London, U.K.
104Department of Statistics, University of Oxford, Oxford, U.K.
105Institute of Biomedical and Clinical Science, University of Exeter Medical
School, Exeter, U.K.
106Public Health Genomics Unit, National Institute for Health and Welfare,
Helsinki, Finland
107Department of Medical Epidemiology and Biostatistics, Karolinska
Insti-tutet, Stockholm, Sweden
108Division of Endocrinology and Diabetes, Department of Internal Medicine,
University Medical Centre Ulm, Ulm, Germany
109Lee Kong Chian School of Medicine, Imperial College London and Nanyang
Technological University, Singapore, Singapore
110Diabetes and Obesity Research Institute, Cedars-Sinai Medical Center,
Los Angeles, CA
111Department of Genetics, University of North Carolina, Chapel Hill, NC 112Dasman Diabetes Institute, Dasman, Kuwait
Here, we implement a complementary strategy that
makes use of imputation into existing GWAS samples
from the DIAbetes Genetics Replication And Meta-analysis
(DIAGRAM) Consortium with sequence-based reference
panels (12). This strategy allows the detection of common and
low-frequency (but not rare) variant associations in extremely
large samples (13) and facilitates the
fi
ne-mapping of causal
variants. We performed a European ancestry meta-analysis
of GWAS with 26,676 T2D case and 132,532 control
sub-jects, and we followed up our
fi
ndings in additional
inde-pendent European ancestry studies of 14,545 T2D case and
38,994 control subjects genotyped using the Metabochip
(4). All contributing studies were imputed against the March
2012 multiethnic 1000 Genomes Project (1000G) reference
panel of 1,092 whole-genome–sequenced individuals (12).
Our study provides near-complete evaluation of common
variants with much improved coverage of low-frequency
var-iants, and the combined sample size considerably exceeds that
of the largest previous T2D GWAS meta-analyses in
individ-uals of European ancestry (4). In addition to genetic
discov-ery, we
fi
ne-mapped novel and established T2D-associated
loci to identify regulatory motifs and cell types enriched for
potential causal variants, as well as pathways through which
T2D-associated loci increase disease susceptibility.
RESEARCH DESIGN AND METHODS
Research Participants
The DIAGRAM stage 1 meta-analyses comprises 26,676
T2D case and 132,532 control subjects (effective sample
size
N
eff= 72,143 individuals, de
fi
ned as 4/[(1/
N
cases) +
(1/
N
controls)]) from 18 studies genotyped using commercial
genome-wide single nucleotide variant (SNV) arrays
(Sup-plementary Table 1). The Metabochip stage 2 follow-up
comprises 14,545 T2D case and 38,994 control subjects
(
N
eff= 38,645) from 16 nonoverlapping stage 1 studies
(4,14). We performed additional follow-up in 2,796 T2D
case and 4,601 control subjects from the European
Pro-spective Investigation into Cancer and Nutrition-InterAct
(EPIC-InterAct) study (15) and in 9,747 T2D case and
61,857 control subjects from the Resource for Genetic
Ep-idemiology on Adult Health and Aging (GERA) study (16)
(Supplementary Material).
Statistical Analyses
We imputed autosomal and X chromosome SNVs using
the all-ancestries 1000G reference panel (1,092 individuals
from Africa, Asia, Europe, and the Americas [March 2012
re-lease]) using minimac (17) or IMPUTE2 (18). After
imputa-tion, from each study we removed monomorphic variants
or those with imputation quality
r
2-hat
,
0.3 (minimac) or
proper-info
,
0.4 (IMPUTE2, SNPTEST). Each study
per-formed T2D association analysis using logistic regression,
adjusting for age, sex, and principal components for
ances-try, under an additive genetic model. We performed
in-verse-variance weighted
fi
xed-effect meta-analyses of the
18 stage 1 GWAS (Supplementary Table 1). Fifteen of the
18 studies repeated analyses also adjusting for BMI. SNVs
reaching suggestive signi
fi
cance
P
,
10
25in the stage
1 meta-analysis were followed up. Novel loci were selected
116University of Cambridge Metabolic Research Laboratories and National Institute
for Health Research Cambridge Biomedical Research Centre, Wellcome Trust-MRC Institute of Metabolic Science, Addenbrooke’s Hospital Cambridge, Cambridge, U.K.
117Department of Public Health and Caring Sciences, Uppsala University, Uppsala, Sweden 118Division of Cardiovascular Medicine, Department of Medicine, Stanford University School
of Medicine, Stanford, CA
119Cardiovascular Epidemiology, Department of Medical Sciences, Uppsala University
Hos-pital, Uppsala, Sweden
120The Mindich Child Health and Development Institute, Icahn School of Medicine at Mount
Sinai, New York, NY
121INSERM, CESP, UMR 1018, Villejuif, France 122University of Paris-Sud, UMR 1018, Villejuif, France
123German Institute of Human Nutrition Potsdam-Rehbruecke, Nuthetal, Germany 124Lund University, Malmö, Sweden
125Umeå University, Umeå, Sweden
126Navarra Public Health Institute, Pamplona, Spain 127Navarra Institute for Health Research, Pamplona, Spain 128CIBER Epidemiology and Public Health, Madrid, Spain 129Cancer Research and Prevention Institute, Florence, Italy 130University Medical Center Utrecht, Utrecht, the Netherlands
131Center for Human Genetic Research, Massachusetts General Hospital, Boston, MA 132Department of Medicine, Harvard Medical School, Boston, MA
133Department of Genetics, Harvard Medical School, Boston, MA 134Department of Molecular Biology, Harvard Medical School, Boston, MA 135Diabetes Unit, Massachusetts General Hospital, Boston, MA
136Netherlands Genomics Initiative, Netherlands Consortium for Healthy Ageing and Center
for Medical Systems Biology, Rotterdam, the Netherlands
137Diabetes Unit and Center for Human Genetic Research, Massachusetts General Hospital,
Boston, MA
138General Medicine Division, Massachusetts General Hospital, Boston, MA
139Human Genetics Center, The University of Texas Health Science Center at Houston,
Houston, TX
140Human Genome Sequencing Center, Baylor College of Medicine, Houston, TX 141Institute of Molecular and Cell Biology, University of Tartu, Tartu, Estonia
142Usher Institute of Population Health Sciences and Informatics, The University of
Edin-burgh, EdinEdin-burgh, U.K.
143Cardiovascular and Diabetes Medicine, Biomedical Research Institute, Ninewells Hospital,
University of Dundee, Dundee, U.K.
144Department of Biostatistics, University of Liverpool, Liverpool, U.K.
145Department of Molecular and Clinical Pharmacology, University of Liverpool, Liverpool,
U.K.
Corresponding authors: Inga Prokopenko, [email protected], Mark I. McCarthy, [email protected], and Michael Boehnke, boehnke@umich .edu.
Received 27 October 2016 and accepted 21 May 2017.
This article contains Supplementary Data online at http://diabetes .diabetesjournals.org/lookup/suppl/doi:10.2337/db16-1253/-/DC1.
R.A.S., L.J.S., R.M., L.M., K.J.G., and M.K. contributed equally to this work. A.P.M., M.Bo., M.I.M., and I.P. jointly directed this research.
†Deceased.
© 2017 by the American Diabetes Association. Readers may use this article as long as the work is properly cited, the use is educational and not for profit, and the work is not altered. More information is available at http://www.diabetesjournals .org/content/license.
using the threshold for genome-wide signi
fi
cance (
P
,
5
3
10
28) in the combined stage 1 and stage 2 meta-analysis.
For the 23 variants with no proxy (
r
2$
0.6) available in
Metabochip with 1000G imputation in the
fi
ne-mapping
regions, the stage 1 result was followed up in EPIC-InterAct
and GERA (
N
eff= 40,637), both imputed to 1000G variant
density (Supplementary Material). Summary-level
statis-tics from the stage 1 GWAS meta-analysis are available
online at http://diagram-consortium.org/downloads.html.
Approximate Conditional Analysis With GCTA
We performed approximate conditional analysis in the stage
1 sample using GCTA v1.24 (19,20). We analyzed SNVs in
the 1-Mb window around each lead variant, conditioning
on the lead SNV at each locus (Supplementary Material)
(21). We considered loci to contain multiple distinct signals
if multiple SNVs reached locus-wide signi
fi
cance (
P
,
10
25), accounting for the approximate number of variants
in each 1-Mb window (14).
Fine-Mapping Analyses Using Credible Set Mapping
To identify 99% credible sets of causal variants for each
distinct association signal, we performed
fi
ne-mapping for
loci at which the lead independent SNV reached
P
,
5
3
10
24in the stage 1 meta-analysis. We performed
cred-ible set mapping using the T2D stage 1 meta-analysis
re-sults to obtain the minimal set of SNVs with cumulative
posterior probability
.
0.99 (Supplementary Material).
Type 1 Diabetes/T2D Discrimination Analysis
Given the overlap between loci previously associated with
type 1 diabetes (T1D) and the associated T2D loci, we used
an inverse-variance weighted Mendelian randomization
approach (22) to test whether this was likely to re
fl
ect
mis-classi
fi
cation of T1D case subjects as individuals with T2D
in the current study (Supplementary Material).
Expression Quantitative Trait Locus Analysis
To look for potential biological overlap of T2D lead variants
and expression quantitative trait locus (eQTL) variants, we
extracted the lead (most signi
fi
cantly associated) eQTL for
each tested gene from existing data sets for a range of
tissues (Supplementary Material). We concluded that a lead
T2D SNV showed evidence of association with gene
expres-sion if it was in high linkage disequilibrium (LD) (
r
2.
0.8)
with the lead eQTL SNV (
P
,
5
3
10
26).
Hierarchical Clustering of T2D-Related Metabolic
Phenotypes
Starting with the associated SNVs, we obtained
T2D-related quantitative trait
z
scores from published
HapMap-based GWAS meta-analysis for the following: fasting
glucose, fasting insulin adjusted for BMI, HOMA for
b-cell function, and HOMA for insulin resistance (23);
2-h glucose adjusted for BMI (24); proinsulin (25); corrected
insulin response (CIR) (26); BMI (27); and HDL cholesterol,
LDL cholesterol, total cholesterol, and triglycerides (28).
When an association result for an SNV was not available,
we used the results for the variant in highest LD and only
for variants with
r
2.
0.6. We performed clustering of
phe-notypic effects using
z
scores for association with T2D risk
alleles and standard methods (Supplementary Material) (29).
Functional Annotation and Enrichment Analysis
We tested for enrichment of genomic and epigenomic
annotations using chromatin states for 93 cell types (after
excluding cancer cell lines) from the National Institutes of
Health (NIH) Roadmap Epigenomics Project, as well as
binding sites for 165 transcription factors from the
Encyclopedia of DNA Elements (ENCODE) project (30)
and Pasquali et al. (31). Using fractional logistic regression,
we then tested for the effect of variants with each cell type
and transcription factor annotation on the variant posterior
probabilities (
p
c) using all variants within 1 Mb of the lead
SNV for each distinct association signal from the
fi
ne-mapping
analyses (Supplementary Material). In each analysis, we
con-sidered an annotation signi
fi
cant if it reached a
Bonferroni-corrected
P
,
1.9
3
10
24(i.e., 0.05/258 annotations).
Pathway Analyses With DEPICT
We used the Data-driven Expression Prioritized Integration
for Complex Traits (DEPICT) tool (32) to
1
) prioritize genes
that may represent promising candidates for T2D
patho-physiology and
2
) identify reconstituted gene sets that are
enriched in genes from associated regions and might be
related to T2D biological pathways. As input, we used
in-dependent SNVs from the stage 1 meta-analysis SNVs with
P
,
10
25and lead variants at established loci
(Supplemen-tary Material). For the calculation of empirical enrichment
P
values, we used 200 sets of SNVs randomly drawn from
entire genome within regions matching by gene density; we
performed 20 replications for false discovery rate (FDR)
estimation. Supplementary tables, supplementary material,
and DEPICT analyses are available online at
http://diagram-consortium.org/2017_Scott_DIAGRAM_1000G/.
RESULTS
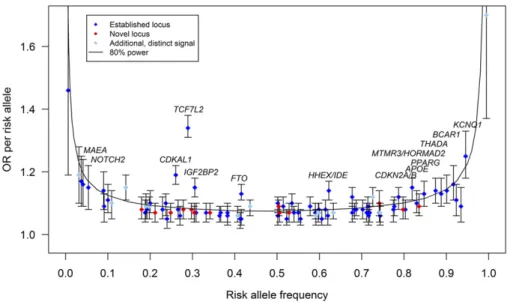
Novel Loci Detected in T2D GWAS and
Metabochip-Based Follow-up
The stage 1 GWAS meta-analysis included 26,676 T2D case
and 132,532 control subjects and evaluated 12.1 million
SNVs, of which 11.8 million were autosomal and 260,000
mapped to the X chromosome. Of these, 3.9 million
var-iants had MAF between 0.5 and 5%, a near
fi
fteen-fold
increase in the number of low-frequency variants tested for
association compared with previous array-based T2D GWAS
meta-analyses (2,4) (Supplementary Table 2). Of the 52
sig-nals showing promising evidence of association (
P
,
10
25)
in stage 1, 29 could be followed up in the stage 2
Metab-ochip data. In combined stage 1 and stage 2 data, 13 novel
loci were detected at genome-wide signi
fi
cance (Table 1, Fig. 1,
Supplementary Fig. 1A–
D
, and Supplementary Table 3).
captured by variants in the HapMap CEU (Central EUrope)
reference panel (two directly, 10 via proxies with
r
2.
0.8,
and one via proxy with
r
2= 0.62) (Supplementary Material).
At all 13, lead variants de
fi
ned through 1000G and those
seen when the SNP density was restricted to HapMap
con-tent had broadly similar evidence of association and were of
similar frequency (Supplementary Fig. 2 and Supplementary
Table 3). Throughout this article, loci are named for the
gene nearest to the lead SNV, unless otherwise speci
fi
ed
(Table 1 and Supplementary Material).
Adjustment for BMI revealed no additional genome-wide
signi
fi
cant associations for T2D and, at most known and
novel loci, there were only minimal differences in
statisti-cal signi
fi
cance and estimated T2D effect size between
BMI-adjusted and unadjusted models. The four signals at
which we observed a signi
fi
cant effect of BMI adjustment
(
P
heterogeneity,
4.4
3
10
24; based on 0.05/113 variants
currently or previously reported to be associated with
T2D at genome-wide signi
fi
cance) were
FTO
and
MC4R
(at which the T2D association is known to re
fl
ect a primary
effect on BMI) and
TCF7L2
and
SLC30A8
(at which T2D
associations were strengthened after BMI-adjustment)
(Supplementary Fig. 3 and Supplementary Table 4).
Insights Into Genetic Architecture of T2D
In this meta-analysis, we tested 3.9 million low-frequency
variants (
r
2$
0.3 or proper-info
$
0.4; minor allele present
in
$3 studies) for T2D association, constituting 96.7% of
the low-frequency variants ascertained by the 1000G
Euro-pean panel (March 2012) (Supplementary Table 2). For
variants with risk allele frequencies (RAF) of 0.5%, 1%, or
5%, we had 80% power to detect association (
P
,
5
3
10
28) for allelic odds ratios (ORs) of 1.80, 1.48, and 1.16,
respectively, after accounting for imputation quality (Fig. 1
and Supplementary Table 5). Despite the increased coverage
and sample size, we identi
fi
ed no novel low-frequency
var-iants at genome-wide signi
fi
cance (Fig. 1).
Since we had only been able to test 29 of the 52
pro-mising stage 1 signals on the Metabochip, we investigated
whether this failure to detect low-frequency variant
as-sociations with T2D could be a consequence of selective
variant inclusion on the Metabochip. Among the remaining
23 variants, none reached genome-wide signi
fi
cance after
aggregating with GWAS data available from EPIC-InterAct.
Six of these 23 SNVs had MAF
,
5%, and for these we
performed additional follow-up in the GERA study.
How-ever, none reached genome-wide signi
fi
cance in a
com-bined analysis of stage 1, EPIC-InterAct, and GERA (a
total of 39,219 case and 198,990 control subjects)
(Supple-mentary Table 6). Therefore, despite substantially enlarged
sample sizes that would have allowed us to detect
low-frequency risk alleles with modest effect sizes, the
overwhelm-ing majority of variants for which T2D association can be
detected with these sample sizes are themselves common.
To identify loci containing multiple distinct signals, we
performed approximate conditional analysis within the
established and novel GWAS loci and detected two such
novel common variant signals (Supplementary Table 7)
(19,20). At the
ANKRD55
locus, we identi
fi
ed a previously
unreported distinct (
P
conditional,
10
25) association signal
led by rs173964 (
P
conditional= 3.54
3
10
27, MAF = 26%)
(Supplementary Table 7 and Supplementary Fig. 4). We also
observed multiple signals of association at loci with
previ-ous reports of such signals (4,14), including
CDKN2A/B
(three signals in total),
DGKB
and
KCNQ1
(six signals),
and
HNF4A
and
CCND2
(three signals) (Supplementary
Ta-ble 7 and Supplementary Fig. 4). At
CCND2
, in addition to
the main signal with lead SNV rs4238013, we detected
1
) a
novel distinct signal led by a common variant, rs11063018
(
P
conditional= 2.70
3
10
27
, MAF = 19%) and
2
) a third
distinct signal led by a low-frequency protective allele
(rs188827514, MAF = 0.6%; OR
conditional= 0.60,
P
conditional=
1.24
3
10
26) (Supplementary Fig. 5A and Supplementary
Table 7), which represents the same distinct signal as that
at rs76895963 (
P
conditional= 1.0) reported in the Icelandic
population (Supplementary Fig. 5
B
) (7). At
HNF4A,
we
con-fi
rmed recent analyses (obtained in partially
overlap-ping data) (14) that a low-frequency missense variant
(rs1800961, p.Thr139Ile, MAF = 3.7%) is associated with
T2D and is distinct from the known common variant
GWAS signal (which we mapped here to rs12625671).
We evaluated the trans-ethnic heterogeneity of allelic
effects (i.e., discordance in the direction and/or magnitude
of estimated ORs) at novel loci on the basis of Cochran’s
Q
statistics from the largest T2D trans-ancestry GWAS
meta-analysis to date (2). Using reported summary statistics from
that study, we observed no signi
fi
cant evidence of
hetero-geneity of effect size (Bonferroni correction
P
Cochran’s Q,
0.05/13 = 0.0038) between major ancestral groups at any of
the 13 loci (Supplementary Table 8). These results are
con-sistent with these loci being driven by common causal
var-iants that are widely distributed across populations.
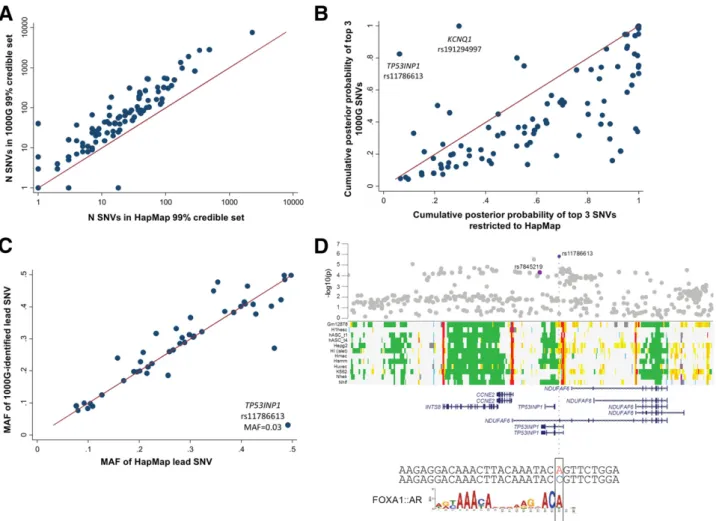
1000G Variant Density for Identi
fi
cation of Potentially
Causal Genetic Variants
We used credible set
fi
ne-mapping (33) to investigate
whether 1000G imputation allowed us to better resolve
the speci
fi
c variants driving 95 distinct T2D association
signals at 82 loci (Supplementary Material). The 99%
cred-ible sets included between 1 and 7,636 SNVs; 25 included
fewer than 20 SNVs, 16 fewer than 10 (Supplementary
Tables 9 and 10). We compared 1000G-based credible sets
with those constructed from HapMap SNVs alone (Fig. 2
B
and Supplementary Table 9). At all but three of the
associ-ation signals (two at
KCNQ1
and rs1800961 at
HNF4A
),
1000G imputation resulted in larger credible sets (median
increase of 34 variants) spanning wider genomic intervals
(median interval size increase of 5 kb) (Fig. 2
B
and
Supple-mentary Table 9). The 1000G-de
fi
ned credible sets
in-cluded
.
85% of the SNVs in the corresponding HapMap
sets (Supplementary Table 9). Despite the overall larger
credible sets, we asked whether 1000G imputation enabled
an increase in the posterior probability afforded to the lead
Within the 50 loci previously associated with T2D in
Europeans (4), which had at least modest evidence of
asso-ciation in the current analyses (
P
,
5
3
10
24), we asked
whether the lead SNV in 1000G-imputed analysis was of
similar frequency to that observed in HapMap
analy-ses. Only at
TP53INP1
was the most strongly associated
1000G-imputed SNV (rs11786613, OR = 1.21,
P
= 1.6
3
10
26, MAF = 3.2%) of substantially lower frequency than
the lead HapMap-imputed SNV (3) (rs7845219, MAF =
47.7%) (Fig. 2
A
). rs11786613 was neither present in
HapMap nor on the Metabochip (Supplementary Fig. 6).
Reciprocal conditioning of this low-frequency SNV and
the previously identi
fi
ed common lead SNV (rs7845219,
OR = 1.05,
P
= 5.0
3
10
25, MAF = 47.5%) indicated that
the two signals were likely to be distinct but the signal at
rs11786613 did not meet our threshold (
P
conditional,
10
25
)
for locus-wide signi
fi
cance (Supplementary Fig. 4).
Pathophysiological Insights From Novel
T2D Associations
Among the 13 novel T2D-associated loci, many (such as
those near
HLA-DQA1
,
NRXN3
,
GIP
,
ABO
, and
CMIP
)
in-cluded variants previously implicated in predisposition to
other diseases and traits (
r
2.
0.6 with the lead SNV)
(Supplementary Table 3 and Supplementary Material). For
example, the novel association at SNV rs1182436 lies
;
120 kb upstream of
MNX1
, a gene implicated in
pancre-atic hypoplasia and neonatal diabetes (34–36).
The lead SNV rs78761021 at the
GLP2R
locus, encoding
the receptor for glucagon-like peptide 2, is in strong LD
(
r
2= 0.87) with a common missense variant in
GLP2R
(rs17681684, D470N,
P
= 3
3
10
27). These signals were
strongly dependent and mutually extinguished in reciprocal
conditional analyses, consistent with the coding variant
be-ing causal and implicatbe-ing
GLP2R
as the putative causal
gene (Supplementary Fig. 7). While previously suggested
to regulate energy balance and glucose tolerance (37),
GLP2R has primarily been implicated in gastrointestinal
function (38,39). In contrast,
GLP1R
, encoding the
gluca-gon-like peptide 1 receptor (the target for a major class of
T2D therapies [40]), is more directly implicated in
pancre-atic islet function, and variation at this gene has been
as-sociated with glucose levels and T2D risk (41).
We also observed associations with T2D centered on
rs9271774 near
HLA-DQA1
(Table 1), a region showing a
particularly strong association with T1D (42). There is
con-siderable heterogeneity within, and overlap between, the
clinical presentations of T1D and T2D, but these can
be partially resolved through measurement of islet cell
autoantibodies (43). Such measures were not uniformly
available across studies contributing to our meta-analysis
(Supplementary Table 1). We therefore considered whether
the adjacency between T1D and T2D risk loci was likely to
re
fl
ect misclassi
fi
cation of individuals with autoimmune
di-abetes as case subjects in the current study.
Three lines of evidence make this unlikely. First, the lead
T1D-associated SNV in the HLA region (rs6916742)
was only weakly associated with T2D in the current
study (
P
= 0.01), and conditioning on this variant had only
modest impact on the T2D association signal at rs9271774
(
P
unconditional= 3.3
3
10
27;
P
conditional= 9.1
3
10
26).
Sec-ond, of 52 published genome-wide signi
fi
cant T1D association
GWAS signals, 50 were included in the current analysis: only
six of these reached even nominal association with T2D (
P
,
0.05; Supplementary Fig. 8), and at one of these six
(
BCAR1
), the T1D risk allele was protective for T2D. Third,
in genetic risk score analyses, the combined effect of these
50 T1D signals on T2D risk was of only nominal
signif-icance (OR = 1.02 [95% CI 1.00
–
1.03],
P
= 0.026), and
signi
fi
cance was eliminated when the six overlapping loci
were excluded (OR = 1.00 [95% CI 0.98
–
1.02],
P
= 0.73). In
combination, these
fi
ndings argue against substantial
mis-classi
fi
cation and indicate that the signal at
HLA-DQA1
is
likely to be a genuine T2D signal.
Potential Genes and Pathways Underlying the T2D Loci:
eQTL and Pathway Analysis
cis
-eQTLs analyses highlighted four genes as possible
effec-tor transcripts:
ABO
(pancreatic islets),
PLEKHA1
(whole
blood), and
HSD17B12
(adipose, liver, muscle, whole blood)
at the respective loci and
HLA-DRB5
expression (adipose,
pancreatic islets, whole blood) at the
HLA-DQA1
locus
(Sup-plementary Table 11).
We next asked whether large-scale gene expression data,
mouse phenotypes, and protein–protein interaction
net-works could implicate speci
fi
c gene candidates and gene
sets in the etiology of T2D. Using DEPICT (32), 29 genes
were prioritized as driving observed associations (FDR
,
0.05), including
ACSL1
and
CMIP
among the genes
map-ping to the novel loci (Supplementary Table 12). These
analyses also identi
fi
ed 20 enriched reconstituted gene sets
(FDR
,
5%) falling into four groups (Supplementary Fig. 9)
(complete results, including gene prioritization, can be
downloaded from http://diagram-consortium.org/2017_
Scott_DIAGRAM_1000G/). These included pathways
re-lated to mammalian target of rapamycin (mTOR) based
on coregulation of the
IDE, TLE1, SPRY2, CMIP
, and
MTMR3
genes (44).
Figure 2—A: The number (N) of SNVs included in 99% credible sets when performed on all SNVs compared with when analyses were restricted to those SNVs present in HapMap.B: The cumulativepcof the top three SNVs among all 1000G SNVs and after restriction to HapMap SNVs is
Overlap of Associated Variants With Regulatory
Annotations
We observed signi
fi
cant enrichment for T2D-associated
credible set variants in pancreatic islet active enhancers
and/or promoters (log odds [b] = 0.74,
P
= 4.2
3
10
28)
and FOXA2 binding sites (b
= 1.40,
P
= 4.1
3
10
27), as
previously reported (Supplementary Table 13) (14). We also
observed enrichment for T2D-associated variants in coding
exons (b
= 1.56,
P
= 7.9
3
10
25), in EZH2-binding sites
across many tissues (b
= 1.35,
P
= 5.3
3
10
26), and in
binding sites for NKX2.2 (b
= 1.73,
P
= 4.1
3
10
28) and
PDX1 (b
= 1.46,
P
= 7.4
3
10
26) in pancreatic islets
(Sup-plementary Fig. 10).
Even though credible sets were generally larger, analyses
performed on the 1000G imputed results produced
stron-ger evidence of enrichment than equivalent analyses
re-stricted to SNVs present in HapMap. This was most notably
the case for variants within coding exons (b
= 1.56,
P
=
7.9
3
10
25in 1000G compared with
b
= 0.68,
P
= 0.62 in
HapMap) and likely re
fl
ects more complete capture of the
true causal variants in the more densely imputed credible
sets. Single lead SNVs overlapping an enriched annotation
accounted for the majority of the total posterior
prob-ability (
p
c.
0.5) at seven loci. For example, the lead SNV
(rs8056814) at
BCAR1
(
p
c= 0.57) overlaps an islet
en-hancer (Supplementary Fig. 11
A
), while the newly
identi-fi
ed low-frequency signal at
TP53INP1
overlaps an islet
promoter element (rs117866713,
p
c= 0.53) (Fig. 2
D
)
(31).
We applied hierarchical clustering to the results of
diabetes-related quantitative trait associations for the
set of T2D-associated loci from the current study,
identify-ing three main clusters of association signals with differidentify-ing
impact on quantitative traits (Supplementary Table 9). The
fi
rst, including
GIPR
,
C2CDC4A
,
CDKAL1
,
GCK
,
TCF7L2
,
GLIS3
,
THADA
,
IGF2BP2
, and
DGKB
, involved loci with a
primary impact on insulin secretion and processing (26,29).
The second cluster captured loci (including
PPARG
,
KLF14
,
and
IRS1
) disrupting insulin action. The third cluster,
show-ing marked associations with BMI and lipid levels, included
NRXN3
,
CMIP
,
APOE
, and
MC4R
but not
FTO
, which
clus-tered alone.
In regulatory enhancement analyses, we observed strong
tissue-speci
fi
c enrichment patterns broadly consistent with
the phenotypic characteristics of the physiologically
strat-i
fi
ed locus subsets. The cluster of loci disrupting insulin
secretion showed the most marked enrichment for
pancre-atic islet regulatory elements (
b
= 0.91,
P
= 9.5
3
10
25). In
contrast, the cluster of loci implicated in insulin action was
enriched for annotations from adipocytes (b
= 1.3,
P
=
2.7
3
10
211) and monocytes (b
= 1.4,
P
= 1.4
3
10
212),
and that characterized by associations with BMI and lipids
showed preferential enrichment for hepatic annotations
(b
= 1.15,
P
= 5.8
3
10
24) (Fig. 3
A
–
C
). For example, at
the novel T2D-associated
CMIP
locus, previously associated
with adiposity and lipid levels (28,45), the lead SNV
(rs2925979,
p
c= 0.91) overlaps an active enhancer element
in both liver and adipose tissue, among others
(Supplemen-tary Fig. 11
B
).
DISCUSSION
In this large-scale study of T2D genetics, in which individual
variants were assayed in up to 238,209 subjects, we
identi-fi
ed 13 novel T2D-associated loci at genome-wide signi
fi
-cance and re
fi
ned causal variant location for the 13 novel
and 69 established T2D loci. We also found evidence for
enrichment in regulatory elements at associated loci in
tissues relevant for T2D and demonstrated tissue-speci
fi
c
enrichment in regulatory annotations when T2D loci were
strati
fi
ed according to inferred physiological mechanism.
We calculate that the present analysis, together with loci
reported in other recent publications (9), brings the total
number of independent T2D associations to 128 distinct
signals at 113 loci (Supplementary Table 3). Lead SNVs at
all 13 novel loci were common (MAF
.
15%) and of
com-parable effect size (1.07
#
OR
#
1.10) to previously
iden-ti
fi
ed common variant associations (2,4). Associations at
the novel loci showed homogeneous effects across diverse
ethnicities, supporting the evidence for coincident common
risk alleles across ancestry groups (2). Moreover, we
con-clude that misclassi
fi
cation of diabetes subtype is not a
major concern for these analyses and that the
HLA-DQA1
signal represents genuine association with T2D,
indepen-dent of nearby signals that in
fl
uence T1D.
We observed a general increase in the size of credible
sets with 1000G imputation compared with HapMap
im-putation. This is likely due to improved enumeration of
potential causal common variants on known risk haplotypes
rather than resolution toward low-frequency variants of
larger effect driving common variant associations. These
fi
ndings are consistent with the inference (arising also from
the other analyses reported here) that the T2D risk signals
identi
fi
ed by GWAS are overwhelmingly driven by common
causal variants. In such a setting, imputation with denser
reference panels, at least in ethnically restricted samples,
provides more complete elaboration of the allelic content of
common risk haplotypes. Finer resolution of those
haplo-types that would provide greater con
fi
dence in the location
of causal variants will likely require further expansion of
trans-ethnic
fi
ne-mapping efforts (2). The distinct signals at
the established
CCND2
and
TP53INP1
loci point to
contri-butions of low-frequency variant associations of modest
effect but indicate that even larger samples will be required
to robustly detect association signals at low frequency. Such
new large data sets might be used to expand the follow-up
of suggestive signals from our analysis.
The discovery of novel genome-wide signi
fi
cant
associ-ation signals in the current analysis is attributable primarily
to increased sample size rather than improved genomic
coverage. Although we queried a large proportion of the
low-frequency variants present in the 1000G European
reference haplotypes and had
.
80% power to detect
tested frequency risk variants, we found no such
low-frequency variant associations in either established or novel
loci. While low-frequency variant coverage in the current
study was not complete, this observation adds to the
grow-ing evidence (2,4,9,46) that few low-frequency T2D risk
variants with moderate to strong effect sizes exist in
European ancestry samples and is consistent with a
primary role for common variants of modest effect in
T2D risk. The current study reinforces the conclusions
from a recent study that imputed from whole-genome
sequencing data—from 2,657 European T2D case and
control subjects rather than 1000G—into a set of GWAS
studies partially overlapping with the present meta-analysis.
We demonstrated that the failure to detect low-frequency
associations in that study is not overcome by a substantial
increase in sample size (9). It is worth emphasizing that we
did not, in this study, have suf
fi
cient imputation quality to
test for T2D associations with rare variants and we cannot
evaluate the collective contribution of variants with MAF
,
0.5% to T2D risk.
The development of T2D involves dysfunction of multiple
mechanisms across several distinct tissues (9,29,31,47,48).
When coupled with functional data, we saw larger effect
estimates for enrichment of coding variants than observed
with HapMap SNVs alone, consistent with more complete
recovery of the causal variants through imputation using a
denser reference panel. The functional annotation analyses
also demonstrated that the strati
fi
cation of T2D risk loci
according to primary physiological mechanism resulted in
evidence for consistent and appropriate tissue-speci
fi
c
ef-fects on transcriptional regulation. These analyses
exem-plify the use of a combination of human physiology and
genomic annotation to position T2D GWAS loci with
re-spect to the cardinal mechanistic components of T2D
de-velopment. Extension of this approach is likely to provide a
valuable in silico strategy to aid prioritization of tissues for
mechanistic characterization of genetic associations. Using
the hypothesis-free pathway analysis of T2D associations
with DEPICT (32), we highlighted a causal role of mTOR
signaling pathway in the etiology of T2D not observed from
individual loci associations. The mTOR pathway has
pre-viously been implicated in the link between obesity, insulin
resistance, and T2D from cell and animal models (44,49).
The current results emphasize that progressively larger
sample sizes, coupled with higher density sequence-based
imputation (13), will continue to represent a powerful
strat-egy for genetic discovery in T2D and in complex diseases
and traits more generally. At known T2D-associated loci,
identi
fi
cation of the most plausible T2D causal variants
will likely require large-scale multiethnic analyses, where
more diverse haplotypes, re
fl
ecting different patterns of
LD, in combination with functional (31,50,51) data allow
re
fi
nement of association signals to smaller numbers of
variants (2).
Funding.
ARIC.
The Atherosclerosis Risk in Communities (ARIC) Study is carried out as a collaborative study supported by National Heart, Lung, and Blood Institute contracts HHSN268201100005C, HHSN268201100006C, HHSN268201100007C, HHSN268201100008C, HHSN268201100009C, HHSN268201100010C, HHSN268201100011C, and HHSN268201100012C; R01HL087641, R01HL59367, and R01HL086694; National Human Genome Research Institute contract U01HG004402; and NIH contract HHSN268200625226C. Infrastructure was partly Figure 3—T2D loci stratified by patterns of quantitative trait (e.g.,glycemic, insulin, lipid, and anthropometric) effects show distinct cell-type annotation patterns. We hierarchically clustered loci based on endophenotype data and identified groups of T2D loci associated with measures of insulin secretion (A), insulin resistance (B), and BMI/ lipids (C). We then tested the effect of variants in cell-type enhancer and promoter chromatin states on the posterior probabilities of cred-ible sets for each group. We identified most significant effects among pancreatic (Panc.) islet chromatin for insulin secretion loci, CD14+