THE ASSOCIATION BETWEEN MOVEMENT QUALITY, CUMULATIVE INTERNAL TRAINING LOAD, AND MUSCULOSKELETAL SYSTEM RESPONSE IN COLLEGIATE
VOLLEYBALL PLAYERS
Samantha Nicole Cates
A thesis submitted to the faculty at the University North Carolina at Chapel Hill in partial fulfillment of the requirements for the degree of Master of Art in the Exercise and Sport Science
Department in the College of Arts and Sciences.
Chapel Hill 2016
©2016
ABSTRACT
Samantha Nicole Cates: The Association Between Movement Quality, Cumulative Internal Training Load, and Musculoskeletal System Response in Collegiate Volleyball Players
(Under the direction of Darin Padua)
Aberrant lower extremity biomechanics and high training loads are associated with
increased injury risk. This study determined the relationship between biomechanical patterns,
training load, cartilage thickness changes, and muscle response during the preseason of 17
collegiate female volleyball athletes (age= 19.7±1.2 years; weight= 77.1±8.7 kg; height=
170.4±10.1 cm). Lower extremity biomechanics were assessed using overhead squat and
jump-landing assessments. Vastus lateralis cross sectional area (CSA) and echo intensity and femoral
condylar cartilage thickness were measured via ultrasound prior to and following preseason.
Session-RPE and jump counts were totaled across all practice sessions. Individuals with poorer
LESS scores demonstrated less hypertrophy of the vastus lateralis (r= -0.672, p= 0.003).
Individuals with poorer overhead squat scores demonstrated greater decreases in medial femoral
condylar cartilage thickness (r= -0.544, p= 0.024). Poor movement quality could be an
underlying factor to quadriceps muscle inefficiency and femoral cartilage damage, which may
TABLE OF CONTENTS
LIST OF FIGURES………vi
LIST OF TABLES……….vii
LIST OF ABBREVIATIONS………..viii
CHAPTER I……….1
Introduction………..1
Purpose……….4
Variables………..………4
Research Questions and Hypothesis………5
CHAPTER II………7
Participation and Injury………7
Injury Risk Factors………...8
Movement Quality Assessments………10
Femoral Articular Cartilage………...11
Training Loads………...12
Musculoskeletal Response……….…14
Conclusion……….…15
CHAPTER III………16
Methodology………..16
Pre Practice Screening Session………..………17
Practice Session……….………26
Post Pre-season Session……….………26
Data Reduction………...………27
Statistical Analysis……….………29
CHAPTER IV………31
Introduction………31
Methods………..………33
Results………40
Discussion………..………50
Limitations……….…………55
Conclusion ………56
LIST OF FIGURES
Figure 3.1. Flow Chart of Data Collection………17
Figure 3.2. Vastus lateralis ultrasound measurement procedure………..18
Figure 3.3. Femoral condylar cartilage ultrasound measurement procedure………19
Figure 3.4. Sagittal view of jump-landing task……….20
Figure 3.5. Frontal view of jump-landing task………..………21
Figure 3.6. Sagittal view of overhead squat assessment………..….23
Figure 3.7. Frontal view of overhead squat assessment………...….24
Figure 3.8. Sagittal view of single leg squat assessment……….….25
Figure 3.9. Frontal view of single leg squat assessment………...…25
Figure 3.10. CSA of vastus lateralis panoramic ultrasound image………...28
Figure 3.11. Cartilage thickness measurement of femoral condylar cartilage…….…… 29
Figure 4.1. Cross Sectional Area Absolute Change vs. LESS Total………...……….…42
Figure 4.2. Cross Sectional Area Percent Change vs. LESS Total………..….42
Figure 4.3. Medial Cartilage Thickness Absolute Change vs. Overhead Squat Score.…44 Figure 4.4. Medial Cartilage Thickness Percent Change vs. Overhead Squat Score…...44
Figure 4.5. LESS score vs. Session RPE Total……….45
Figure 4.6. Overhead squat score vs. Session RPE Total……….…46
Figure 4.7. Single Leg squat score vs. Session RPE Total………...46
LIST OF TABLES
Table 3.1. Landing Error Scoring System Grading Rubric……….……..21
Table 3.2. Overhead Squat Grading Rubric………..22
Table 3.3. Single Leg Squat Grading Rubric………...….22
Table 4.1. Participant Demographics………....34
Table 4.2. Movement Quality Assessment Means………41
Table 4.3. Loading Variable Means………..45
Table 4.4. Pre to Post-Preseason Ultrasound Measurements………....48
Table 4.5. Pre to Post-Preseason Absolute Change in CSA and Cartilage Thickness vs. Movement quality and training load………49
LIST OF ABBREVIATIONS
CSA Cross sectional area
CHAPTER I
Introduction
Volleyball is one of the most popular sports to participate in worldwide.1 The incidence of injuries in collegiate volleyball players is highest in the preseason practice period with a rate of 6.19 per 1000 athlete-exposures. Lower extremity injuries, primarily ankle sprains, upper leg muscle-tendon strains, and knee internal derangements are most common, accounting for approximately 55% of practice injuries.2 Ankle injuries are the most common; however, knee injuries account for up to 20% of all injuries in volleyball players.3 Knee injuries have been identified as the most severe injuries experienced by volleyball athletes and are the most common overuse injuries seen in volleyball players.4 5 Even with appropriate treatment and rehabilitation, disability and time lost following a lower extremity injury is prevalent. Therefore, it is necessary to understand factors that may influence knee injuries in volleyball athletes.6
angular velocity.13 Volleyball athletes demonstrating aberrant biomechanical profiles during landing are believed to be at risk for knee injury.14
High training loads are also associated with increased injury rates in sport.8 15 A positive relationship has been found between the incidence of training injuries and the duration, intensity, and internal load of training sessions.15 Athletes who completed a high volume of training and high match exposures were at an increased risk for developing jumper’s knee.16 Training load modifications occur via alterations in frequency, duration, and intensity throughout a sport season.17 Fatigue is often a result of the interaction of these loading methods as well as the type of muscle contraction, physiological and training status of the individual, and environmental conditions.17 Due to the notable influence of both movement patterns and training load on injury risk, it is also important to understand how these factors may interact with each other.
Examining the interaction between movement patterns and training load requires the ability to assess both variables in a clinical or field based settings. Clinical assessments of movement quality are possible, as aberrant movement patterns identified through visual
and quantifying minutes of physical training.23 This method, session-RPE, has been
demonstrated to be a valid marker of training load and is associated with future risk of injury.17 As such, volleyball athletes displaying poor movement quality during clinical movement assessments like the LESS and squat tasks may experience greater overall training load, which can further increase one’s risk of injury.
Exercise involving repeated exposure to increased joint loading is a risk factor for developing knee osteoarthritis.24 After only a 30-minute duration of running or drop landing a significant deformation is seen using high-resolution magnetic resolution imaging (MRI) in femoral articular cartilage.24 25 MRI has been shown to accurately depict structural knee joint damage, but is an expensive, time consuming, and not widely available for clinicians to use. Fortunately, high-resolution ultrasound, which is inexpensive and widely available, is accurate at measuring femoral articular cartilage thickness in normal to moderately damaged cartilage.26 Due to the intense periods of exercise that athletes experience during a preseason, it is important to understand the effects of high training loads on musculoskeletal tissues and ultimately injury rates.15
Individuals’ biomechanical profiles may influence their relative training load.
Specifically, those with aberrant biomechanical profiles may be less mechanically efficient, thus experiencing greater relative training loads and placing greater stress on their soft tissue
Fatigue has also been associated with acute muscle damage through measurements of muscle cross sectional area and echo intensity during both concentric and eccentric fatigue exercises.29 Furthermore, greater differences in right and left cross sectional area and higher echo intensity of the vastus lateralis using diagnostic ultrasound is associated with increased risk of lower extremity injury in professional basketball players.30
Purpose
We are unaware of previous research examining the association between biomechanical patterns, relative training load, cartilage thickness, and soft-tissue stress. Therefore the purpose of this study is to determine the relationship between biomechanical patterns, fatigue, cartilage thickness changes, and muscle response during the preseason practice period of division one female volleyball athletes. By determining the relationship between biomechanical patterns, fatigue, cartilage thickness changes, and muscle response clinicians will be better able to assess volleyball players at risk for future injury.
Variables
• Independent:
o Overhead Squat o Single-Leg Squat
o Landing Error Scoring System
o Jump Count
• Dependent:
o Cumulative Internal Training Load (RPE * minutes of training) o Femoral Condyle Cartilage Thickness
o Vastus Lateralis Echo Intensity Research Questions and Hypothesis
1. Research Question 1: What is the association between movement quality during the overhead squat, single-leg squat, and jump-landing tasks with the change in vastus lateralis musculature over the pre-season in Division I collegiate female volleyball athletes?
• Research Hypothesis 1: Female volleyball athletes with poor movement quality during the overhead squat, single-leg squat, and jump-landing tasks will demonstrate a greater increase in vastus lateralis cross sectional area and echo intensity compared to those with good movement quality.
2. Research Question 2: What is the association between movement quality during the overhead squat, single-leg squat, and jump-landing tasks with the change in femoral condyle cartilage thickness over the pre-season in Division I collegiate female volleyball athletes?
3. Research Question 3: What is the association between movement quality during the overhead squat, single-leg squat, and jump-landing tasks with cumulative internal training load over the pre-season in Division I collegiate female volleyball athletes?
CHAPTER II
Participation and Injury
Knee injuries are common and debilitating in the athletic population, accounting for 15-50% of all sport related injuries.31 Of all sports-related knee injuries, patellofemoral disorders are the most common and are caused by patella mal-tracking, overuse, and trauma.16 32 33 The most common surgical interventions about the knee are meniscal repairs.32 During sport activities such as running, jumping, and pivoting the meniscus is put under tremendous stress, increasing the likelihood of injury.34 In sports, ligamentous injuries, specifically anterior cruciate ligament (ACL) tears and collateral ligament tears, account for a large percentage of all knee injuries.2 These injuries lead to serious consequences such as high treatment costs, decreased academic performance, time lost from sport, increased risk of early osteoarthritis, and increased risk of never returning to the same levels of activity as before injury.31 35-37
frequently to the meniscus (37%), the collateral ligaments (33%), and anterior cruciate ligament (26%).2
Patellar tendinopathy is the most common overuse injury in elite volleyball players, with an incidence of 28-40%.42 Jumper’s knee afflicts 50% of male volleyball players.43 Visnes et al16 found the mean annual incidence of jumper’s knee per year was 21% in males and 5% in
females. Overuse injuries in the knee are associated with longer disability in female volleyball players compared to males.4 Because knee injuries pose a threat to return to play and account for the most time lost from competition in volleyball compared to any other injury, researchers are focused on identifying potential risk factors that in the future will be beneficial in reducing the number of knee injuries.
Injury Risk Factors
A number of potential risk factors have been identified in an attempt to explain why some individuals are at an increased risk of knee injury.44 Two commonly observed risk factors are aberrant biomechanical patterns and high internal training loads. Aberrant biomechanical patterns and high internal training loads are independently considered predisposing factors to sustaining a knee injury; however, little research exists regarding the relationship between these two entities.7 8
Musculoskeletal injuries occurring during volleyball commonly result from jumping or landing during spiking and blocking maneuvers, and occur most often to the lower extremity.3 4 35 Outside and middle hitters have a higher rate of injury compared to setters and liberos.39 Bahr
and Bahr45 found that 89% of injuries occurred at the net where jumping was frequently required, and more specifically Jadhav et al3 observed that injuries occurred 33% of the time during
athletes commonly display lower extremity mechanics that are associated with elevated knee loading and injury risk when landing from a jump, including greater knee valgus angles and greater vertical ground reaction forces.46 47 In fact, Ferritti et al42 found that nearly all
ligamentous injuries in volleyball occurred during a phase of jumping. Severe knee injuries are primarily the result of a non-contact mechanism with no direct blow to the knee, implicating the individual’s movement pattern as the cause for injury.2
Aberrant lower extremity biomechanics are associated with an increased risk of acute and chronic knee injury in volleyball athletes. Greater knee valgus angle during functional tasks is a predisposing factor for non-contact knee injuries.48 Restricted ankle dorsiflexion and excessive hip adduction and internal rotation are associated with dynamic knee valgus collapse.49-51
Deficits in neuromuscular control of the trunk and consequently increased trunk displacement are associated with increased risk of knee injury.52 Furthermore, athletes who sustained an in-season injury generally displayed decreased core stability compared to uninjured athletes.53 Therefore, athletes must have adequate strength and range of motion in the hip, core, and ankle to aid in the prevention of acute and chronic knee injury.
loading rates, and high ankle inversion-eversion moments during jump-landing.10 13 56 57 Athletes that developed patellar tendinitis demonstrated decreased hamstring and quadriceps flexibility compared to athletes who were asymptomatic.58 Fortunately, these aberrant lower extremity biomechanics that put athletes at greater risk for future injury can be identified using quick, cost-effective movement assessments.
Movement Quality Assessments
Clinical movement assessments have been developed to identify individuals at increased
risk for lower extremity injury through the observation of aberrant lower extremity
biomechanics.18 Specifically the overhead squat, single leg squat, and jump-landing tasks have been used.19 21 59 Females are more likely to demonstrate greater hip adduction and flexion combined with knee valgus, greater knee frontal plane projection ankles, and generate less trunk, hip and knee isometric torque during a single leg squat task.6059 Individuals who displayed medial knee displacement were found to have less passive ankle dorsiflexion range of motion during a single leg squat, increased hip adductor activation, and increased coactivation of the gastrocnemius and tibialis anterior during an overhead squat.6162 Additionally, during a jump-landing task females tended to land in a more erect posture with less hip and knee flexion.63
frequently used in the clinical setting due to the simplicity of observing knee alignment during a weight-bearing task.59 Specifically medial knee displacement has been observed using the single leg squat, which is related to dynamic knee valgus.60 Studies show that females begin and end a single-leg squat maneuver in greater knee valgus compared to males, which could increase the risk for injury.60
The Landing Error Scoring System (LESS) possesses good criterion validity and
reliability in identifying individuals who exhibit aberrant jump-landing biomechanics.19 For the LESS, a higher score indicates poor jump-landing technique and a low score indicates a better jump-landing technique.19 The LESS consist of 22 scored items to determine a composite score for individuals: knee flexion angle at initial contact, hip flexion angle at initial contact, trunk flexion angle at initial contact, ankle plantar-flexion angle at initial contact, knee valgus angle at initial contact, lateral trunk flexion angle at initial contact, medial knee position at initial contact, stand width, foot position, asymmetric initial foot contact, asymmetric timing, asymmetric heel-toe/toe-heel, knee flexion displacement, hip flexion displacement, trunk flexion displacement, excessive trunk flexion displacement, maximum medial knee position, asymmetric loading, joint displacement, wobble, and overall impression.66 In general, females demonstrate significantly more landing errors when performing the LESS.67
Femoral Articular Cartilage
high intensity of joint impact and torsional loading.71Individuals with mild valgus malalignment (1.1-3.0 degrees) and greater valgus malalignment (3.1-5.0 degrees) are at increased risk for osteoarthritis disease progression. Individuals without evidence of radiographic osteoarthritis that have valgus malalignment greater than 5.1 degrees are at an elevated risk for future cartilage damage.68
High resolution MRI is the gold standard in examining cartilage morphology. However due to the high cost and limited access, high-resolution ultrasound has recently been described as a valid and reliable tool for assessment of distal femoral cartilage.26 72 73 Decreases in patellar, medial and lateral tibial, and medial and lateral femoral cartilage volume and thickness have been found following 30-60 minutes of running. 2474After a 30-minute drop landing exercise, decreased cartilage volume and thickness were found at the patella and medial and lateral tibia. Compared to the drop landing, greater cartilage deformation was noted after running.75
Training Loads
The majority of volleyball specific injuries occur during practice sessions rather than matches.38 55 76 During a five year period of volleyball play, 230 injuries occurred during training whereas only 133 injuries occurred during games in 114 Greek volleyball championship and local division players39. Augustsson et al38 reported 47% of all injuries occurred during
during the first half of the season with an overall preseason incidence of injury at 6.9 per 1,000 training hours.7815
High internal training loads, high training intensity, and high training duration are
associated with increased risk of acute injuries in athletes.15 16 79 Gabbett and Jenkins80 found that high training load was significantly related to contact and non-contact injuries in rugby players. Furthermore, overuse injuries are associated with increases in training volume.81 Volleyball players who suffered from jumper’s knee had increased training volume and higher match exposure compared to asymptomatic volleyball players.16 Monitoring internal load is important to measure the physiological and psychological stress imposed and is critical in determining the training load and adaptations.17 Session rating of perceived exertion (RPE) is a validated tool for measuring training load and is associated with future risk of injury.23 82 This method of
quantifying internal training load was developed by Foster et al23 and involves multiplying the athlete’s RPE (1-10) by the duration of the session (minutes). The category ratio rating of perceived exertion scale is as follows: 0- rest, 1- very, very easy, 2- easy, 3- moderate, 4- somewhat hard, 5- hard, 7- very hard, 10- maximal. 6, 8, and 9 are considered intermediary values between 5-10 with no RPE definition.
individuals both demonstrated higher LESS scores, reflective of poor movement quality, when they were acutely fatigued.85 Researchers found decreased knee flexion joint angles, greater knee valgus joint angles, lower ground reaction force, increased lateral and forward trunk flexion and increased peak proximal tibial anterior shear forces in acutely fatigued individiuals.28 86-89
Fatigue is also correlated to muscle and tendon damage through observing cross sectional area and echo intensity following acute bouts of concentric and eccentric fatigue exercises.29 Musculoskeletal Response
Muscle cross sectional area (CSA), an index of muscle size can be used as a direct measurement of muscle edema.90 The gold standard for the assessment of whole-muscle CSA is currently magnetic resonance imaging (MRI), but there are high cost and limited access
associated with this device. Recently, panoramic ultrasonography has been validated against MRI for detecting training induced changes in muscle CSA.91 Repetitive eccentric contractions cause muscle swelling as indicated by increases in muscle CSA measured via ultrasound imaging.90 More specifically, measurements of the vastus lateralis CSA using ultrasound have been validated against MRI.91 92 Takahashi et al93 found CSA of the vastus lateralis, intermedius, and medialis peaked 12-24 hours following a 20-minute bout of eccentric exercise. Similarly, Oyama et al94 found that increases in infraspinatus CSA were present immediately following and 24 hours after eccentric exercises.
echo intensity.98 Radaelli et al29 found significant increases in echo intensity 24-72 hours
following a bout of resistive exercises. After a maximum eccentric exercise of the elbow flexors echo intensity and muscle thickness significantly increased and peaked 4-5 days following exercise.99 Following 30 maximal voluntary lengthening contractions of the elbow flexors, echo intensity continued to increase at 48 and 120 hours post-exercise.96
Conclusion
CHAPTER III
Methodology
Subjects
17 women’s NCAA Division I varsity volleyball players were included in this study.
Inclusion Criteria
Member of the varsity volleyball team at the University of North Carolina at Chapel Hill for the 2015 season.
Exclusion Criteria
Participants who were unable to complete one or more of the tasks during baseline assessment were excluded from this study. Participants not currently cleared to participate in varsity athletics for any reason were excluded from this study. Participants who were unable to participate in a total of 3 or more pre-season practice sessions will be excluded from this study. Instrumentation
Standard Goniometer
Knee flexion angles were measured using a standard 30.5 cm plastic goniometer for femoral condyle cartilage measurements. Goniometric measurements of the knee have been validated against radiographic measurements.100
2D Cameras
practice sessions and watched at a later date by the primary investigator to count the number of jumps experienced by each participants.
Diagnostic Ultrasound
GE B-mode ultrasound (LOGIQ e 5, General Electric Company, Wisconsin, USA) was used to generate real-time panoramic cross-sectional image of the vastus lateralis and still frame images of the distal femoral cartilage.
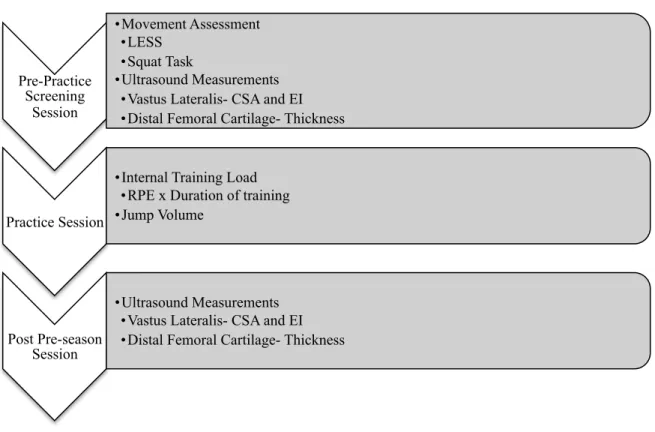
Testing Procedures (Figure 3.1)
Figure 3.1 Flow Chart of Data Collection Pre Practice Screening Session
Participants reported to the Sports Medicine Research Laboratory on the day prior to the start of the preseason practice period. The participants read and signed an informed consent form approved by the Institutional Review Board (IRB) of the University of North Carolina at Chapel
Pre-Practice Screening
Session
• Movement Assessment • LESS
• Squat Task
• Ultrasound Measurements • Vastus Lateralis- CSA and EI • Distal Femoral Cartilage- Thickness
Practice Session
• Internal Training Load • RPE x Duration of training • Jump Volume
Post Pre-season Session
Hill. Participants then completed a questionnaire to confirm player position, medical history, and contact information.
Panoramic Ultrasound Assessment
Vastus Lateralis
The participant was supine with the dominant leg (the leg they would use to jump off of for maximum height) extended and relaxed on the examination table. The ultrasound probe was held perpendicular to the tissue at the midpoint between the greater trochanter and lateral femoral epicondyle and was moved manually with slow and continuous movement from the lateral vastus lateralis border to the medial fascia separation.101 102 (Figure 3.2) Minimal pressure was applied to the skin to prevent muscular compression and distortion. Water-soluble transmission gel was applied to the skin to enhance vastus lateralis imaging. GE B-mode ultrasound (LOGIQ e 5, General Electric Company, Wisconsin, USA) was used to generate real-time panoramic cross-sectional image of the vastus lateralis. The ultrasound settings (frequency: 12Hz, gain: 68, depth: 4.0 cm) were kept consistent for all participants.
Femoral Articular Cartilage
The knee was examined with the participant supine with her dominant leg in 130° of
knee flexion. This knee flexion angle was measured using a standard goniometer to ensure the same knee flexion angle was used between subjects and during pre-testing and post-testing. The primary investigator palpated and drew a horizontal line at the most superior aspect of the patella. The transducer was centered at this marked point, and moved superiorly until the first point of the shadow of the patella was not observable. (Figure 3.3) The intercondylar notch was aligned to the middle bold line of the ultrasound screen grid. Three still framed images of the transverse femoral cartilage were obtained using GE B-mode ultrasound (LOGIQ e 5, General Electric Company, Wisconsin, USA). The height (screen grid reference point) of the bony interface of the middle and lateral femoral condyles were recorded to ensure the same pre-testing and post-testing anatomical alignment. The ultrasound settings (frequency: 12Hz, gain: 68, depth: 4.0 cm) were kept consistent for each scan.
Movement Quality Assessment
Landing Error Scoring System (LESS)19
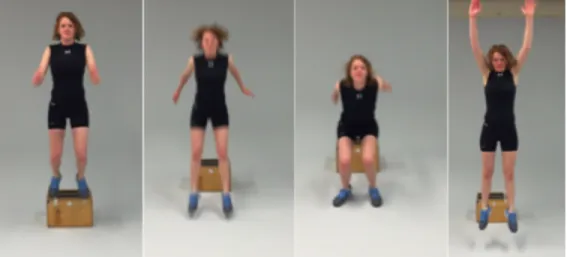
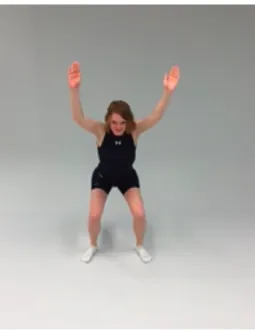
Participants wore a team issues sports bra and spandex shorts during movement quality assessments. During the Landing Error Scoring System (LESS), participants jumped down from a 30 cm high box placed at a distance ½ of the participant’s body height away from the target area. Participants were instructed to jump down and forward onto the target and immediately perform a second vertical jump for maximum vertical height. Three trials were performed.19 (Figure 3.4 and 3.5) Movement quality during the jump-landing was later scored using the LESS rubric, which is scored based on 22 observable items of human movement from initial contact to maximum knee flexion displacement. Lower extremity and trunk positioning are observed and rated at initial ground contact and between initial ground contact and the moment of maximum knee flexion angle. Foot positioning errors are assessed at initial ground contact and between initial contact and the moment of maximum knee flexion angle. Overall sagittal plane movement displacement and the rater’s general perception of the landing quality are scored. A higher LESS score indicated more high-risk movement patterns and a lower score indicated fewer high-risk movement patterns. Each jump was videotaped from the frontal and sagittal views. The videos were watched at a later date by the primary investigator and a LESS score was generated for each participant using the grading rubric. (Table 3.1)
Figure 3.5 Frontal view of jump-landing task.
Table 3.1 Landing Error Scoring System Grading Rubric19 66
Landing Error Scoring System: LESS 4 1. Knee Flexion at Initial Contact < 30 deg
2. Hip Flexion at Initial Contact Hips are not flexed
3. Trunk Flexion at Initial Contact Trunk is not flexed
4. Ankle Plantar-Flexion Angle at Initial Contact Land Heel to Toe (or) Flat Foot
5. Asymmetrical Foot Contact Not Symmetric
6. Asymmetrical Timing Feet do not land at the same time
7. Asymmetrical Heel-Toe/Toe-Heel Lands flat/heel-toe and the other foot lands toe-heel
8. Lateral Trunk Flexion at Initial Contact Trunk is NOT vertical
9. Medial Knee Position at Initial Contact Knees medial to midfoot
10. Stance Width: > shoulder width 11. Stance Width: < shoulder width 12. Max IR Foot Position Toes > 30 deg. IR
13. Max ER Foot Position Toes > 30 deg. ER
14. Knee Flexion Displacement < an additional 45 deg. of flexion after initial contact
15. Hip Flexion Displacement Hips DO NOT flex more than at initial contact
16. Trunk Flexion Displacement Trunk DOES NOT flex more than at initial contact
17. Excessive Trunk Flexion Displacement Trunk flexes past parallel with lower leg
18. Maximum Medial Knee Position≥ great toe
19. Asymmetrical Loading A weight shift is present
20. Wobble: in REAL-TIME Knee wobbles (demonstrates quick varus/valgus motion)
21. Joint Displacement Sagittal Plane
Squat Assessment
For each of the following movement assessments, participants were scored based on readily observable items of human movement. Each squat was videotaped from the frontal and sagittal views. The primary investigator replayed the videos at a later date and squat scores were generated for each participant using the grading rubrics (Table 3.2, 3.3). A higher squat score indicated poor technique and a lower score indicated better technique.
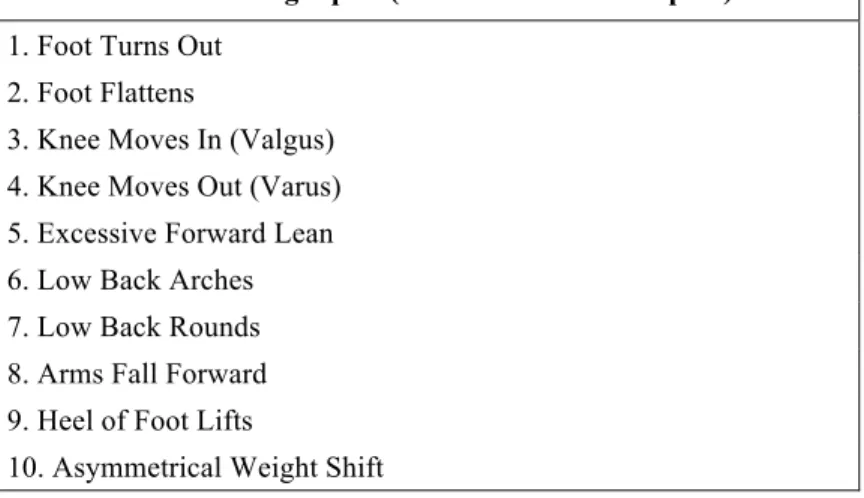
Table 3.2 Overhead Squat Grading Rubric
Overhead Leg Squat (feet shoulder width apart) 1. Foot Turns Out
2. Foot Flattens
3. Knee Moves In (Valgus) 4. Knee Moves Out (Varus) 5. Excessive Forward Lean 6. Low Back Arches 7. Low Back Rounds 8. Arms Fall Forward 9. Heel of Foot Lifts
10. Asymmetrical Weight Shift
Table 3.3 Single Leg Squat Grading Rubric
Single Leg Squat 1. Foot Flattens/Turns Out
2. Knee Moves In (Valgus) 3. Knee Moves Out (Varus) 4. Uncontrolled Trunk/Hip Shift 5. Loss of Balance
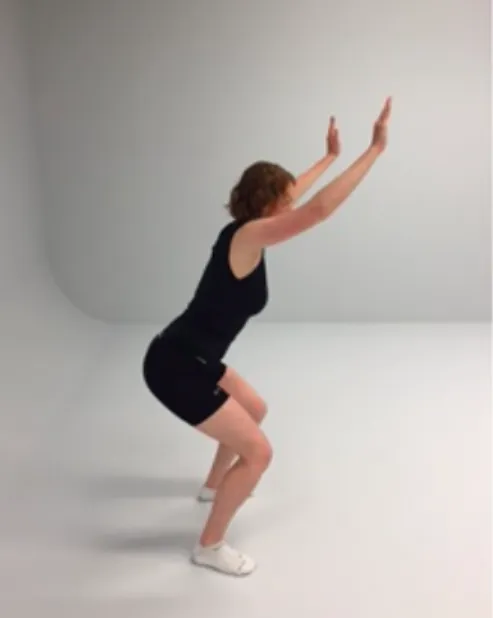
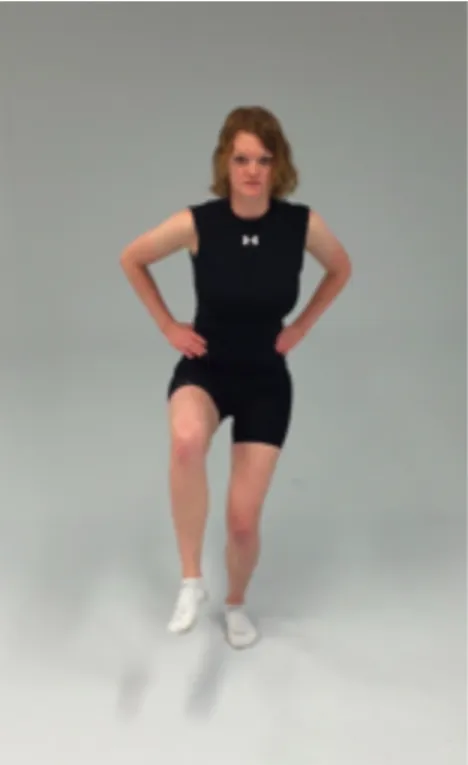
Overhead Squat Assessment (1 set of 5 repetitions)64
The participant stood with her feet shoulder-width apart with her arms extended vertically overhead. She descended into a squat to maximal comfortable flexion and then returned to the initial upright position. (Figure 3.6, 3.7) Participants were instructed to complete the squat in a slow and controlled manner. The participant completed 5 practice trials to familiarize herself with the task. The participant performed 5 consecutive squat trials.
Figure 3.7 Frontal view of overhead squat assessment.
Single Leg Squat Assessment (1 set of 5 repetitions bilateral)
The participant stood with her feet shoulder-width apart and raised one leg to 90° of hip
and knee flexion. (Figure 3.8, 3.9) The participant’s hands were placed on her hips. Participants were instructed to complete the squat in a slow and controlled manner. The participant
Figure 3.8 Sagittal view of single leg squat assessment.
Practice Session
Session Rate of Perceived Exertion
Within 30 minutes of the conclusion of each preseason practice session, participants verbalized their RPE to the primary investigator who recorded this number along with the type of training performed (volleyball practice, conditioning, weight lifting) and duration of training. This number was multiplied by the duration of practice in minutes. This produced a self-reported internal training load value for each participant. This method of quantifying internal training load was developed by Foster et al23 and involves multiplying the athlete’s RPE (1-10) by the
duration of the session (minutes). The category ratio rating of perceived exertion scale is as follows: 0- rest, 1- very, very easy, 2- easy, 3- moderate, 4- somewhat hard, 5- hard, 7- very hard, 10- maximal. 6, 8, and 9 are considered intermediary values between 5-10 with no RPE definition.23 The session rate of perceived exertion has been found to be a reliable and valid method of quantitating exercise training load.23 82 This method was developed to eliminate the need to utilize other methods of assessing exercise intensity.
Jump Volume
Each practice session was filmed and watched at a later date by the investigator to count the number of jumps experienced by each participant. A jump was defined as any volleyball maneuver that resulted in both feet leaving the ground.
Post Pre-season Session
Data Reduction
Ultrasound Analysis of Muscle and Cartilage
Ultrasound images were analyzed using ImageJ 1.48v software (National Institute of Health) by the primary investigator. The primary investigator performed all ultrasound
measurements and analyzed all ultrasound images. The primary investigator had excellent intra-rater reliability for CSA (ICC3,k= 0.994, SEM= 0.501), good intra-intra-rater reliability for echo intensity (ICC3,k = 0.878, SEM= 1.816), and excellent intra-rater reliability for medial (ICC3,k = 0.991, SEM= 0.004), intercondylar groove (ICC3,k = 0.997, SEM= 0.002), and lateral femoral condyle cartilage thickness (ICC3,k = 0.993, SEM= 0.002).
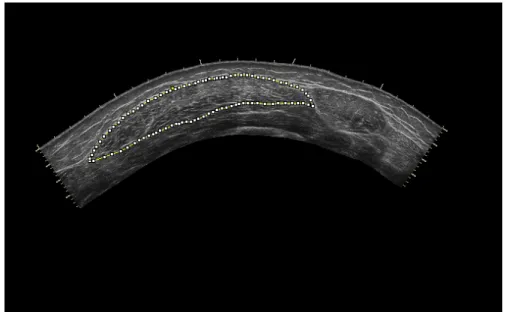
Images were calibrated by measuring the number of pixels within a known distance of 1 cm, prior to analysis. An outline of the vastus lateralis along the fascia border was traced to capture only the muscle to determine CSA (Figure 3.10).101 102 Muscle quality was determined from the echo intensity values by using grayscale- imaging software in the standard histogram function of pixels ranging from 0-255 (black= 0, white= 255).101-103 The same pre-selected region of interest used for the calculation of CSA was used to determine the mean echo intensity value. The average of the 3 images from pre-preseason testing and the average of 3 images from post-preseason testing were used as CSA and echo intensity pre and post results, respectively. To obtain the absolute change in CSA and echo intensity we subtracted the post-preseason averages from the pre-preseason averages. To obtain the percent change in CSA and echo intensity we divided the absolute change by the pre-preseason average and then multiplied by 100.
thickness.105 106 In order to keep consistency amongst participants, 1.5 cm from the left and right of the femoral groove thickness was used to determine the lateral and medial condyle cartilage thickness (Figure 3.11). The average thickness of each location from all 3 images from pre- and post-preseason testing sessions was used as pre and post thickness measurements, respectively. To obtain the absolute change in femoral condylar cartilage thickness we subtracted the post-preseason average from the pre-post-preseason average. To obtain the percent change in femoral condylar cartilage thickness we divided the absolute change by the pre-preseason average and then multiplied by 100.
Figure 3.11 Cartilage thickness measurement of femoral condylar cartilage.
Cumulative Internal Training Load
The total session-RPE for each individual was calculated by adding all session-RPE values together.
Jump Frequency
The total jumps for each individual was calculated by adding all jump frequencies from each practice together.
Statistical Analysis
Paired sample t-tests were performed to compare vastus lateralis CSA and echo intensity changes from pre- to post-preseason testing sessions and femoral condyle cartilage thickness changes from pre- to post-preseason testing sessions. A Pearson’s product-moment correlation coefficient was computed to determine the association between movement quality and
rate of perceived exertion recorded for each participant during the pre-season practice period. Vastus lateralis muscle damage was determined by the change in muscle cross sectional area prior to the pre-season practice period and the day following the final pre-season practice. Vastus lateralis muscle damage was determined by the change in echo intensity prior to the pre-season practice period and the day following the final pre-pre-season practice. Femoral condyle cartilage damage was determined by the change in cartilage thickness prior to the pre-season practice period and the day following the final pre-season practice. Statistical significance was
CHAPTER IV
Introduction
Volleyball has one of the highest participation rates worldwide.45 The knee is one of the most common and severe sites for acute and overuse injuries among volleyball players.1 2 4 6 38 39 Among collegiate women’s volleyball players knee injuries occur most frequently to the meniscus (37%), the collateral ligaments (33%), and anterior cruciate ligament (26%).2 Patellar tendinopathy is the most common overuse injury in elite volleyball players, with an incidence of 28-40%.42 Even with appropriate treatment and rehabilitation, these injuries lead to serious consequences, including high treatment costs, decreased academic performance, time lost from sport, increased risk of early osteoarthritis, and increased risk of never returning to previous levels of activity as before injury.31 35-37 Two factors that influence knee injury risk are aberrant lower extremity biomechanics and high training loads, thus these factors should be studied, so that interventions may be implemented to mitigate their negative effects.6-8
as a screening tool for identifying knee injury risk factors, however it is commonly used to identify aberrant lower extremity biomechanics.61 65 It is frequently used in the clinical setting due to the simplicity of observing knee alignment during a weight-bearing task.59 The Landing Error Scoring System (LESS) is a reliable and valid assessment of a jump-landing task that identifies movement patterns associated with increase risk of ACL injury and lower extremity stress fractures.22 107
High internal training loads, high training intensity, and high training duration increase acute and chronic injury risk.15 The session rate of perceived exertion (session-RPE) method is a valid marker of training load and is associated with future risk of injury.2382 Specifically,
volleyball players with high training and high match exposures have an increased risk for
developing jumper’s knee.16 Due to the notable influence of both movement patterns and training load on injury risk, it is important to understand how these factors may interact with each other and influence potential injury risks. This is especially true during preseason training periods.15
Internal training load may be influenced by an individual’s biomechanics. Specifically, individuals with aberrant biomechanical profiles may be less mechanically efficient, thus experiencing greater relative training loads and placing greater stress on their soft tissue structures.108 High internal training loads can result in musculoskeletal fatigue that leads to decreased muscle strength, reduced reaction time, impaired joint position sense, altered motor control and biomechanics, and deficits in dynamic stability.27 28 86-89 These acute changes from fatigue can increase injury risk. 28 86-89 Musculoskeletal fatigue is also correlated to muscle and tendon damage through measurements of cross sectional area (CSA) and echo intensity
highly correlated to fatty infiltration and fibrous tissue within skeletal muscle. 95-97 Muscle enlargement as measured by increases in CSA and intramuscular fibrous tissue as measured by increases in echo intensity is indicative of muscle damage.95-97
Aberrant biomechanics and exercise that results in repetitive joint loading are risk factors for developing knee osteoarthritis.24 68 69 Volleyball is considered to have high intensity of joint impact and torsional loading.71 These forces may result in acute cartilage thickness changes that can be identified with high-resolution ultrasound images of the distal femoral cartilage.26 72 73 The purpose of this study is to determine the relationship between biomechanical patterns, fatigue, cartilage thickness changes, and muscle response during the preseason practice period of division one female volleyball athletes. Determining the relationship between biomechanical patterns, internal training load, cartilage thickness changes, and muscle response will allow clinicians to better identify athletes at risk for future injury. Identifying these at-risk athletes will improve injury intervention strategy implementation.
Methods
Participants
Table 4.1 Participant Demographics
Demographics Mean±SD
Age 19.7±1.2
Height (cm) 170.4±10.1
Weight (kg) 77.1±8.7
BMI 26.6±3.1
Years of Experience 7.8±2.2
Research Design
This study employed a longitudinal cohort design. Participants visited the laboratory on 2 separate occasions separated by 11 days of preseason volleyball training. The pre-test session occurred the day prior to the start of pre-season training. During the pre-test session, participants completed ultrasound assessments of the vastus lateralis and femoral cartilage as well as clinical assessments of lower extremity movement quality. Training load was collected immediately following each of the 15 training sessions over the 11-day preseason period. The post-test session was completed within 24 hours following the pre-season training period; only the ultrasound assessments were completed during the post-test session.
Vastus Lateralis Ultrasound Measurement
artifacts and enhance acoustic coupling.98 The ultrasound probe was held perpendicular to the muscle and swept across the skin from the lateral vastus lateralis border to the medial fascia separation.101 102 The ultrasound settings were kept consistent for all participants (Frequency: 12 Hz, Gain: 68, Depth: 4.0 cm).
Femoral Articular Cartilage Ultrasound Measurement
Nine still framed images of the transverse femoral condyle cartilage (3- lateral; 3-femoral groove; 3-medial) at pre- and post-testing sessions were obtained for each participant.
Participants were seated with their dominant jumping limb109 in 130° of knee flexion. A horizontal line was drawn at the most superior aspect of the patella, as identified by palpation. The ultrasound probe was placed at this marked point, perpendicular to the knee articular surface (Figure 3.3).105 The intercondylar notch was aligned to the middle bold line of the ultrasound screen grid. The height (1 cm screen grid reference point) of the bony interface of the middle and lateral femoral condyles were recorded to ensure the same pre-testing and post-testing anatomical alignment. The ultrasound settings were kept consistent for each scan (Frequency: 12 Hz, Gain: 68, Depth: 4.0 cm).
Movement Quality Assessment
Jump-Landing Assessment
trials as needed to perform the assessment correctly. Three trials were recorded in frontal and sagittal views using standard 2-dimensional video cameras (Sony Handycam DCR-SX44, Sony Electronics, San Diego, California). The videos were scored at a later date by the primary investigator, using the LESS grading rubric (Table 3.1).110 The total LESS score for each
individual was calculated by determining the number of errors (22 total) presented in each jump-landing assessment.66 In order to be considered an error the participant had to demonstrate the compensation on at least 2 of the 3 jumps.
Overhead Squat Assessment
Single Leg Squat Assessment
Participants stood with their feet shoulder-width apart and raised one leg to 90° of hip
and knee flexion. (Figure 3.8, 3.9) The participant’s hands were placed on her hips. Participants were instructed to complete the squat in a slow and controlled manner. The participant
descended into a squat to maximal comfort and then returned to the initial upright position. Participants were not provided feedback or coaching on their squatting techniques unless they were performing the assessment incorrectly (e.g., beginning squats with the foot rotated in/out). Participants completed 5 practice trials. 5 consecutive trials were recorded in the frontal and sagittal views using standard 2-dimensional video cameras (Sony Handycam, DCR-SX44, Sony Electronics, San Diego, California). The videos were scored at a later date by the primary investigator and a single leg squat score was generated for each participant using the grading rubric (Table 3.3). The total single leg squat score for each individual was calculated by
determining the number of errors (9 total) presented in each squatting assessment. In order to be considered an error the participant had to demonstrate the compensation on at least 3 of the 5 squats.
Session Rate of Perceived Exertion
Jump Volume
Practice sessions were filmed and watched at a later date by the primary investigator, who counted the number of jumps each participant completed. A jump was defined as any volleyball maneuver that resulted in both feet leaving the ground.
Data Reduction
Ultrasound Analysis of Muscle and Cartilage
Ultrasound images were analyzed using ImageJ 1.48v software (National Institute of Health) by the primary investigator. The primary investigator performed all ultrasound
measurements and analyzed all ultrasound images. The primary investigator had excellent intra-rater reliability for CSA (ICC= 0.994, SEM= 0.501), good intra-intra-rater reliability for echo intensity (ICC= 0.878, SEM= 1.816), and excellent intra-rater reliability for medial (ICC= 0.991, SEM= 0.004), intercondylar groove (ICC= 0.997, SEM= 0.002), and lateral femoral condyle cartilage thickness (ICC= 0.993, SEM= 0.002).
from the pre-preseason averages. To obtain the percent change in CSA and echo intensity we divided the absolute change by the pre-preseason average and then multiplied by 100.
The distance between the thin hyperechoic line at the synovial space-cartilage interface and the sharp hyperechoic line at the cartilage-bone interface was used to measure femoral cartilage thickness.104 The midpoint of the image was used to determine femoral groove
thickness.105 106 In order to keep consistency amongst participants, 1.5 cm from the left and right of the femoral groove thickness was used to determine the lateral and medial condyle cartilage thickness (Figure 4.8). The average thickness of each location from all 3 images from pre- and post-preseason testing sessions was used as pre and post thickness measurements, respectively. To obtain the absolute change in femoral condylar cartilage thickness we subtracted the post-preseason average from the pre-post-preseason average. To obtain the percent change in femoral condylar cartilage thickness we divided the absolute change by the pre-preseason average and then multiplied by 100.
Cumulative Internal Training Load
The total session-RPE for the entire preseason period for each individual was calculated by adding all session-RPE values together.
Jump Frequency
The total jumps for each individual was calculated by adding all jump counts from each preseason practice together.
Statistical Analysis
product-moment correlations determined the association between movement quality (jump landing, overhead squat, and single leg squat assessments) and cumulative internal training load (session-RPE), movement quality and vastus lateralis muscle change, and movement quality and femoral condyle cartilage thickness change for all participants (Criteria for strength interpretation: strong= 1- 0.80 moderate to strong= 0.79- 0.66 moderate= 0.65-0.45, weak to moderate=
0.44-0.21, weak= 0.20- 0)111 Statistical significance was set at α<0.05. All data were analyzed using SPSS 23 (International Business Machines Corporation, New York, USA) statistical software Results
Pre-to-Post Preseason Period Muscle and Femoral Condylar Cartilage Comparisons
Muscle Characteristics
Vastus lateralis cross sectional area significantly increased from the pre- to post-preseason testing sessions (absolute change= 1.41±1.33cm2; t16= -4.37, p<0.001; percent change= 6.48±7.42%). No change was observed in vastus lateralis echo intensity (absolute change= 0.24±3.60; t16= -0.27, p= 0.79; percent change= 0.64±5.21%). Descriptive statistics and p-values are presented in Table 4.2.
Femoral Condyle Cartilage Characteristics
change= 0.323±10.542%). Descriptive statistics and P-values are presented for all femoral condyle cartilage characteristics data in Table 4.2.
Table 4.2. Movement Quality Assessment Means
Movement Assessment Mean ± SD
LESS 6.5±2.5
Overhead Squat 4.9±1.5
Single Leg Squat 5.6±2.1
Relationship Between Movement Quality, Muscle Characteristics, Femoral Condyle Cartilage
Thickness, and Internal Training Load
Movement Quality and Muscle Characteristics Relationship
A strong negative correlation (r (17)= -0.672, p= 0.003) was observed between the cross sectional area absolute change and the LESS scores (Figure 4.1). A moderate negative
Figure 4.1. Cross Sectional Area Change (cm2) vs. LESS Total
Figure 4.2 Cross Sectional Area Percent Change vs. LESS Total
y = -1.2519x + 8.2337 R² = 0.45133
0 2 4 6 8 10 12
-1.50 -1.00 -0.50 0.00 0.50 1.00 1.50 2.00 2.50 3.00 3.50 4.00 4.50 5.00
LES
S
T
otal
Cross Sectional Area Change (cm2)
Cross Sectional Area Absolute Change
vs. LESS Total
y = -0.1879x + 7.6891 R² = 0.3167
0 2 4 6 8 10 12
-10 -5 0 5 10 15 20 25 30 35
LES
S
T
otal
Cross Sectional Area Percent Change
Movement Quality and Femoral Condyle Cartilage Thickness Relationship
Figure 4.3. Medial Cartilage Thickness Absolute Change (cm) vs. Overhead Squat Score
Figure 4.4. Medial Cartilage Thickness Percent Change vs. Overhead Squat Score
y = -24.284x + 4.1269 R² = 0.29551
0 1 2 3 4 5 6 7 8 9
-0.15 -0.14 -0.13 -0.12 -0.11 -0.10 -0.09 -0.08 -0.07 -0.06 -0.05 -0.04 -0.03 -0.02 -0.01 0.00
O ve rh ead S q u at S cor e
Medial Cartilage Absolute Change (cm)
Medial Condyle Cartilage Absolute Change
vs. Overhead Squat Score
y = -0.0624x + 4.0432 R² = 0.19179
0 2 4 6 8 10
-40 -35 -30 -25 -20 -15 -10 -5 0
O ve rh ead S q u at S cor e
Medial Cartilage Percent Change
Table 4.3 Loading Variable Means
Loading Variable Mean ± SD
Jump Total 1016.1±511.8
Session-RPE Total 8309.4±1005.9
Movement Quality and Internal Training Load Relationship
Session-RPE was not significantly correlated to the LESS (r (17)= -0.223, p= 0.389) (Figure 4.3), overhead squat scores (r (17)= -0.066, p= 0.802), or single leg squat scores (r (17)= -0.002, p= 0.993) (Figure 4.5, 4.6, 4.7). Session-RPE was strongly positively correlated with jump total (r (17)= 0.716, p< 0.001) (Figure 4.8).
Figure 4.5. LESS score vs. Session RPE Total
y = -90.648x + 8895.9 R² = 0.04986 0
2000 4000 6000 8000 10000 12000
0 2 4 6 8 10 12
S
es
si
on
R
P
E
T
otal
LESS
Figure 4.6. Overhead Squat Score vs. Session RPE Total
Figure 4.7. Single Leg Squat Score vs. Session RPE Total
y = -44.27x + 8525.5 R² = 0.00433 0 2000 4000 6000 8000 10000 12000
0 1 2 3 4 5 6 7 8 9
S es si on R P E T otal
Overhead Squat Score
Overhead Squat Score vs. Session
RPE Total
y = -1.0431x + 8315.1 R² = 4.6E-06 0 2000 4000 6000 8000 10000 12000
0 2 4 6 8 10 12
S es se ion R P E T otal
Single Leg Squat Score
Figure 4.8. Session RPE Total vs. Jump Total
y = 0.3641x - 2009.2 R² = 0.51206
0 500 1000 1500 2000 2500
5000 6000 7000 8000 9000 10000 11000 12000
Ju
mp
T
otal
Session RPE Total
Table 4.4. Pre to Post-Preseason Ultrasound Measurements, presented as means, standard deviations, and percent change.
PRE POST PRE TO POST CHANGE
Mean SD 95% CI Mean SD 95% CI
Absolute
Change SD 95% CI
Percent
Change SD P value Cross Sectional Area (cm2)* 23.84 4.96 (21.29,
26.39) 25.25 4.92
(22.72,
27.78) 1.41 1.33
(2.09,
-0.72) 6.48 7.42 0.001 Echo Intensity
74.47 8.19 (70.26, 78.68) 74.70 6.78 (71.22, 78.19) 0.24 3.60 (-2.09, 1.61) 0.64 5.21 0.79 Medial Cartilage Thickness
(cm)* 0.211 0.066 (0.177, 0.245) 0.180 0.047 (0.156, 0.204) -0.031 0.033 (0.014, 0.048) -13.456 10.499 0.001
Femoral Groove Cartilage
Thickness (cm) 0.238 0.045 (0.215, 0.261) 0.238 0.049 (0.212, 0.263) 0.000 0.026 (-0.013, 0.013) 0.323 10.542 0.955
Lateral Cartilage Thickness
(cm)* 0.198 0.026 (0.185,
0.212) 0.175 0.026
(0.162,
0.189) -0.023 0.016
(0.015,
0.032) -11.716 7.705 0.001
* Significantly different between pre and post measurements at p=0.05.
Table 4.5. Pre to Post-Preseason Absolute Change in CSA and Cartilage Thickness vs. Movement quality and training load, presented as correlation coefficient and significance.
* Significantly correlated at p= 0.05
Table 4.6. Pre to Post-Preseason Percent Change in CSA and Cartilage Thickness vs. Movement quality and training load, presented as correlation coefficient and significance.
* Significantly correlated at p= 0.05 Cross Sectional
Area Echo Intensity
Medial Cartilage Thickness
Femoral Groove Cartilage Thickness
Lateral Cartilage Thickness R value P value R value P value R value P value R value P value R value P value
LESS -0.672* 0.003 0.400 0.111 -0.139 0.596 0.388 0.124 0.319 0.212
OHS -0.132 0.614 0.083 0.751 -0.544* 0.024 0.158 0.544 -0.137 0.600
SLS -0.203 0.434 0.043 0.871 0.040 0.878 -0.275 0.286 -0.161 0.537
Jump
Total -0.040 0.878 0.145 0.578 0.073 0.782 -0.146 0.576 -0.194 0.456
Session
RPE Total -0.203 0.434 0.043 0.871 0.429 0.086 -0.275 0.286 -0.161 0.537
Cross Sectional Area Echo Intensity Medial Cartilage Thickness Cartilage Thickness Femoral Groove Lateral Cartilage Thickness R value P value R value P value R value P value R value P value R value P value
LESS -0.563* 0.019 0.419 -0.191 -0.191 0.463 0.385 0.127 0.254 0.325
OHS 0.015 0.955 0.077 0.769 -0.438 0.079 0.124 0.637 -0.122 0.642
SLS -0.297 0.247 0.018 0.946 0.161 0.536 -0.331 0.194 -0.050 0.848
Jump Total -0.180 0.488 0.113 0.666 0.239 0.355 -0.214 0.410 -0.159 0.542
Session
RPE Total -0.297 0.247 0.018 0.946 0.161 0.536 -0.331 0.194 -0.050 0.848
Discussion
The findings of this study suggest that muscle CSA and femoral condylar cartilage
thickness change in response to pre-season volleyball training and this change is significantly
related to lower extremity biomechanical patterns. Individuals who demonstrate poorer
movement quality as measured by the LESS and overhead squat demonstrate smaller increases in
vastus lateralis hypertrophy and greater decreases in medial femoral condylar cartilage thickness.
There was no relationship between the single leg squat and muscle CSA and femoral condylar
cartilage thickness. We believe finding no relationship between single leg squat and muscle CSA
and femoral condylar cartilage thickness is directly related to the functionality of the single leg
squat. The single leg squat is not a maneuver that is commonly performed in volleyball, while
double-leg squatting and jumping are performed frequently and thus could be reason for the
relationships found in these particular movement quality assessments and musculoskeletal
response.
Quadriceps hypertrophy occurs early in resistance training programs.112 113 Defreitas et
al112 found a gradual weekly increase in quadriceps femoris CSA over an 8 week resistance
training period, with the highest increase in CSA and muscle quality noted in week 3 after only 9
resistance training sessions. Similar findings were observed for the hypertrophy of the vastus
lateralis and rectus femoris after 20 days of resistance training along with a significant increase
in maximal voluntary contraction of the quadriceps.113 We observed similar increases in vastus
lateralis hypertrophy (i.e. increases in vastus lateralis CSA; (mean difference= 1.41 cm2, SD=
1.33cm2)) following 11 days of volleyball training.
in CSA was not the result of edema. Echo intensity is a direct marker of interstitial fluid, adipose tissue, and intramuscular fibrous tissue located within the muscle belly and is an established measurement to quantify edema-induced muscle swelling.29 95-98 Damas et al114 proposed that early increases in muscle cross sectional area during resistance training are not caused by increases in myofibers due to the expansion of myofibrillar proteins (i.e. hypertrophy), but instead are directly related to edema-induced muscle swelling, measured by echo intensity. This suggests that there is a positive link between cross sectional area and echo intensity.
Surprisingly, in our study we found that vastus lateralis CSA is associated with a decrease in echo intensity, which signifies that hypertrophy is occurring rather than muscle damage due to edema or fibrous/fatty infiltration.114 Our findings are similar to Jajtner et al115 who observed increased vastus lateralis CSA and decrease in echo intensity from preseason to postseason during a collegiate soccer season.
ultrasound measurements within 12 hours post pre-season training. Furthermore, our study and
previous work employed vastly different training regimens. To our knowledge we are the only
study to examine vastus lateralis response to an 11-day pre-season training period for elite
female athletes. Previous research focuses on smaller bouts of resistance training on untrained
individuals.29 96 97 114
A significant moderate negative correlation was found between vastus lateralis CSA and
the LESS scores (r= -0.672). We propose that individuals with poor movement quality do not use
their quadriceps as efficiently as individuals with good movement quality and thus resulting in
less hypertrophy (i.e. smaller increases in CSA) in individuals with poor movement quality. Less
efficient and balanced use of the quadriceps during dynamic tasks may place increased stress on
the passive ligament structures of the knee, which could ultimately result in injury.117 118
Furthermore less quadriceps strength is linked to decreased stability of the patella, which
could lead to patella maltracking, and subsequent injury.119120 Individuals with anterior knee
pain demonstrated less isokinetic quadriceps muscle strength compared to healthy individuals.121
Also, individuals with patellofemoral pain syndrome have lower quadriceps muscle activity
during concentric and eccentric knee extension actions compared to healthy individuals.122
Quadriceps CSA, peak torque, and muscle volume were all smaller in women with
patellofemoral pain syndrome compared to the unaffected leg.123 These studies indicate knee
injuries potentially result from inefficient use of the quadriceps muscles due to aberrant
movement including lower vertical ground reaction force, knee extension moment, hip external
rotation moment, and greater navicular drop.120 Therefore, it is important to correct the aberrant
Lateral and medial femoral condylar cartilage thickness decreased across all participants
following an 11-day training cycle. Our findings are similar to other studies that have observed
decreases in femoral condylar cartilage thickness after short-term bouts of exercise.24 74 75
Previous studies, observed these changes immediately following single bouts of exercise lasting
less than 60 minutes2474 We observed these changes approximately 18-hours following multiple
bouts of high intensity exercise. This is interesting because we are now aware that cartilage
changes can occur and continue after longer periods of exercise. Future studies should focus on
cartilage changes following an entire season or longer and determine the duration of cartilage
deformation following exercise sessions.
Individuals who demonstrate poorer movement quality as measured by the overhead
squat are associated with a greater decrease in medial femoral condylar cartilage thickness (r=
-0.544). We are aware of the outlier present in the current study, but feel this value is acceptable
as it aligns with pervious studies that found similar changes in femoral condyle cartilage
thickness following acute bouts of exercise.24 Furthermore, the two individuals who exhibited the
largest absolute change in cartilage thickness are middle hitters. This finding signifies the need to
continue studying the volleyball population to determine the role of player position on
musculoskeletal response. While previous studies suggest that frequent squatting predisposes an
individual to the development of knee osteoarthritis,124 our study is the first to look at aberrant
squatting movement and how it relates to cartilage thickness changes. The relationship between
poor movement quality and greater medial femoral condylar cartilage thickness decrease across
the preseason period suggests that significant compressive loading on the medial cartilage is
occurring during training due to aberrant movement patterns. In our study nearly 60% of the
the knee is believed to increase the medial tibiofemoral compartment loading.125 126 This
abnormal loading of the knee articular cartilage is directly related to an increase risk of knee joint
osteoarthritis development.69 70127 Previous studies have found varus alignment during gait
analysis in individuals with medial knee joint osteoarthritis, but to our knowledge we are the first
study to find an association between dynamic knee varus during an observational squatting
assessment and decreases in medial condylar cartilage thickness.
It is important to correct aberrant movement patterns in order to decrease joint loading
and ultimately decrease the risk of osteoarthritis. Biomechanical strategies aim at decreasing
high knee adduction moments, which are associated with knee varus alignment.128 Hip abductor
strengthening programs help stabilize the frontal plane motion of the pelvis and trunk and
decrease the external knee adduction moment.129 130 Hip abductor strengthening programs and
proper jumping and landing technique training result in decreases in peak knee adduction
moments.129131 Conversely, another study found no decrease in knee adduction moments after an
abductor strengthening program, but this program included adductor strengthening as well.132
Bennel et al133 found after completing a 12-week exercise program consisting of either
neuromuscular training or quadriceps training that individuals with medial knee osteoarthritis
had no change in knee adduction moments, but reported a decrease in pain and improvement in
physical function.
Biomechanical strategies aimed at reducing joint loading are a novel, yet debated,
approach in the field of osteoarthritis research. Traditionally, orthotics, gait training, walking
aids, and bracing have been used to help decrease and prevent knee osteoarthritis progression.
need to continue studying biomechanical treatment options aimed at reducing aberrant
movement as they relate to knee osteoarthritis.134-142
In addition to providing insight into potential knee injury risk factors, this study may
have important implications for efficiently determining and monitoring training load. Training
load is commonly monitored through measures of external loading (e.g., jumps, hits, etc.), the
total training duration, and the duration of burst and recovery intervals during the session.143
However, internal load is also important to measure the physiological and psychological stress
imposed and is critical in determining the training load and adaptations.17 This includes, but is
not limited to session-RPE, heart rate, and training impulse methods.17 Previous studies support
that session-RPE is a good indicator of internal training load.17 23 In our study we found a strong
positive correlation (r= 0.716) between cumulative internal training load (session-RPE) and total
jumps (external load) during the pre-season volleyball training period. To our knowledge we are
the first study to find a strong relationship between session-RPE and jump frequency. Our
finding supports the use of the session-RPE method to monitor athlete’s training adaptations and
minimize the risk of fatigue, injury, and illness.17 Session-RPE could be a method that coaches
and clinicians use in the future to decrease time and money spent towards automatic jump
detection equipment or film analysis.
Limitations
The correlative nature of our study does not allow for the causative nature of changes in
musculoskeletal measurements to be determined. Thus, more research is necessary to determine
if poor movement quality is the underlying cause to smaller increases in cross sectional area and